Comprehensive Analysis of Australia's Economic Performance (2008-2018)
VerifiedAdded on 2022/11/13
|13
|2832
|80
Report
AI Summary
This report provides a comprehensive analysis of Australia's economic performance from 2008 to 2018, examining key macroeconomic indicators. It begins with an introduction to the Australian economy, highlighting its mixed nature and key sectors like agriculture, manufacturing, and services. The report then delves into a production output performance analysis, focusing on the real GDP growth rate and its fluctuations over the decade, including the impact of the 2008 financial crisis and recent droughts. The analysis also discusses government policies aimed at boosting productivity. A labor market analysis follows, examining unemployment rates and their trends, categorizing unemployment types (cyclical, structural, and frictional), and discussing government initiatives to address unemployment. Finally, a price level analysis assesses inflation rates, including a discussion of demand-pull and cost-push inflation, and the Reserve Bank of Australia's inflation targets. The report concludes by summarizing the findings, emphasizing the fluctuating GDP growth, the slow recovery post-financial crisis, and the impact of various factors on the Australian economy.
Running head: ECONOMIC PERFORMANCE OF AUSTRALIA
ECONOMIC PERFORMANCE OF AUSTRALIA
Name of the Student
Name of the University
Author Note
Course ID:
ECONOMIC PERFORMANCE OF AUSTRALIA
Name of the Student
Name of the University
Author Note
Course ID:
Paraphrase This Document
Need a fresh take? Get an instant paraphrase of this document with our AI Paraphraser
1ECONOMIC PERFORMANCE OF AUSTRALIA
Table of Contents
Introduction................................................................................................................................2
Production output performance analysis....................................................................................2
Labor Market Analysis...............................................................................................................5
Price Level Analysis..................................................................................................................7
Conclusion..................................................................................................................................9
Reference..................................................................................................................................11
2ECONOMIC PERFORMANCE OF AUSTRALIA
Introduction
The country, Australia is one of the well known country for its mixed economy. The
primary exporting goods are the products produced by the agricultural sector in Australia.
Hence, the agricultural sector in Australia contributes 3 per cent to their overall GDP
(Nff.org.au., 2019). Even there was a fall in the manufacturing industry of Australia, but
recently, at the beginning of 2019, they have started to recover. Thus, the mentioned country
have contributed about 6.1 per cent of the total GDP of Australia (Abs.gov.au., 2019).
Around 70 per cent of the Australian economy’s gross domestic product is represented by
Australia’s service sectors (Dfat.gov.au., 2019).
The primary produced goods in Australia are iron and ores, coal, beef, gold and
wheat. Australia mainly trades with China, United States, Singapore, Japan and New
Zealand. Australia and these countries trade in both way (Businessinsider.com.au., 2019).
Wesfarmers, Rio Tinto, Westpac Banking Corporation, Woolworths and BHP are the top
companies in Australia who earn a large proportion of revenues in Australia.
As known, the global developments of Australia majorly influences the financial
condition of the mentioned country. Australia experienced a rise in its GDP after the
recession, which took place from 1999 to 2008. Nevertheless, since, 2009, the economic
growth of Australia have declined. However, throughout 2017 and early 2018 experienced an
increase in their economy.
Production output performance analysis
The financial value of all the final finished products as well as the services
manufactured inside the economy is coined as Gross Domestic Product . GDP can be
categorized into two types. One of them in nominal GDP and the other one is real GDP.
According to Michl (2015), the real gross domestic product (GDP) is an indicator of
⊘ This is a preview!⊘
Do you want full access?
Subscribe today to unlock all pages.
Trusted by 1+ million students worldwide
3ECONOMIC PERFORMANCE OF AUSTRALIA
macroeconomics which measures the gross output of a country that gets revised whenever
there is a change in price. This type of GDP helps to compare the real volume of products in
the absence of inflation. Whereas, the inflation is considered by the nominal gross domestic
product. Thus, nominal GDP is also termed as inflation-adjusted gross domestic product. The
government of any country with the help of the real GDP examines as well as compares the
purchasing power of any company. In this way, the real GDP measures the economic
performance of any country.
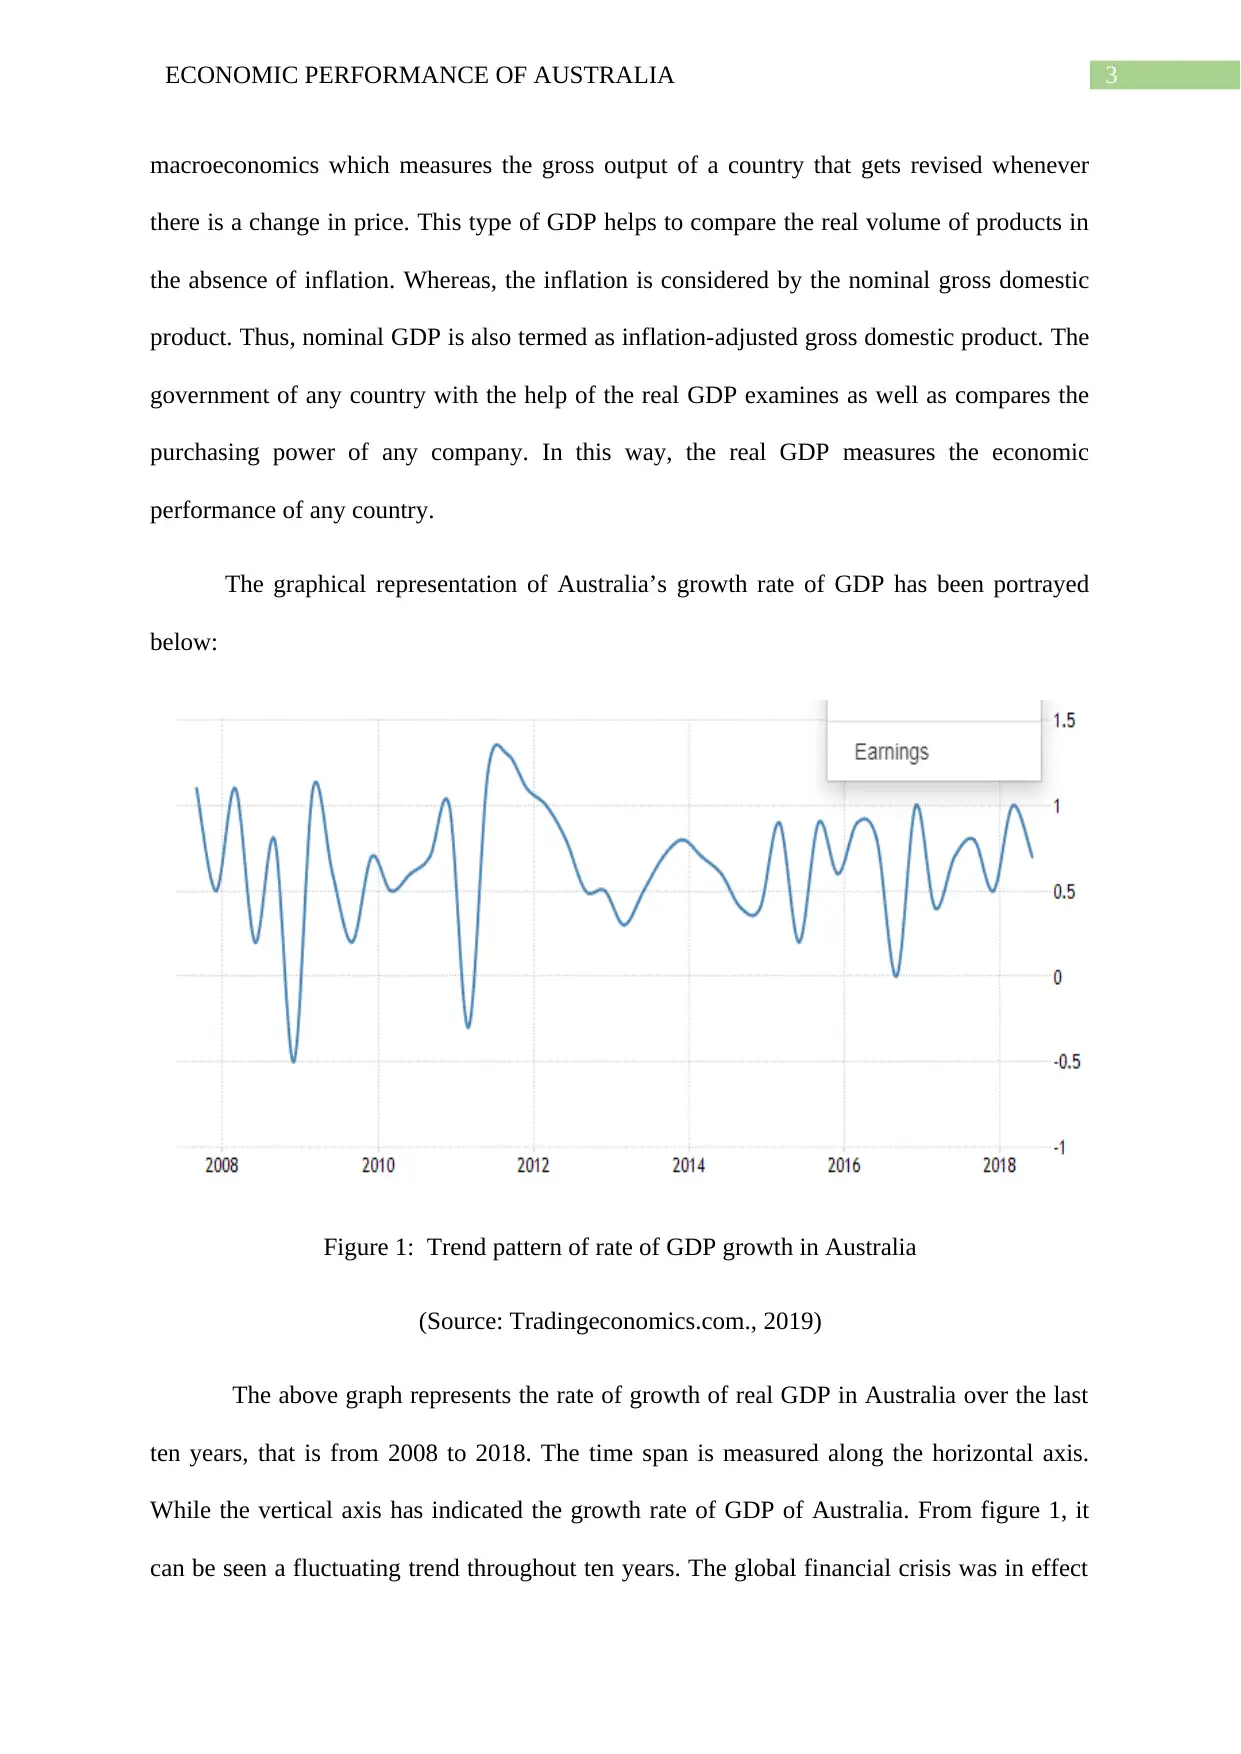
The graphical representation of Australia’s growth rate of GDP has been portrayed
below:
Figure 1: Trend pattern of rate of GDP growth in Australia
(Source: Tradingeconomics.com., 2019)
The above graph represents the rate of growth of real GDP in Australia over the last
ten years, that is from 2008 to 2018. The time span is measured along the horizontal axis.
While the vertical axis has indicated the growth rate of GDP of Australia. From figure 1, it
can be seen a fluctuating trend throughout ten years. The global financial crisis was in effect
macroeconomics which measures the gross output of a country that gets revised whenever
there is a change in price. This type of GDP helps to compare the real volume of products in
the absence of inflation. Whereas, the inflation is considered by the nominal gross domestic
product. Thus, nominal GDP is also termed as inflation-adjusted gross domestic product. The
government of any country with the help of the real GDP examines as well as compares the
purchasing power of any company. In this way, the real GDP measures the economic
performance of any country.
The graphical representation of Australia’s growth rate of GDP has been portrayed
below:
Figure 1: Trend pattern of rate of GDP growth in Australia
(Source: Tradingeconomics.com., 2019)
The above graph represents the rate of growth of real GDP in Australia over the last
ten years, that is from 2008 to 2018. The time span is measured along the horizontal axis.
While the vertical axis has indicated the growth rate of GDP of Australia. From figure 1, it
can be seen a fluctuating trend throughout ten years. The global financial crisis was in effect
Paraphrase This Document
Need a fresh take? Get an instant paraphrase of this document with our AI Paraphraser
4ECONOMIC PERFORMANCE OF AUSTRALIA
in the year 2008. The financial crisis also continued till the beginning of 2009. In the year
2009, Australia experienced a negative GDP growth rate. After the financial crisis, Australia
is slowly recovering its GDP growth rate. However, late 2011 and throughout 2012 there was
a drastic rise in the rate of growth of Australian GDP. The rate of growth in GDP of Australia
rose by about 2.9 per cent from 2016 to 2018. Till date, Australia is trying to recover their
GDP growth rate slowly. Though in late 2018, Australia has faced a sudden drop in its GDP
growth rate. This was because they met the adverse climatic condition, which was drought
throughout the end of 2018 (Deloitte, 2019).
One of the significant sources of economic growth, in the long run, is known to be
productivity. In order to increase the production of Australia, the Australian government
adopted many policies. The government reduced taxes, which increased the total demand
level. As a result, the production output also increased. Investment, as well as savings, were
encouraged by the government of the concerned country in the long run, which resulted in a
rise in the production level. In this way, the government promoted economic growth in
Australia (Pc.gov.au., 2019).
When the Australian economy experienced a downfall in their economic growth due
to adverse climatic condition, recently the central bank of Australia has lowered down the
inflation rate. Due to the lowering in the rate of interest, the borrowing became cheap, and
thus the country started to borrow money (Downes, Hanslow, & Tulip, 2014). Therefore, this
helped the employment to rise, which resulted in the country to produce more. This is leading
Australia to achieve the target of inflation. When the central bank of Australia announced the
interest rate cut, the company started to pay more to the employees working in the company.
This resulted in more labor force. Hence, labor productivity increased. As a result, the
production output of Australia also increased.
5ECONOMIC PERFORMANCE OF AUSTRALIA
Labor Market Analysis
As per Ezzy (2017), unemployment refers to those individuals who do not have jobs
in spite of being eligible in terms of age and skills. To study the labor market condition of
Australia, the most significant measure is the rate of unemployment. This type of rate is
measured by calculating the percentage of individuals who are not employed. In order to
study the labor market in Australia, the Australian Bureau of Statistics (ABS) collects the
data regarding the labor market (rba.gov.au., 2019). They categorize them into three types:
Unemployed Individuals, individuals who are employed and individuals who are seeking for
jobs.
Under unemployment there are three categories. They are cyclical, structural as well
as frictional unemployment.
Structural- This type of unemployment happens when the economy suffers from a prolonged
recession.
Frictional- Even in a stable as well as in the growing economy, this kind of unemployment
comes into effect. Thus, frictional unemployment indicates those group of unemployment
where individuals get new jobs and workers who are working leaves the old jobs.
Cyclical- When the economy faces crisis and boom, then this type of unemployment occurs.
⊘ This is a preview!⊘
Do you want full access?
Subscribe today to unlock all pages.
Trusted by 1+ million students worldwide
6ECONOMIC PERFORMANCE OF AUSTRALIA
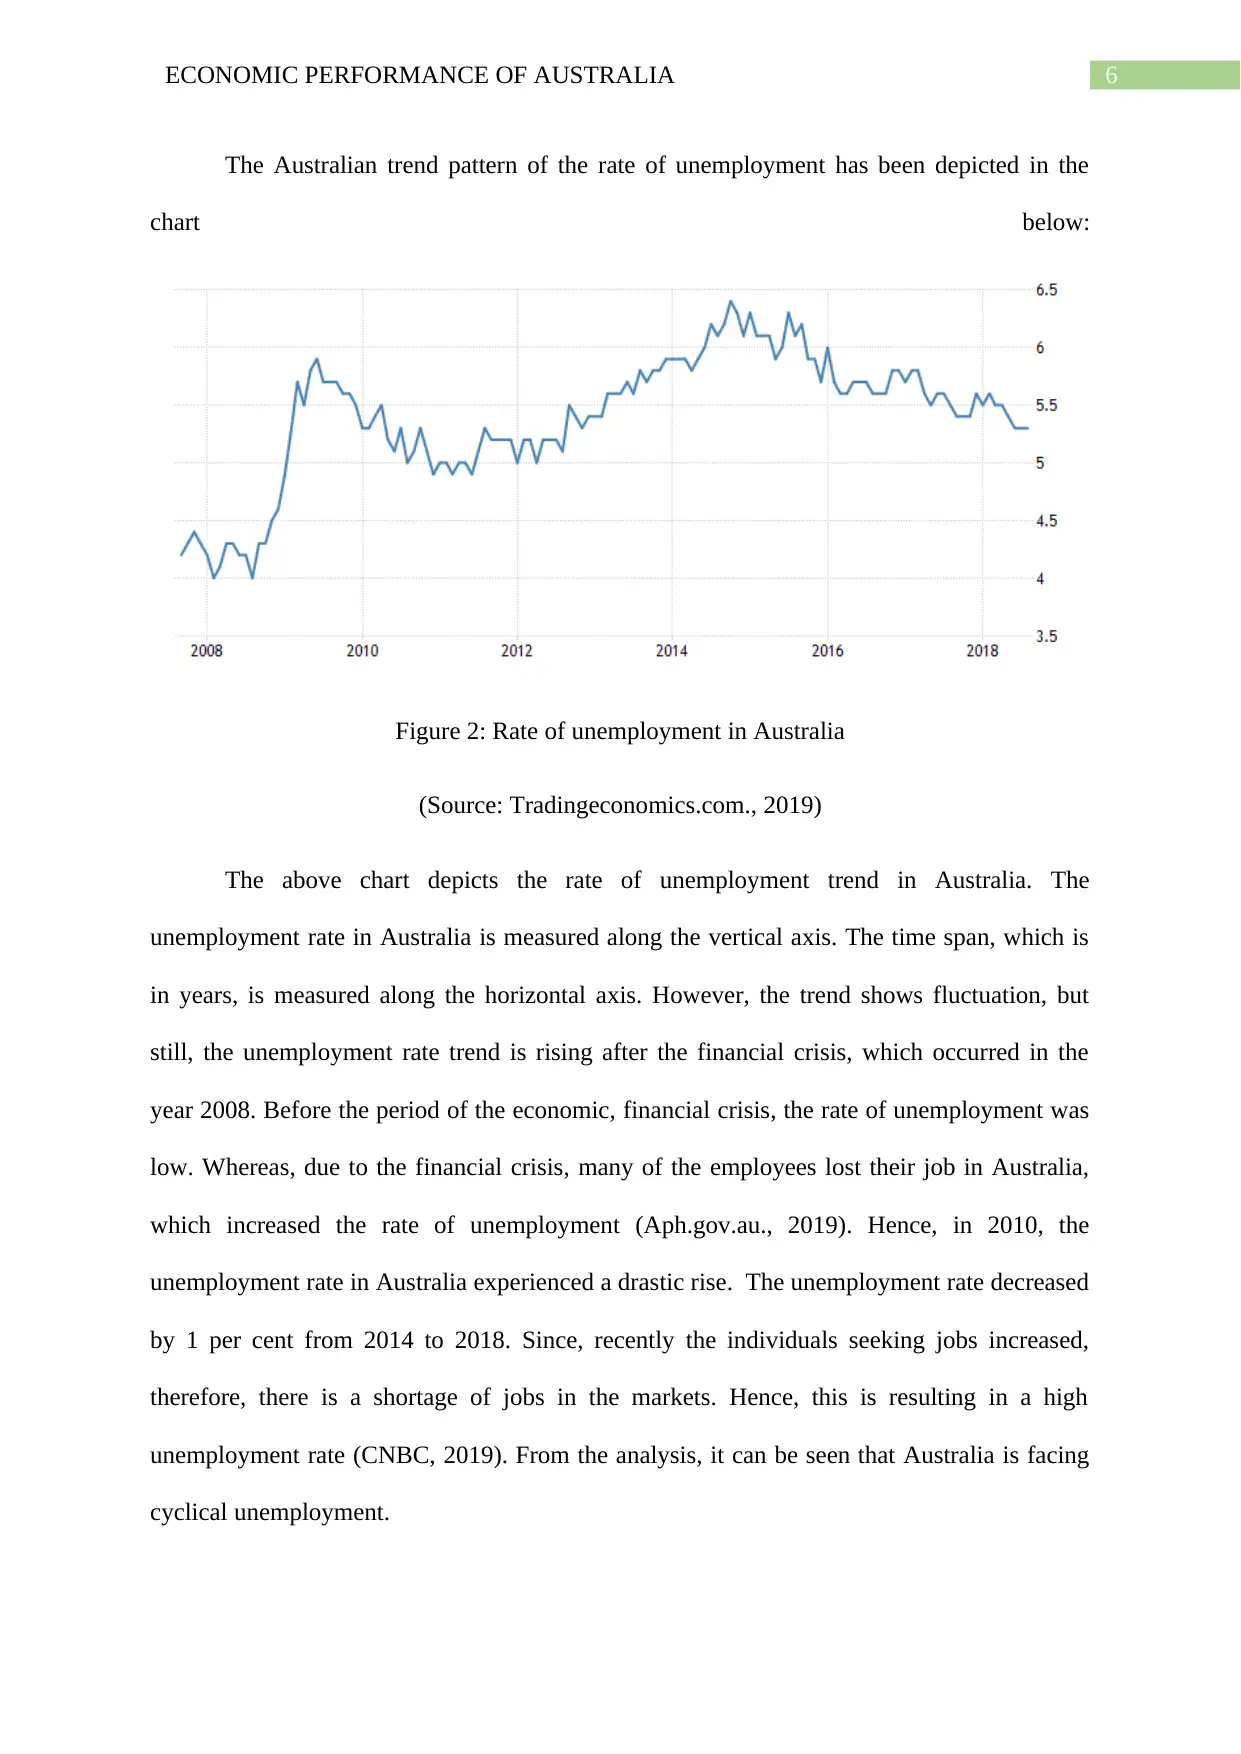
The Australian trend pattern of the rate of unemployment has been depicted in the
chart below:
Figure 2: Rate of unemployment in Australia
(Source: Tradingeconomics.com., 2019)
The above chart depicts the rate of unemployment trend in Australia. The
unemployment rate in Australia is measured along the vertical axis. The time span, which is
in years, is measured along the horizontal axis. However, the trend shows fluctuation, but
still, the unemployment rate trend is rising after the financial crisis, which occurred in the
year 2008. Before the period of the economic, financial crisis, the rate of unemployment was
low. Whereas, due to the financial crisis, many of the employees lost their job in Australia,
which increased the rate of unemployment (Aph.gov.au., 2019). Hence, in 2010, the
unemployment rate in Australia experienced a drastic rise. The unemployment rate decreased
by 1 per cent from 2014 to 2018. Since, recently the individuals seeking jobs increased,
therefore, there is a shortage of jobs in the markets. Hence, this is resulting in a high
unemployment rate (CNBC, 2019). From the analysis, it can be seen that Australia is facing
cyclical unemployment.
Paraphrase This Document
Need a fresh take? Get an instant paraphrase of this document with our AI Paraphraser
7ECONOMIC PERFORMANCE OF AUSTRALIA
To improve the growth in employment, the government in Australia are nowadays
getting associated with the G20 partners so that they can solve the problems faced globally.
They are trying to bring effective policies so that the economy of Australia develops. Due to
government action in Australia, over 2 million jobs are generated (Oecdobserver.org., 2019).
This action will provide jobs to the individuals who are searching for it. Hence, the
unemployment rate may reduce. The Australian government is also trying to improve the
services related to the employment system. The main aim behind restructuring the
unemployment system is that there will be more incentives provided to the employees
working and restructuring the payment structure. Government of Australia is also trying to
restructure the laws related to the workplace through reforms in order to balance the relation
in the workplace environment.
Price Level Analysis
Inflation in economic term explains the time when there the purchasing value
decreases and the level of price rises. There are two types of inflation. Cost-push inflation as
well as the demand-pull inflation are considered the major cause behind the inflation. When
the total economies demand exceeds more than the economies total supply, then inflation is
known to be the cause of demand-pull inflation. The rise in inflation happens because the
economy of a country moves along the Philips curve, which results to fall in the
unemployment rate and rise in GDP. Demand-pull inflation is caused when the government
reduces taxes. Whereas, when the production costs, which can be said the raw materials or
the wages increases resulting in the rise in the overall price, then there will be cost-push
inflation (Ball, 2017). When demand is found to be inelastic, then the inflation, which is
caused, is known to be cost-push inflation. Other than these two, there are many types of
inflation such as currency inflation, deficit-induced inflation, credit inflation and
hyperinflation.
8ECONOMIC PERFORMANCE OF AUSTRALIA
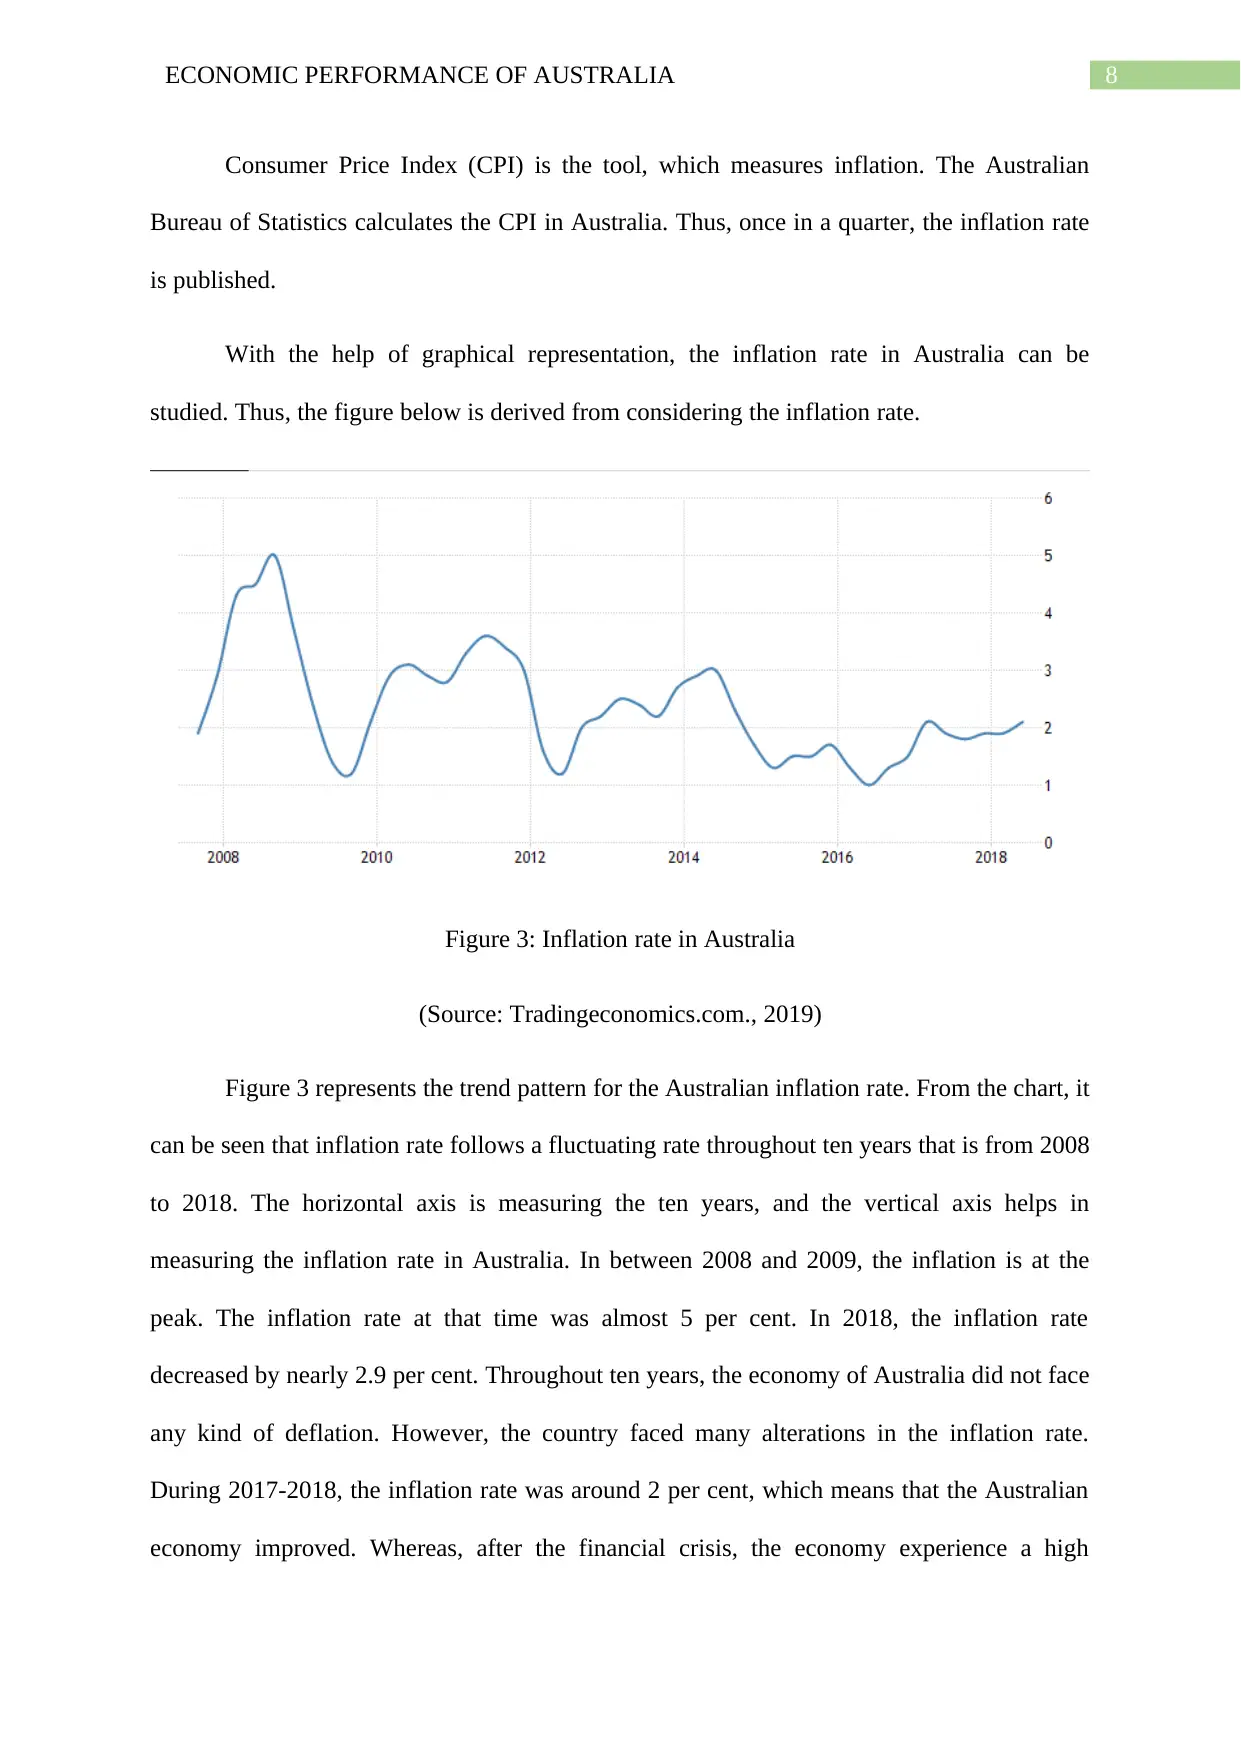
Consumer Price Index (CPI) is the tool, which measures inflation. The Australian
Bureau of Statistics calculates the CPI in Australia. Thus, once in a quarter, the inflation rate
is published.
With the help of graphical representation, the inflation rate in Australia can be
studied. Thus, the figure below is derived from considering the inflation rate.
Figure 3: Inflation rate in Australia
(Source: Tradingeconomics.com., 2019)
Figure 3 represents the trend pattern for the Australian inflation rate. From the chart, it
can be seen that inflation rate follows a fluctuating rate throughout ten years that is from 2008
to 2018. The horizontal axis is measuring the ten years, and the vertical axis helps in
measuring the inflation rate in Australia. In between 2008 and 2009, the inflation is at the
peak. The inflation rate at that time was almost 5 per cent. In 2018, the inflation rate
decreased by nearly 2.9 per cent. Throughout ten years, the economy of Australia did not face
any kind of deflation. However, the country faced many alterations in the inflation rate.
During 2017-2018, the inflation rate was around 2 per cent, which means that the Australian
economy improved. Whereas, after the financial crisis, the economy experience a high
⊘ This is a preview!⊘
Do you want full access?
Subscribe today to unlock all pages.
Trusted by 1+ million students worldwide
9ECONOMIC PERFORMANCE OF AUSTRALIA
inflation rate, which did not help the economy to grow. Thus, from the above graphical
analysis, it can be stated that from 2014 Australia is experiencing a stable economic condition
because of the low inflation rate.
The central bank of Australia is targeting to keep the inflation rate in Australia to be
in between 2 to 3 per cent. The aim behind it is to achieve stability in price, economic
welfare, reducing unemployment. If the price becomes stable, then high inflation, as well as
low inflation, will become stable. The target is set at 2 to 3 per cent because the government
of Australia believes that at these levels the economy of Australia can attain steady growth in
both employment as well as output (NewsComAu., 2019).
Conclusion
From the above analysis the report has been prepared to study the Australian
economic performance with the help of labor market analysis, price level analysis and
product market output analysis. Three macroeconomic indicators have been considered. The
analysis of the performance have been done considering the period from 2008 to 2018. The
outcome states that the GDP growth rate of Australia always experienced a fluctuation
throughout the mentioned years. It has also been seen that Australia is slowly recovering its
growth rate in GDP after the global financial crisis in the year 2008. The study also found
that the government of Australia have implemented new policies to increase productivity.
In the case of the unemployment rate, it has been found that recently, the
unemployment rate is decreasing. The economy faced high unemployment rate just after the
time when the world faced a financial crisis. To improve the employment rate from the study,
it has been found that the government of Australia are collaborating with the G20 partners,
which is resulting in more jobs and reducing the unemployment rate.
Paraphrase This Document
Need a fresh take? Get an instant paraphrase of this document with our AI Paraphraser
10ECONOMIC PERFORMANCE OF AUSTRALIA
Lastly, from studying the rate of inflation in Australia, the outcome stated that after
the financial crisis, the economy experienced hyperinflation, but gradually the inflation rate is
decreasing. During 2014 to 2016, the inflation rate was weakened, which resulted in low
growth in the economy. Thus, the Australian government thought of setting the target level of
inflation rate between 2 per cent to 3 per cent. They thought of doing it because they believe
it may help the price level stable. As a result, there will be growth in the economy.
11ECONOMIC PERFORMANCE OF AUSTRALIA
Reference
Abs.gov.au. (2019). Retrieved 16 September 2019, from
https://www.abs.gov.au/ausstats/abs@.nsf/ViewContent?
readform&view=ProductsbyTopic&Action=Expand&Num=1.11.2
Aph.gov.au. (2019). Employment in Australia – Parliament of Australia. Retrieved 17
September 2019, from
https://www.aph.gov.au/About_Parliament/Parliamentary_Departments/
Parliamentary_Library/pubs/BriefingBook45p/EmploymentAustralia
Ball, R. J. (2017). Inflation and the Theory of Money. Routledge.
Businessinsider.com.au. (2019). Here are Australia's top 10 two-way trading partners.
Retrieved 16 September 2019, from https://www.businessinsider.com.au/here-are-
australias-top-10-two-way-trading-partners-2014-8
CNBC. (2019). Australia's May jobs growth misses expectations as full-time employment
falls. Retrieved 17 September 2019, from
https://www.cnbc.com/2018/06/13/australias-unemployment-rate-fell-in-may.html
Deloitte. (2019). Australia. Retrieved 16 September 2019, from
https://www2.deloitte.com/us/en/insights/economy/asia-pacific/australia-economic-
outlook.html
Dfat.gov.au. (2019). The importance of services trade to Australia. Retrieved 16 September
2019, from https://dfat.gov.au/trade/services-and-digital-trade/Pages/the-importance-
of-services-trade-to-australia.aspx
Downes, P. M., Hanslow, K., & Tulip, P. (2014). The effect of the mining boom on the
Australian economy. Reserve Bank of Australia research discussion paper, (2014-08).
⊘ This is a preview!⊘
Do you want full access?
Subscribe today to unlock all pages.
Trusted by 1+ million students worldwide
1 out of 13
Related Documents


Your All-in-One AI-Powered Toolkit for Academic Success.
+13062052269
info@desklib.com
Available 24*7 on WhatsApp / Email
![[object Object]](/_next/static/media/star-bottom.7253800d.svg)
Unlock your academic potential
Copyright © 2020–2026 A2Z Services. All Rights Reserved. Developed and managed by ZUCOL.