Analyzing GDP and Economic Growth in Australia: A Comprehensive Study
VerifiedAdded on 2020/04/07
|15
|3182
|80
Essay
AI Summary
This essay provides a comprehensive overview of Australia's Gross Domestic Product (GDP) and economic growth, highlighting its impressive performance over the past few decades. It delves into the country's economic achievements, including low unemployment and inflation rates, and examines the contributions of key sectors like mining, services, and manufacturing. The essay explores both nominal and real GDP, providing data from 2005 to 2015, and discusses the factors behind Australia's sustained economic growth, such as economic reforms, population growth, and strategic geographical location. It analyzes the impact of the global financial crisis and the role of the floating exchange rate in maintaining economic stability. Furthermore, the essay examines sector-wise growth, detailing the changes in industry output and employment, and the composition of GDP. It also covers the performance measures of major industries and the growth within the service sector, concluding with the importance of economic growth for improving living standards and reducing unemployment.
Running head: GDP AND ECONOMIC GROWTH IN AUSTRALIA
GDP and Economic Growth in Australia
Name of the Student:
Name of the University:
Author note:
GDP and Economic Growth in Australia
Name of the Student:
Name of the University:
Author note:
Paraphrase This Document
Need a fresh take? Get an instant paraphrase of this document with our AI Paraphraser
1GDP AND ECONOMIC GROWTH IN AUSTRALIA
Introduction
Australia is world’s one of the most developed economies. It is also world’s one of the
biggest mixed market economies. Australia ranks second among the most wealthiest nations of
the world in terms of wealth per capita, preceded by only Switzerland. In June 2016, total wealth
of Australia was AUD 8.9 trillion. The country became 12th among the largest economies of the
world as per nominal GDP and 19th as per PPP adjusted GDP in 2016. The GDP of Australia was
1.205 trillion USD or 1.69 trillion AUD in 2016. The GDP per capita was $51,850 in nominal
terms in 2016, which is a very high figure. It has faced an inflation rate of 1.9% in June 2017,
and the rate of unemployment is 5.6% in August 2017 (Austrade.gov.au 2017).
Australia has the record of having uninterrupted economic growth for almost twenty
years. No other developed country has this long period of growth. The country has not witnessed
any technical recession in the past 26 years. Economic performance of the country has been
extremely well in Australia. The global financial crisis of 2007-08 could not affect Australia as
much it hit other economies. The major sectors of the economy are services, construction,
mining, manufacturing and agriculture. The service sector contributes maximum in the GDP of
Australia. 2009-10 saw the mining boom in Australia. Although the growth of the mining sector
has declined, still the economy remained stable and resilient and as not faced any recession since
1991. The country ranks 25th in exporting and 20th in importing of goods and services. It also
entered in Free Trade Agreement with China, Japan, and Korea, which has helped the country to
grow its production immensely in the past decade (industry.gov.au 2015). The following essay
focuses on the GDP and economic growth of Australia in the last few years.
2GDP AND ECONOMIC GROWTH IN AUSTRALIA
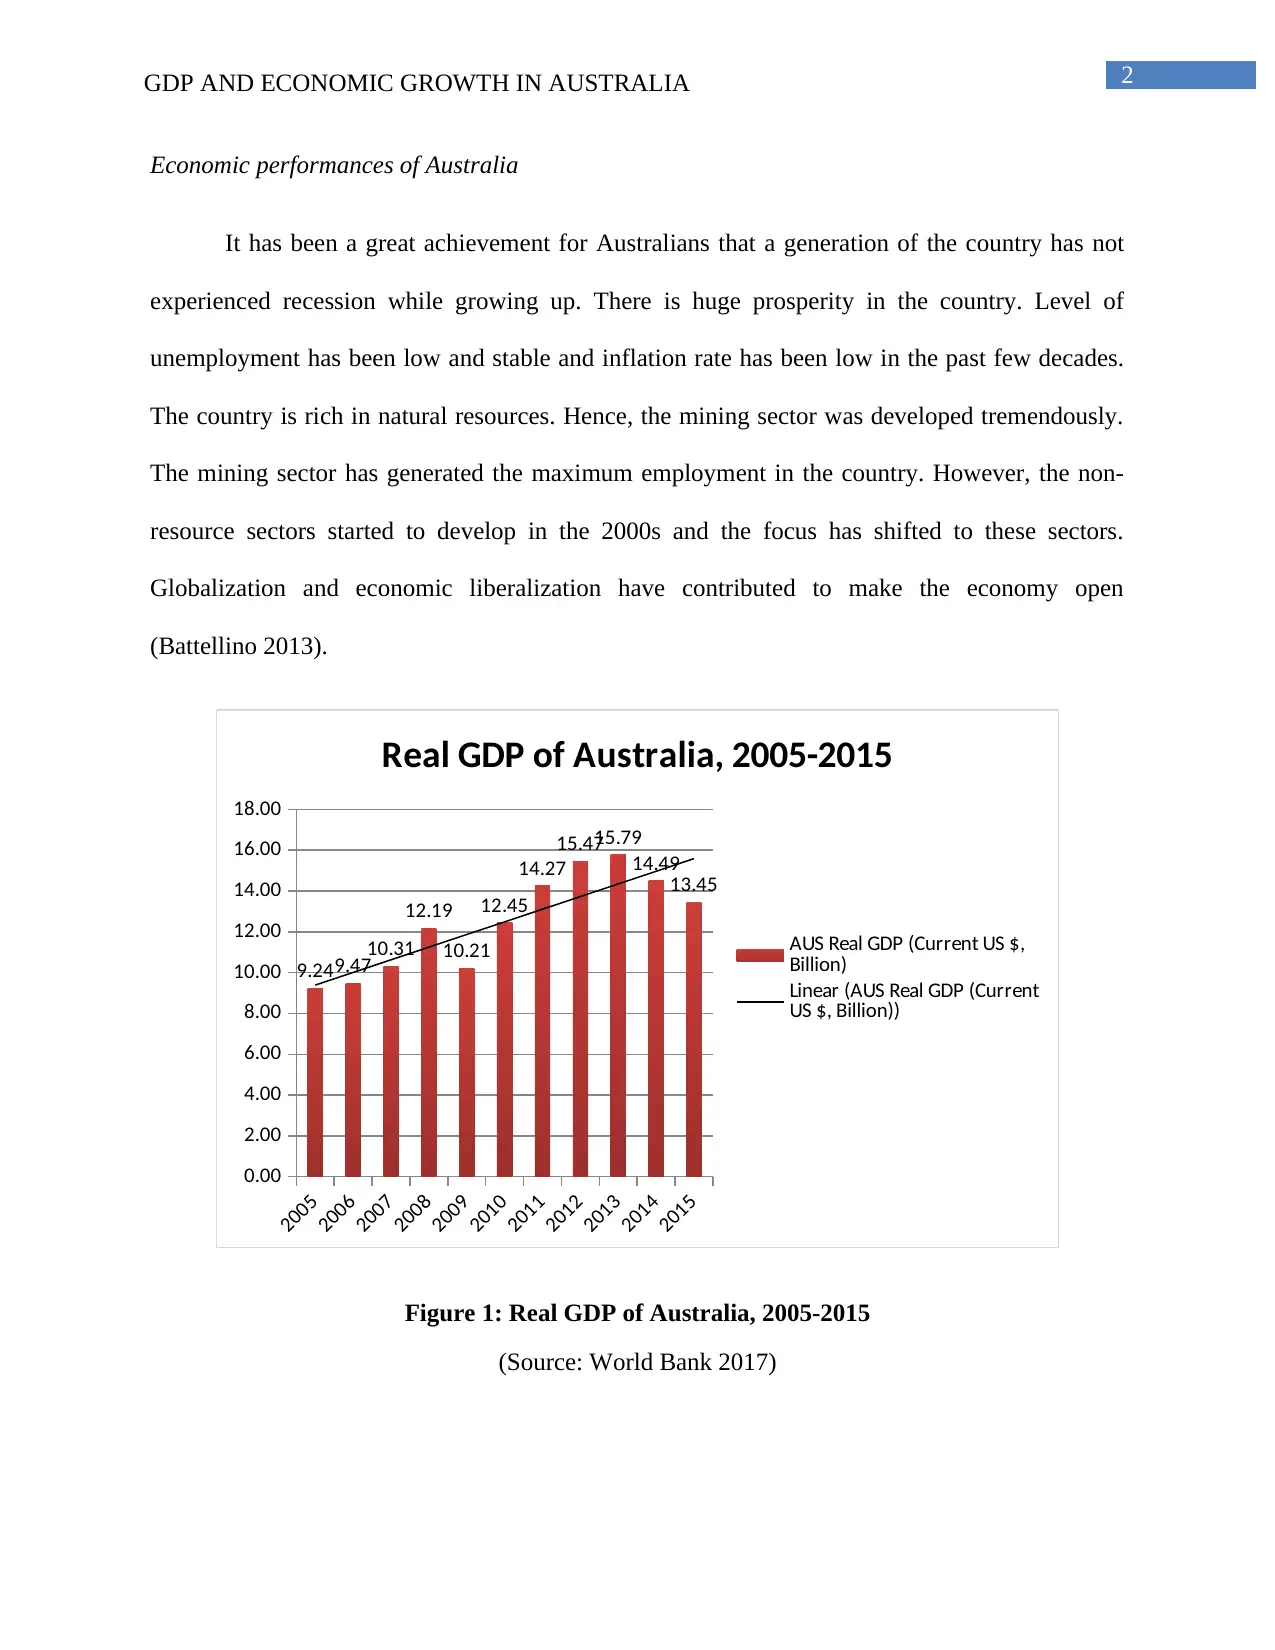
Economic performances of Australia
It has been a great achievement for Australians that a generation of the country has not
experienced recession while growing up. There is huge prosperity in the country. Level of
unemployment has been low and stable and inflation rate has been low in the past few decades.
The country is rich in natural resources. Hence, the mining sector was developed tremendously.
The mining sector has generated the maximum employment in the country. However, the non-
resource sectors started to develop in the 2000s and the focus has shifted to these sectors.
Globalization and economic liberalization have contributed to make the economy open
(Battellino 2013).
2005
2006
2007
2008
2009
2010
2011
2012
2013
2014
2015
0.00
2.00
4.00
6.00
8.00
10.00
12.00
14.00
16.00
18.00
9.249.47
10.31
12.19
10.21
12.45
14.27
15.4715.79
14.49
13.45
Real GDP of Australia, 2005-2015
AUS Real GDP (Current US $,
Billion)
Linear (AUS Real GDP (Current
US $, Billion))
Figure 1: Real GDP of Australia, 2005-2015
(Source: World Bank 2017)
⊘ This is a preview!⊘
Do you want full access?
Subscribe today to unlock all pages.
Trusted by 1+ million students worldwide
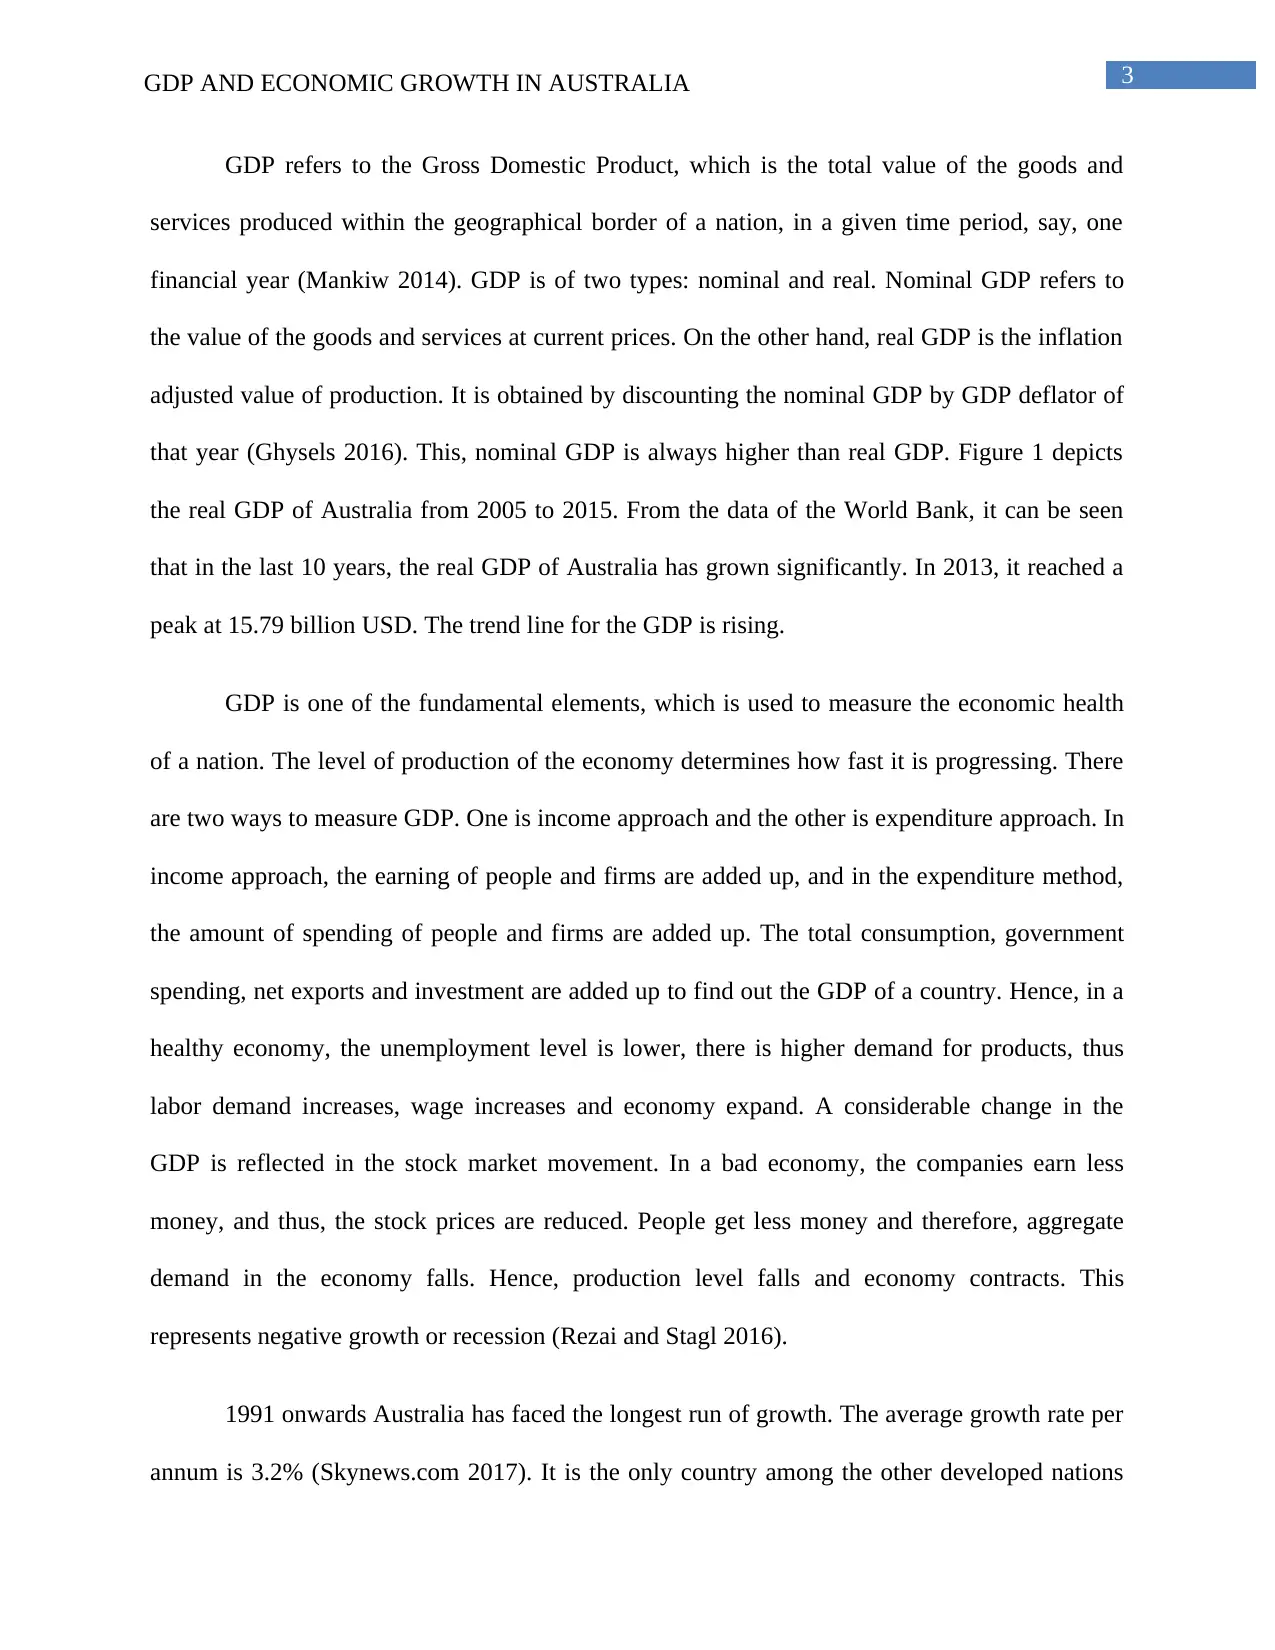
3GDP AND ECONOMIC GROWTH IN AUSTRALIA
GDP refers to the Gross Domestic Product, which is the total value of the goods and
services produced within the geographical border of a nation, in a given time period, say, one
financial year (Mankiw 2014). GDP is of two types: nominal and real. Nominal GDP refers to
the value of the goods and services at current prices. On the other hand, real GDP is the inflation
adjusted value of production. It is obtained by discounting the nominal GDP by GDP deflator of
that year (Ghysels 2016). This, nominal GDP is always higher than real GDP. Figure 1 depicts
the real GDP of Australia from 2005 to 2015. From the data of the World Bank, it can be seen
that in the last 10 years, the real GDP of Australia has grown significantly. In 2013, it reached a
peak at 15.79 billion USD. The trend line for the GDP is rising.
GDP is one of the fundamental elements, which is used to measure the economic health
of a nation. The level of production of the economy determines how fast it is progressing. There
are two ways to measure GDP. One is income approach and the other is expenditure approach. In
income approach, the earning of people and firms are added up, and in the expenditure method,
the amount of spending of people and firms are added up. The total consumption, government
spending, net exports and investment are added up to find out the GDP of a country. Hence, in a
healthy economy, the unemployment level is lower, there is higher demand for products, thus
labor demand increases, wage increases and economy expand. A considerable change in the
GDP is reflected in the stock market movement. In a bad economy, the companies earn less
money, and thus, the stock prices are reduced. People get less money and therefore, aggregate
demand in the economy falls. Hence, production level falls and economy contracts. This
represents negative growth or recession (Rezai and Stagl 2016).
1991 onwards Australia has faced the longest run of growth. The average growth rate per
annum is 3.2% (Skynews.com 2017). It is the only country among the other developed nations
Paraphrase This Document
Need a fresh take? Get an instant paraphrase of this document with our AI Paraphraser
4GDP AND ECONOMIC GROWTH IN AUSTRALIA
which has seen the growth for such a long time. Recession is defined by the concept of two
successive quarters having negative economic growth. Australia has never faced two consecutive
quarters of negative growth since 1991 and hence, the longest run of economic growth has been
achieved by the country. The Global Financial Crisis of 2008 was a major event that shook the
international economy during this last 10 years. All the major countries were hit hard but not
Australia (Adema, Fron and Ladaique 2014).
The impressive performance of Australia in the last two and half decades is majorly
credited to a variety of elements, such as, economical reforms, strong population growth due to
migration and strategic geographical region. According to a report of RBA, parts of the growth
can be attributed to the growth of the population. Along with that, the emergence of China is
another reason. In the last five years, the main export market, Japan and many other Asian
trading partner countries experienced subdued growth; hence the export sector of Australia
captured a new emerging market of China (Battellino 2013). In the past 20 years, the Australian
economy demonstrated a greater degree of flexibility. Hence, the resiliency has been increased,
which has enabled the economy to handle all the external shocks, for example, the break down of
the dot.com bubble, Asian crisis and the global financial crisis following the collapse of US
subprime credit bubble etc. (Bagshaw and Massola 2017).
One of the major key elements of flexibility is the floating exchange rate of the country.
To respond to the various external shocks, the currency has risen and fallen, otherwise the events
could have destabilized the domestic economy. During the Asian and Dot-com bubble, the
Australian dollar depreciated quite sharply to respond to the deteriorating condition of the
international economy. This had helped to insulate the domestic economy (Stiglitz and Guzman
2016). Even during the 2008 financial crisis, the Australian dollar rose sharply along with the
5GDP AND ECONOMIC GROWTH IN AUSTRALIA
commodity prices. It helped in dissipation of pressures, which could otherwise cause the
economy to overheat. The temporary sharp fall in the exchange rate helped the economy to
remain stable during the financial crisis (Rahman, Shahbaz and Farooq 2015). Other factors
include many economic reforms in industrial policies, which made the business sector more open
and competitive. Due to labor market reforms, the market had increased flexibility, which could
adjust to the changing economic conditions without resulting large level of unemployment or
unsustainable wages. Financial sector reforms have brought more capacity for meeting the
financial needs of the country and have made the country more attractive to the foreign investors
(Janda and Letts 2017).
Hence, investment from domestic as well as foreign investors increased substantially.
This has contributed significantly in raising the GDP level of the country. Level of demand in the
economy increased as people had more money. Employment level increased, production
increased and hence, GDP also increased. The government budget was highly improved too.
Level of government debt decreased and Australia became one of the best positioned countries in
the government finances. Through stable monetary policies the Australian government kept the
inflation level low and made the economy stable. The economy is growing at the rate of 2% to
2.5% per year, which is however lower than the growth rate in the past (Glynn and Rogers 2017).
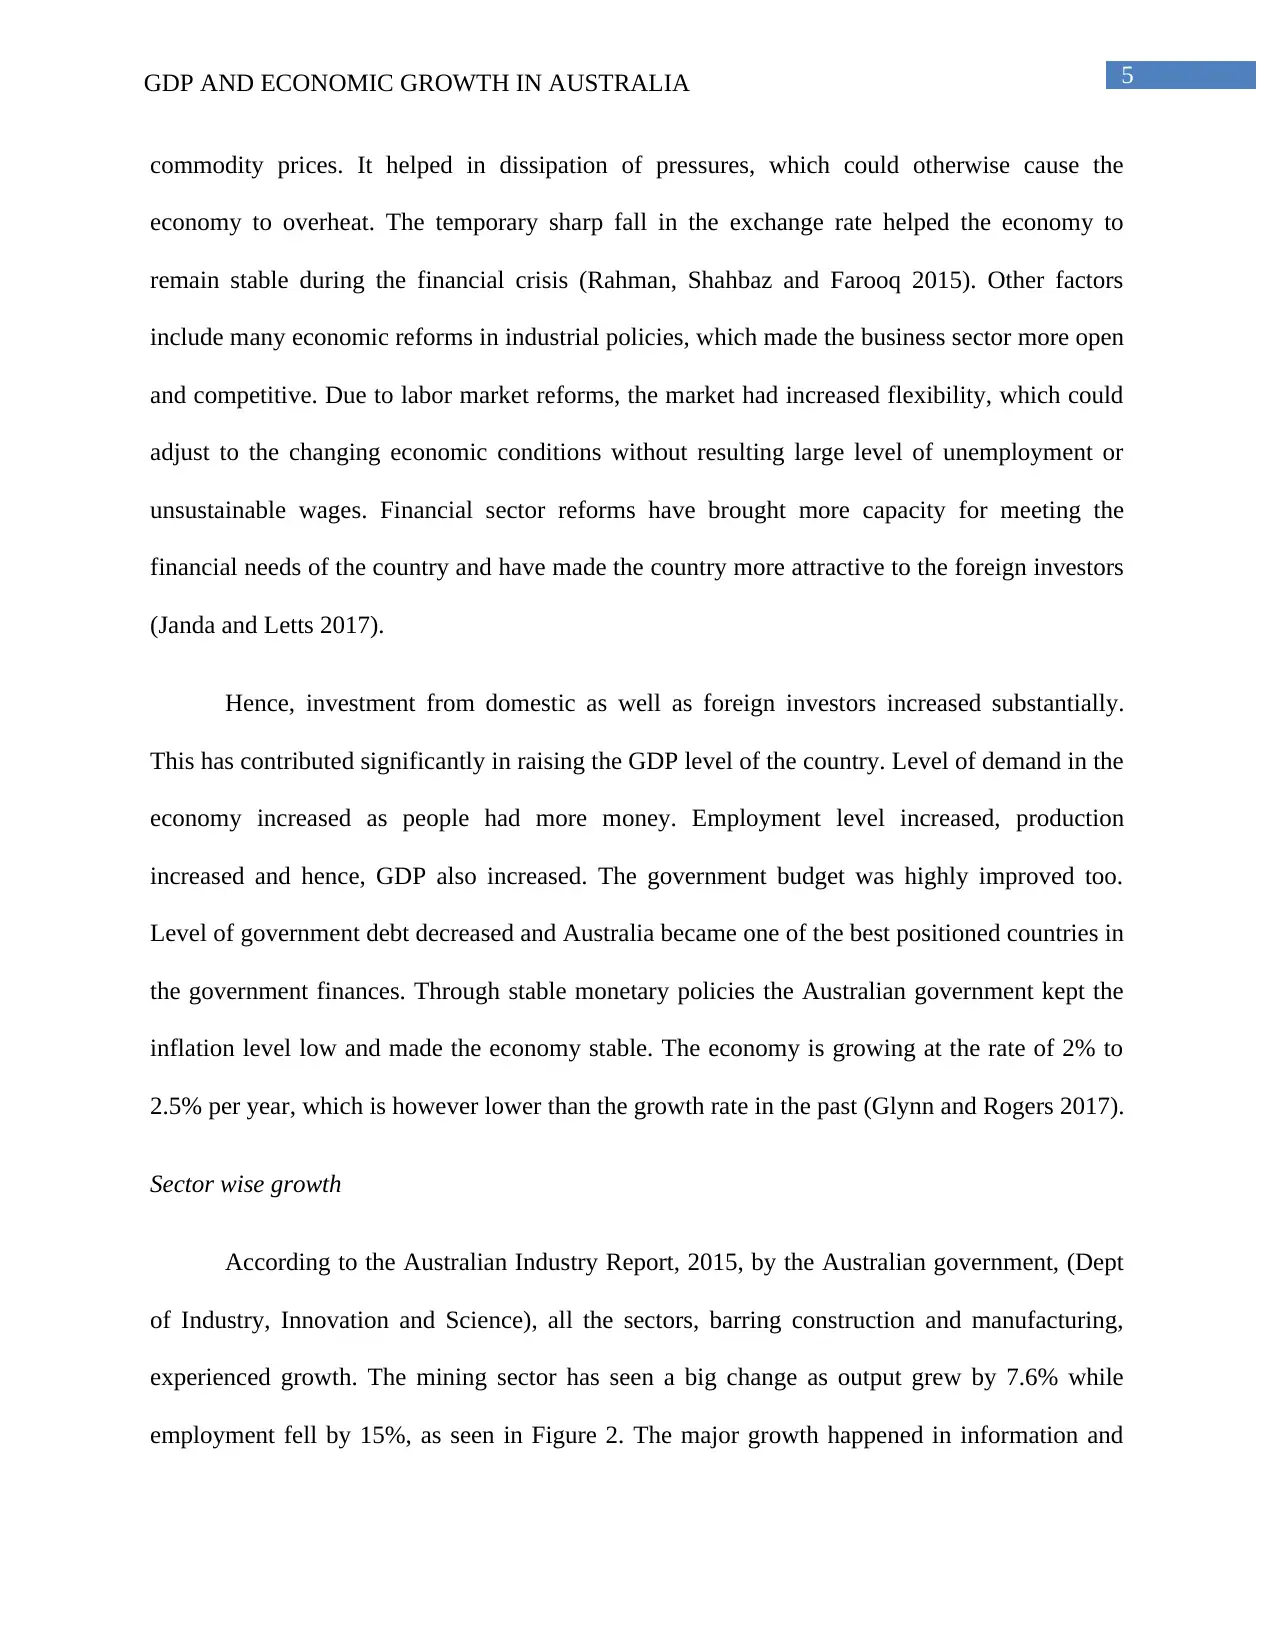
Sector wise growth
According to the Australian Industry Report, 2015, by the Australian government, (Dept
of Industry, Innovation and Science), all the sectors, barring construction and manufacturing,
experienced growth. The mining sector has seen a big change as output grew by 7.6% while
employment fell by 15%, as seen in Figure 2. The major growth happened in information and
commodity prices. It helped in dissipation of pressures, which could otherwise cause the
economy to overheat. The temporary sharp fall in the exchange rate helped the economy to
remain stable during the financial crisis (Rahman, Shahbaz and Farooq 2015). Other factors
include many economic reforms in industrial policies, which made the business sector more open
and competitive. Due to labor market reforms, the market had increased flexibility, which could
adjust to the changing economic conditions without resulting large level of unemployment or
unsustainable wages. Financial sector reforms have brought more capacity for meeting the
financial needs of the country and have made the country more attractive to the foreign investors
(Janda and Letts 2017).
Hence, investment from domestic as well as foreign investors increased substantially.
This has contributed significantly in raising the GDP level of the country. Level of demand in the
economy increased as people had more money. Employment level increased, production
increased and hence, GDP also increased. The government budget was highly improved too.
Level of government debt decreased and Australia became one of the best positioned countries in
the government finances. Through stable monetary policies the Australian government kept the
inflation level low and made the economy stable. The economy is growing at the rate of 2% to
2.5% per year, which is however lower than the growth rate in the past (Glynn and Rogers 2017).
Sector wise growth
According to the Australian Industry Report, 2015, by the Australian government, (Dept
of Industry, Innovation and Science), all the sectors, barring construction and manufacturing,
experienced growth. The mining sector has seen a big change as output grew by 7.6% while
employment fell by 15%, as seen in Figure 2. The major growth happened in information and
⊘ This is a preview!⊘
Do you want full access?
Subscribe today to unlock all pages.
Trusted by 1+ million students worldwide
6GDP AND ECONOMIC GROWTH IN AUSTRALIA
media, accommodation and food services, tourism, financial and insurance and health care and
social assistance sector, within the service industry. Even if the international economy is
expanding with a very low oil price and low interest rate, the global growth is uneven. Fall in the
Australian dollar during 2012-2013 has helped the domestic industries to raise their
competitiveness in the international export market during this uneven growth (industry.gov.au,
2015).
Figure 2: Growth in the output and employment by industry, 2014-2015
(Source: industry.gov.au 2015)
Paraphrase This Document
Need a fresh take? Get an instant paraphrase of this document with our AI Paraphraser
7GDP AND ECONOMIC GROWTH IN AUSTRALIA
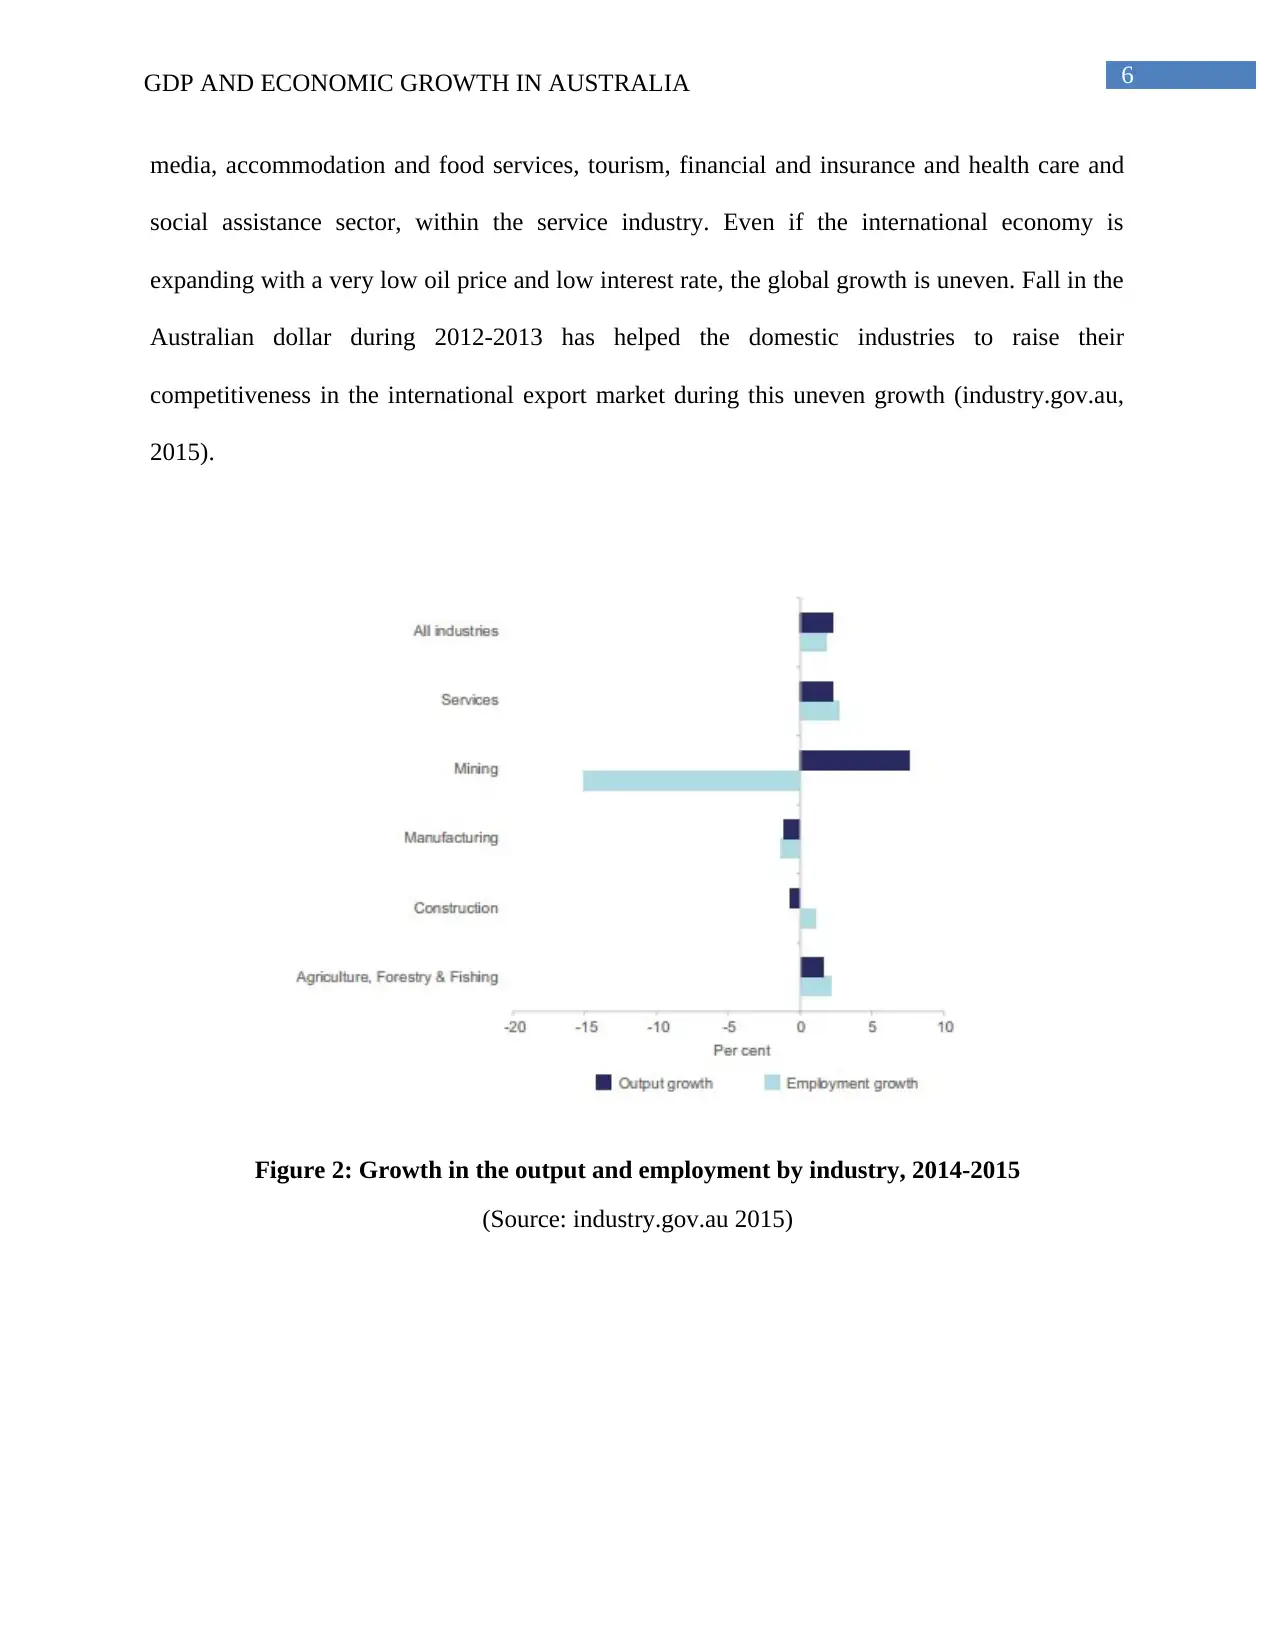
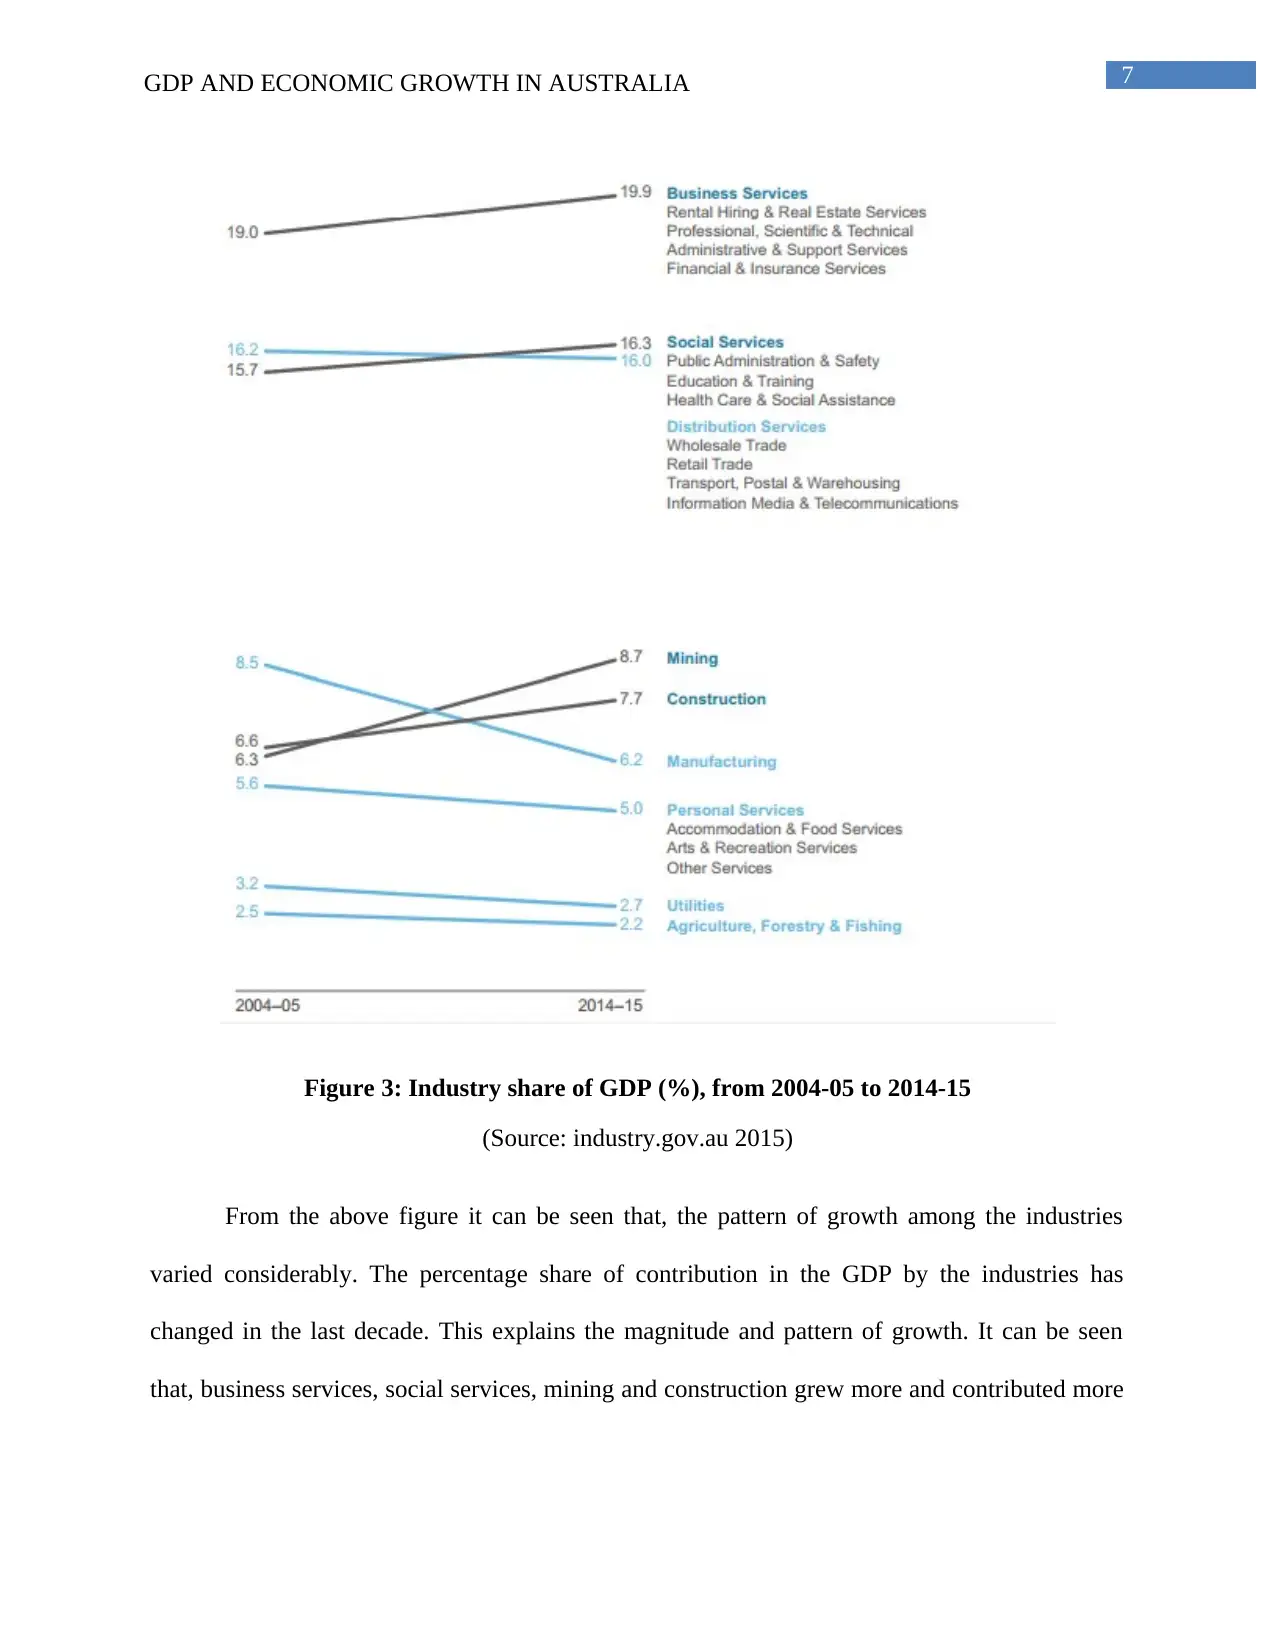
Figure 3: Industry share of GDP (%), from 2004-05 to 2014-15
(Source: industry.gov.au 2015)
From the above figure it can be seen that, the pattern of growth among the industries
varied considerably. The percentage share of contribution in the GDP by the industries has
changed in the last decade. This explains the magnitude and pattern of growth. It can be seen
that, business services, social services, mining and construction grew more and contributed more
8GDP AND ECONOMIC GROWTH IN AUSTRALIA
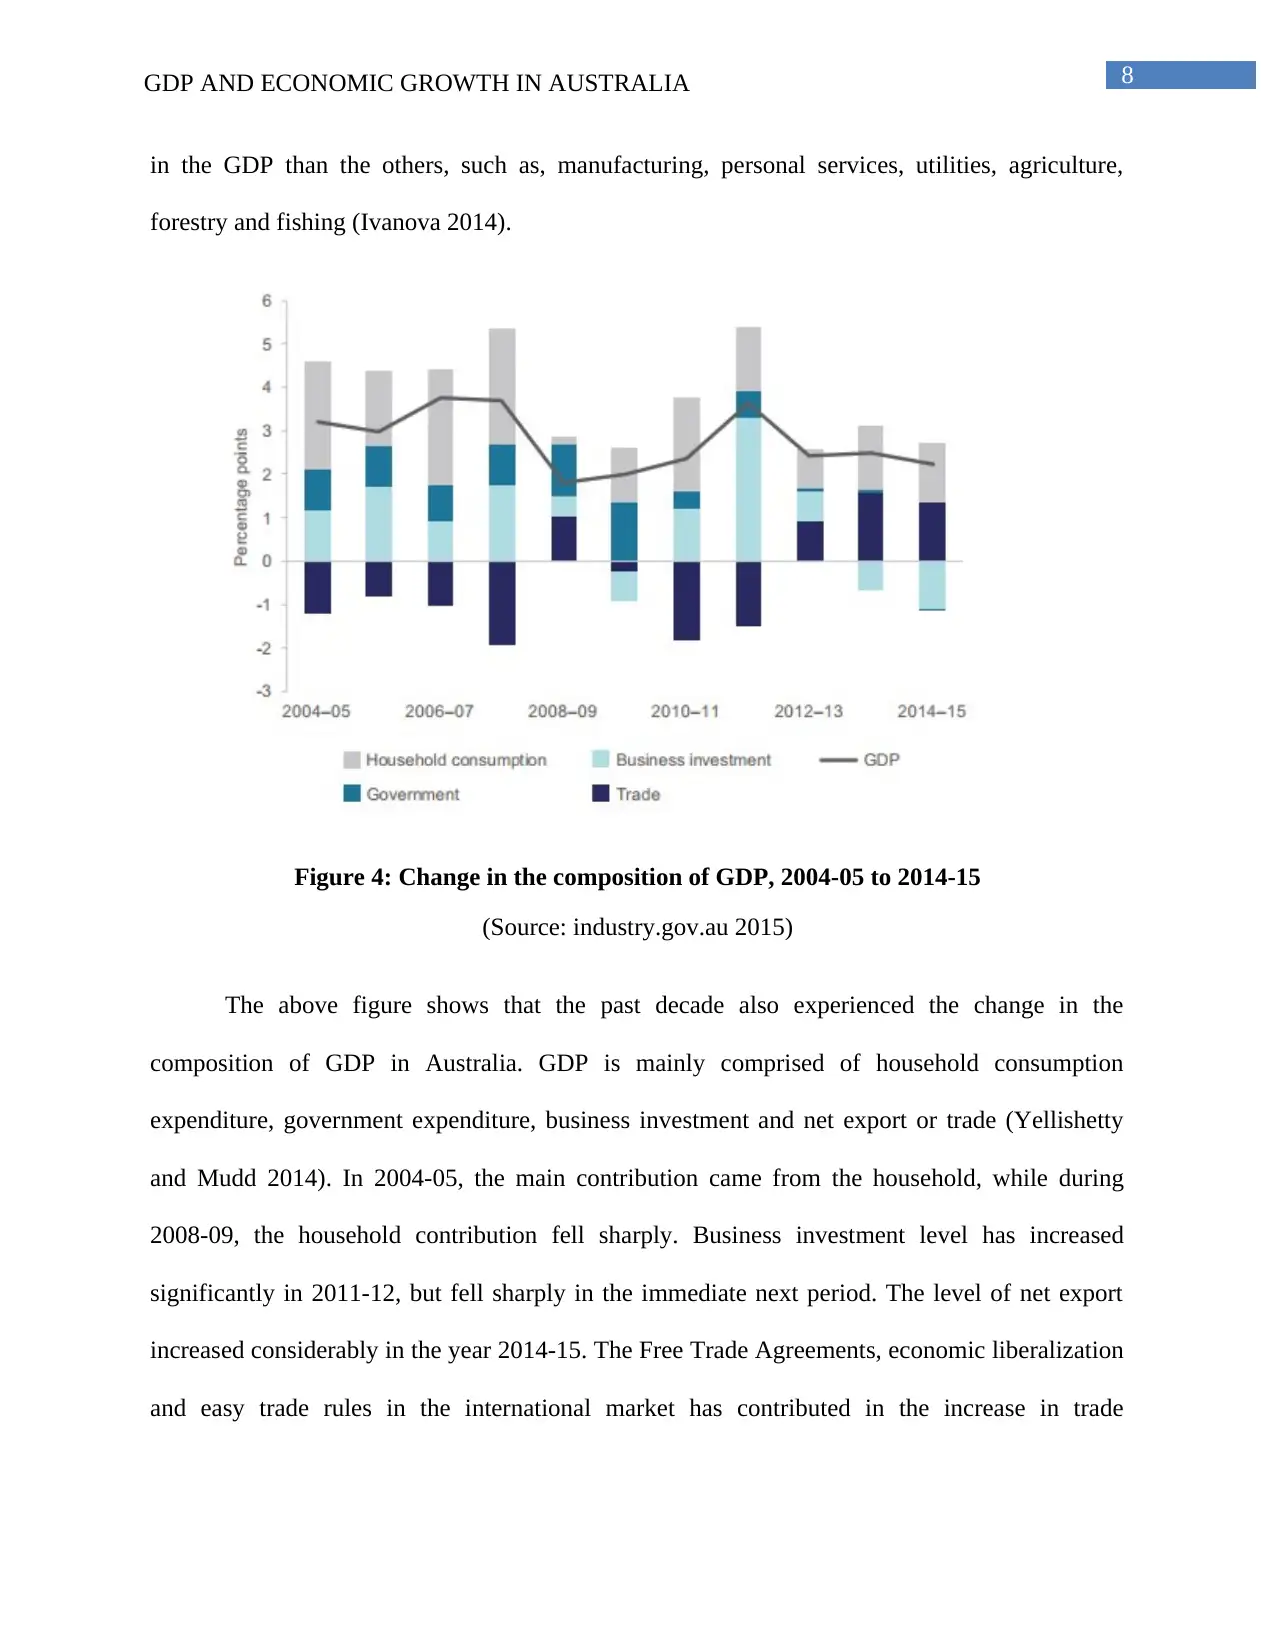
in the GDP than the others, such as, manufacturing, personal services, utilities, agriculture,
forestry and fishing (Ivanova 2014).
Figure 4: Change in the composition of GDP, 2004-05 to 2014-15
(Source: industry.gov.au 2015)
The above figure shows that the past decade also experienced the change in the
composition of GDP in Australia. GDP is mainly comprised of household consumption
expenditure, government expenditure, business investment and net export or trade (Yellishetty
and Mudd 2014). In 2004-05, the main contribution came from the household, while during
2008-09, the household contribution fell sharply. Business investment level has increased
significantly in 2011-12, but fell sharply in the immediate next period. The level of net export
increased considerably in the year 2014-15. The Free Trade Agreements, economic liberalization
and easy trade rules in the international market has contributed in the increase in trade
⊘ This is a preview!⊘
Do you want full access?
Subscribe today to unlock all pages.
Trusted by 1+ million students worldwide
9GDP AND ECONOMIC GROWTH IN AUSTRALIA
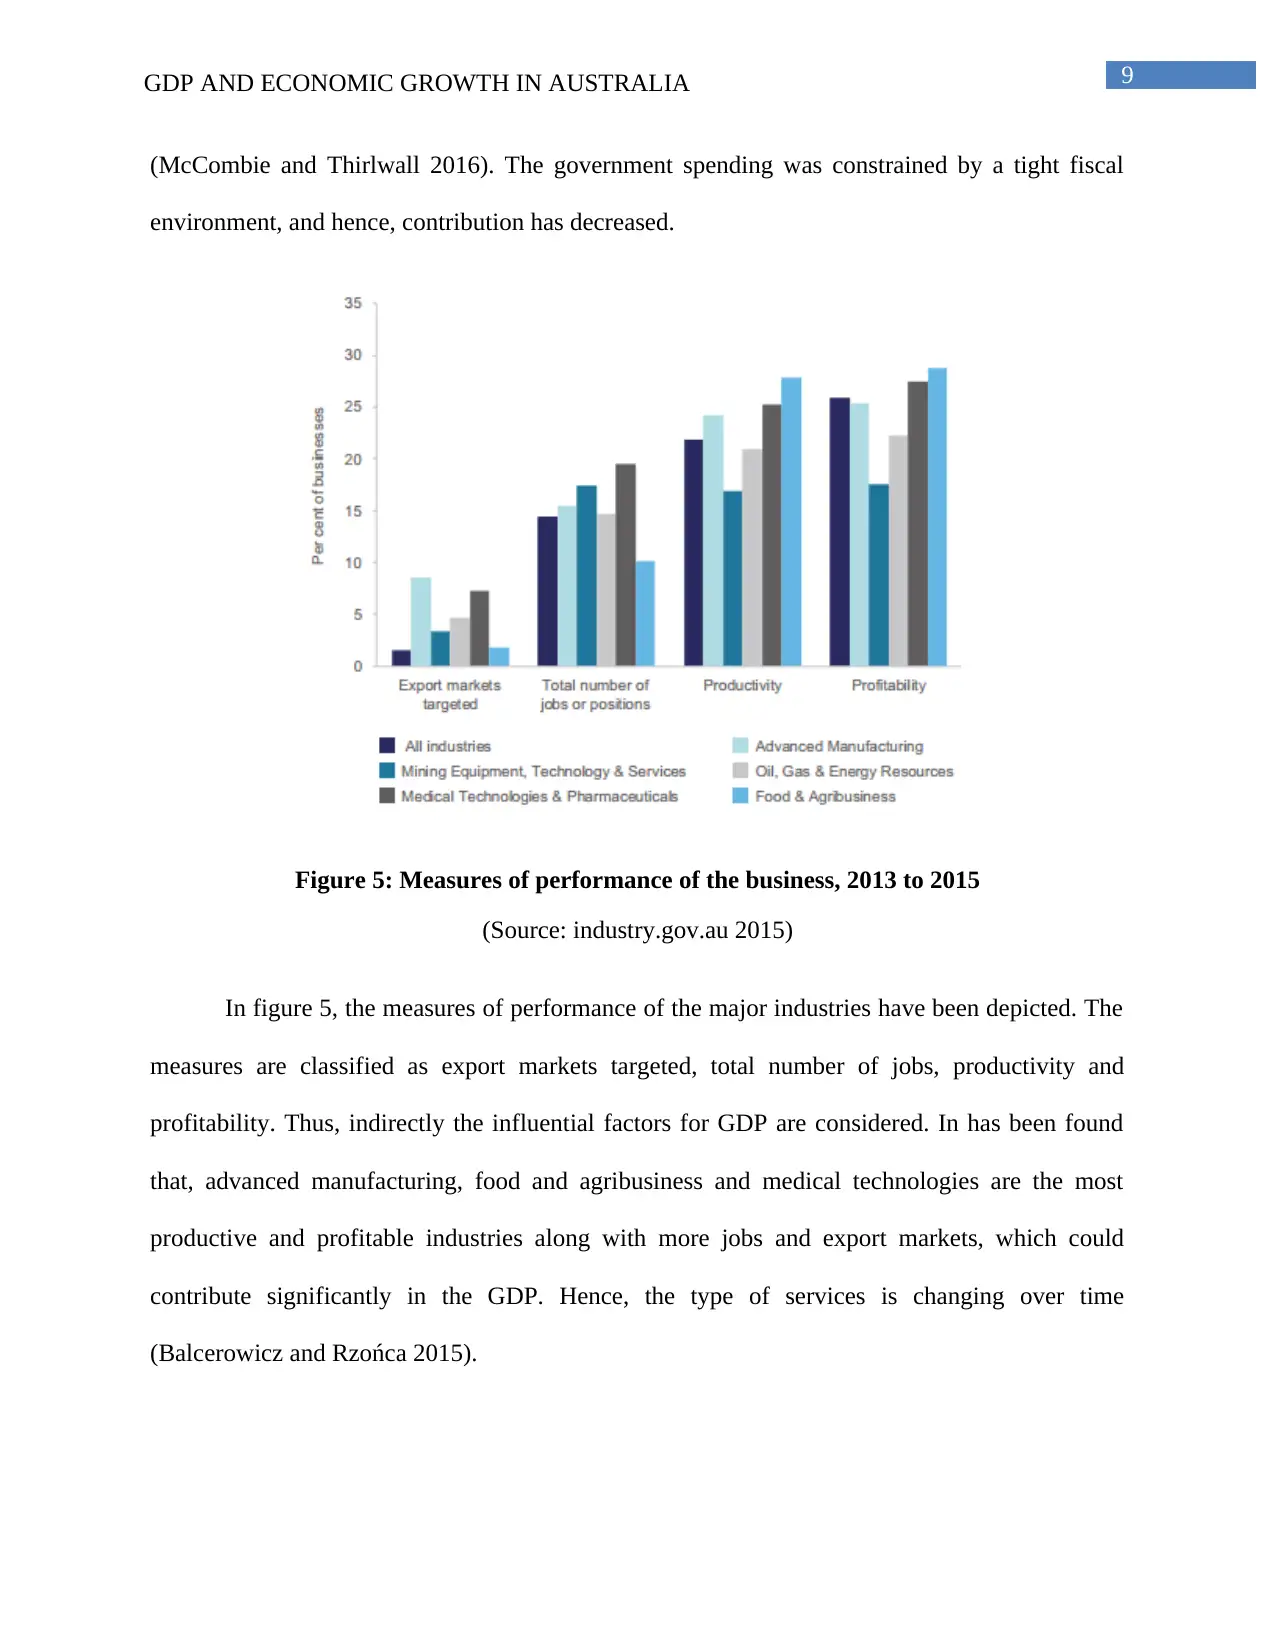
(McCombie and Thirlwall 2016). The government spending was constrained by a tight fiscal
environment, and hence, contribution has decreased.
Figure 5: Measures of performance of the business, 2013 to 2015
(Source: industry.gov.au 2015)
In figure 5, the measures of performance of the major industries have been depicted. The
measures are classified as export markets targeted, total number of jobs, productivity and
profitability. Thus, indirectly the influential factors for GDP are considered. In has been found
that, advanced manufacturing, food and agribusiness and medical technologies are the most
productive and profitable industries along with more jobs and export markets, which could
contribute significantly in the GDP. Hence, the type of services is changing over time
(Balcerowicz and Rzońca 2015).
Paraphrase This Document
Need a fresh take? Get an instant paraphrase of this document with our AI Paraphraser
10GDP AND ECONOMIC GROWTH IN AUSTRALIA
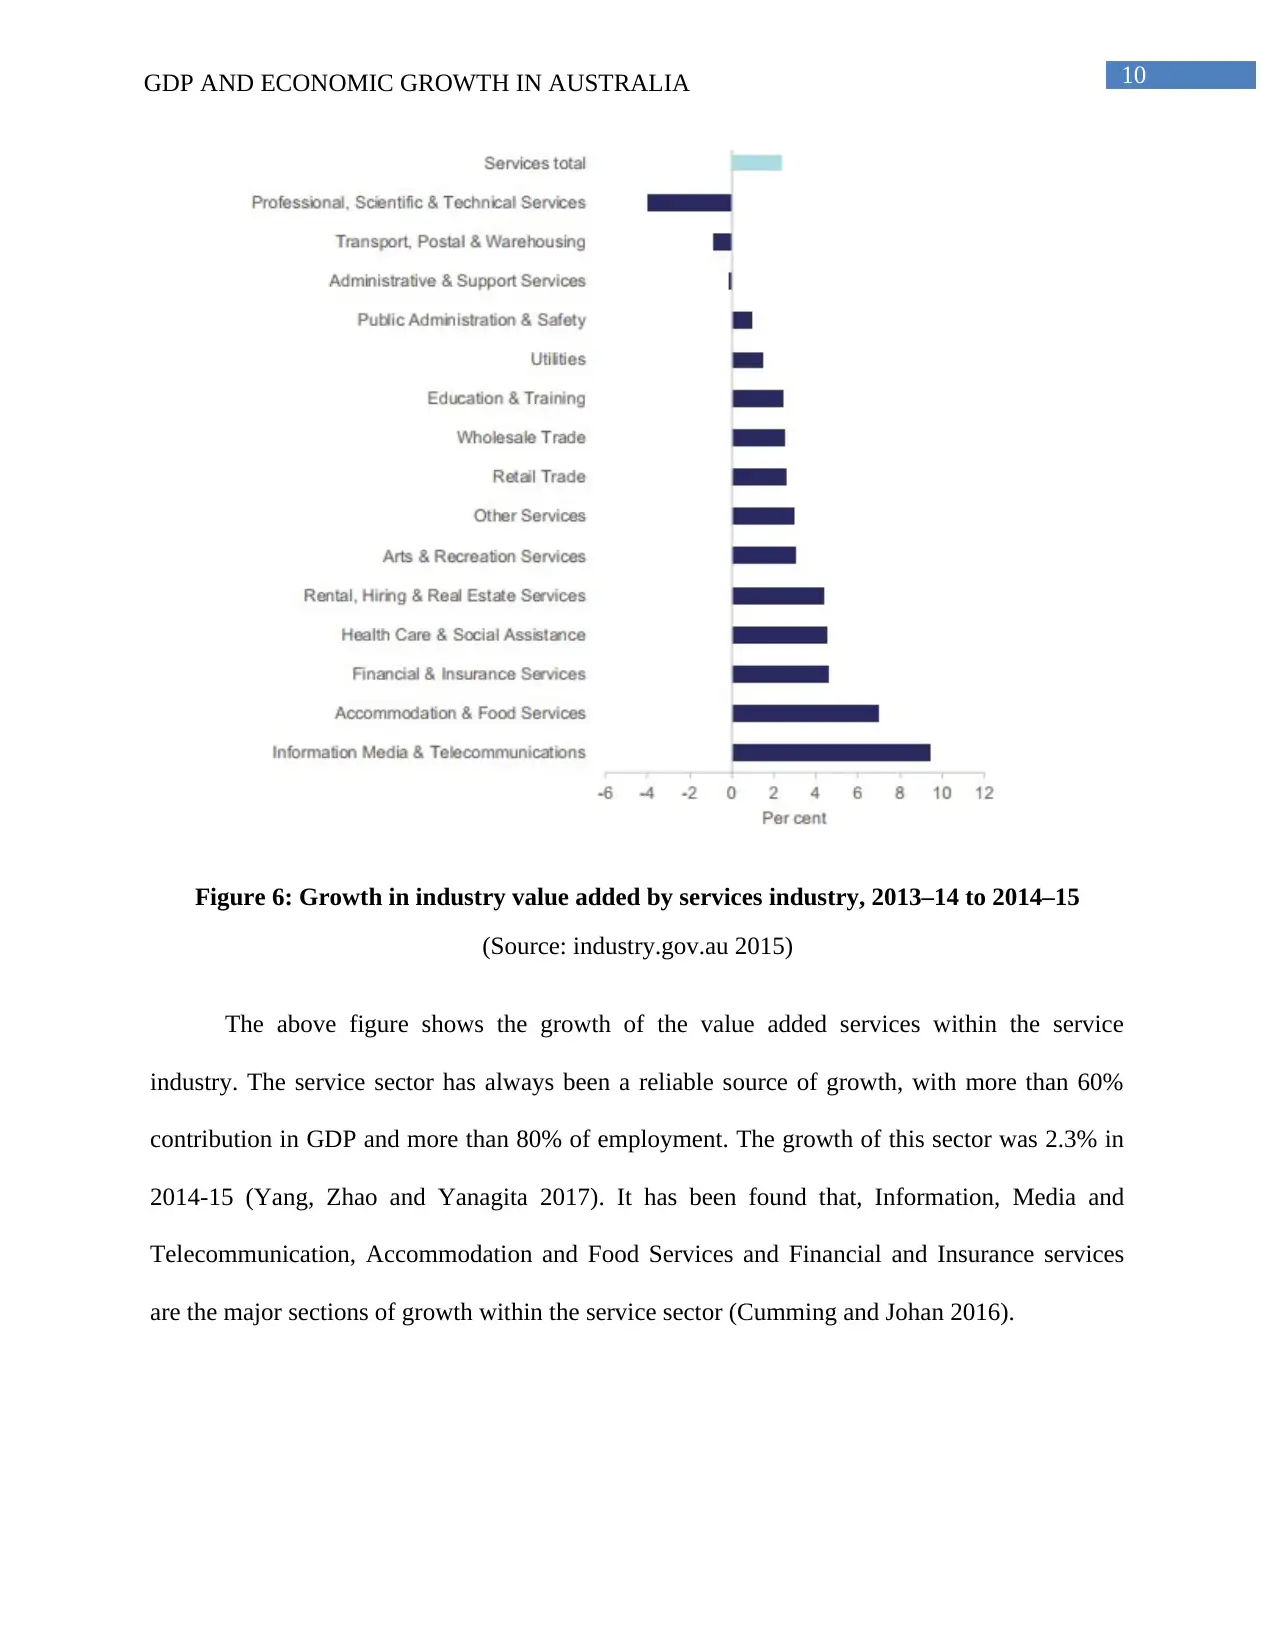
Figure 6: Growth in industry value added by services industry, 2013–14 to 2014–15
(Source: industry.gov.au 2015)
The above figure shows the growth of the value added services within the service
industry. The service sector has always been a reliable source of growth, with more than 60%
contribution in GDP and more than 80% of employment. The growth of this sector was 2.3% in
2014-15 (Yang, Zhao and Yanagita 2017). It has been found that, Information, Media and
Telecommunication, Accommodation and Food Services and Financial and Insurance services
are the major sections of growth within the service sector (Cumming and Johan 2016).
11GDP AND ECONOMIC GROWTH IN AUSTRALIA
Conclusion
Economic growth is very important for any nation, as it improves the living standard of
people and lowers the unemployment level in the economy. In the past two decades, especially in
the last 10 years, employment increased significantly. Hence, income per household has
increased too. The rise in jobs was more than the rise in population. All the sectors were
booming with jobs and opportunities. Over the past 10 years, the rate of unemployment fell to
little more than 5% from 9%. Through the growth of the industries, the benefits are spread across
the economy. For example, the growth in the gross state product in Western Australia was 4.5%
and that in Queensland was 4.8% per year, while the average growth in the other states was in
between 2.8% and 3.7%. This gap is explained by movement of population. Over time, more and
more jobs were created in almost all the sectors, and Australia was able to achieve an almost
even growth among all its states and territories. From the GDP of the nation, it can be seen that
the country has been able to gain a stable position in the international economy. With a lower
exchange rate, it made its currency cheaper in the international market. Demand for exports
increased, which improved the domestic industry. As more jobs are created, people have more
money to spend, thus demand for products has increased in both the domestic and international
market. This led to a rise in the production of goods and services, resulting in a higher GDP as
well as economic growth for the longest period of time.
⊘ This is a preview!⊘
Do you want full access?
Subscribe today to unlock all pages.
Trusted by 1+ million students worldwide
1 out of 15
Related Documents


Your All-in-One AI-Powered Toolkit for Academic Success.
+13062052269
info@desklib.com
Available 24*7 on WhatsApp / Email
![[object Object]](/_next/static/media/star-bottom.7253800d.svg)
Unlock your academic potential
Copyright © 2020–2026 A2Z Services. All Rights Reserved. Developed and managed by ZUCOL.