Australia Economic Progress Report - Government Briefing Report

Verified

Added on  2022/09/29

|7
|789
|22
Report
AI Summary
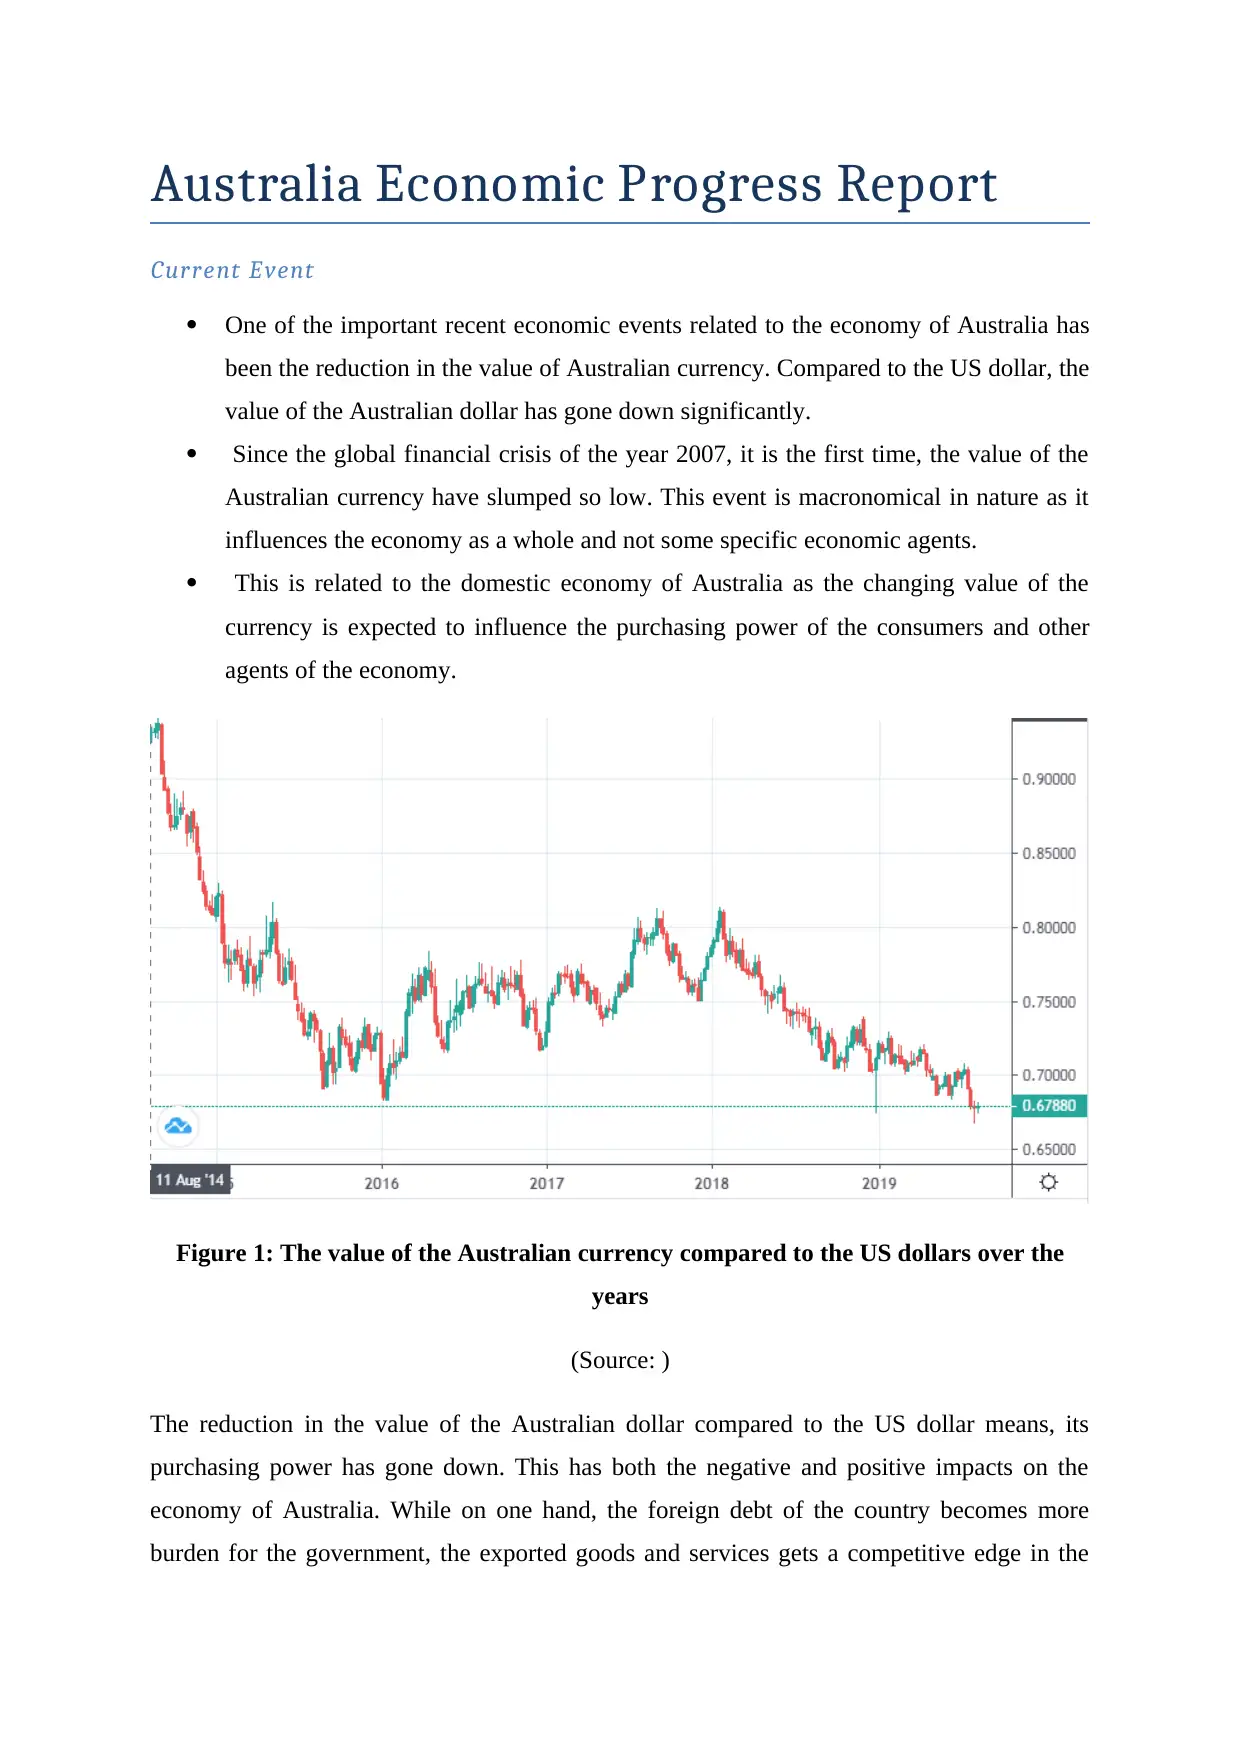
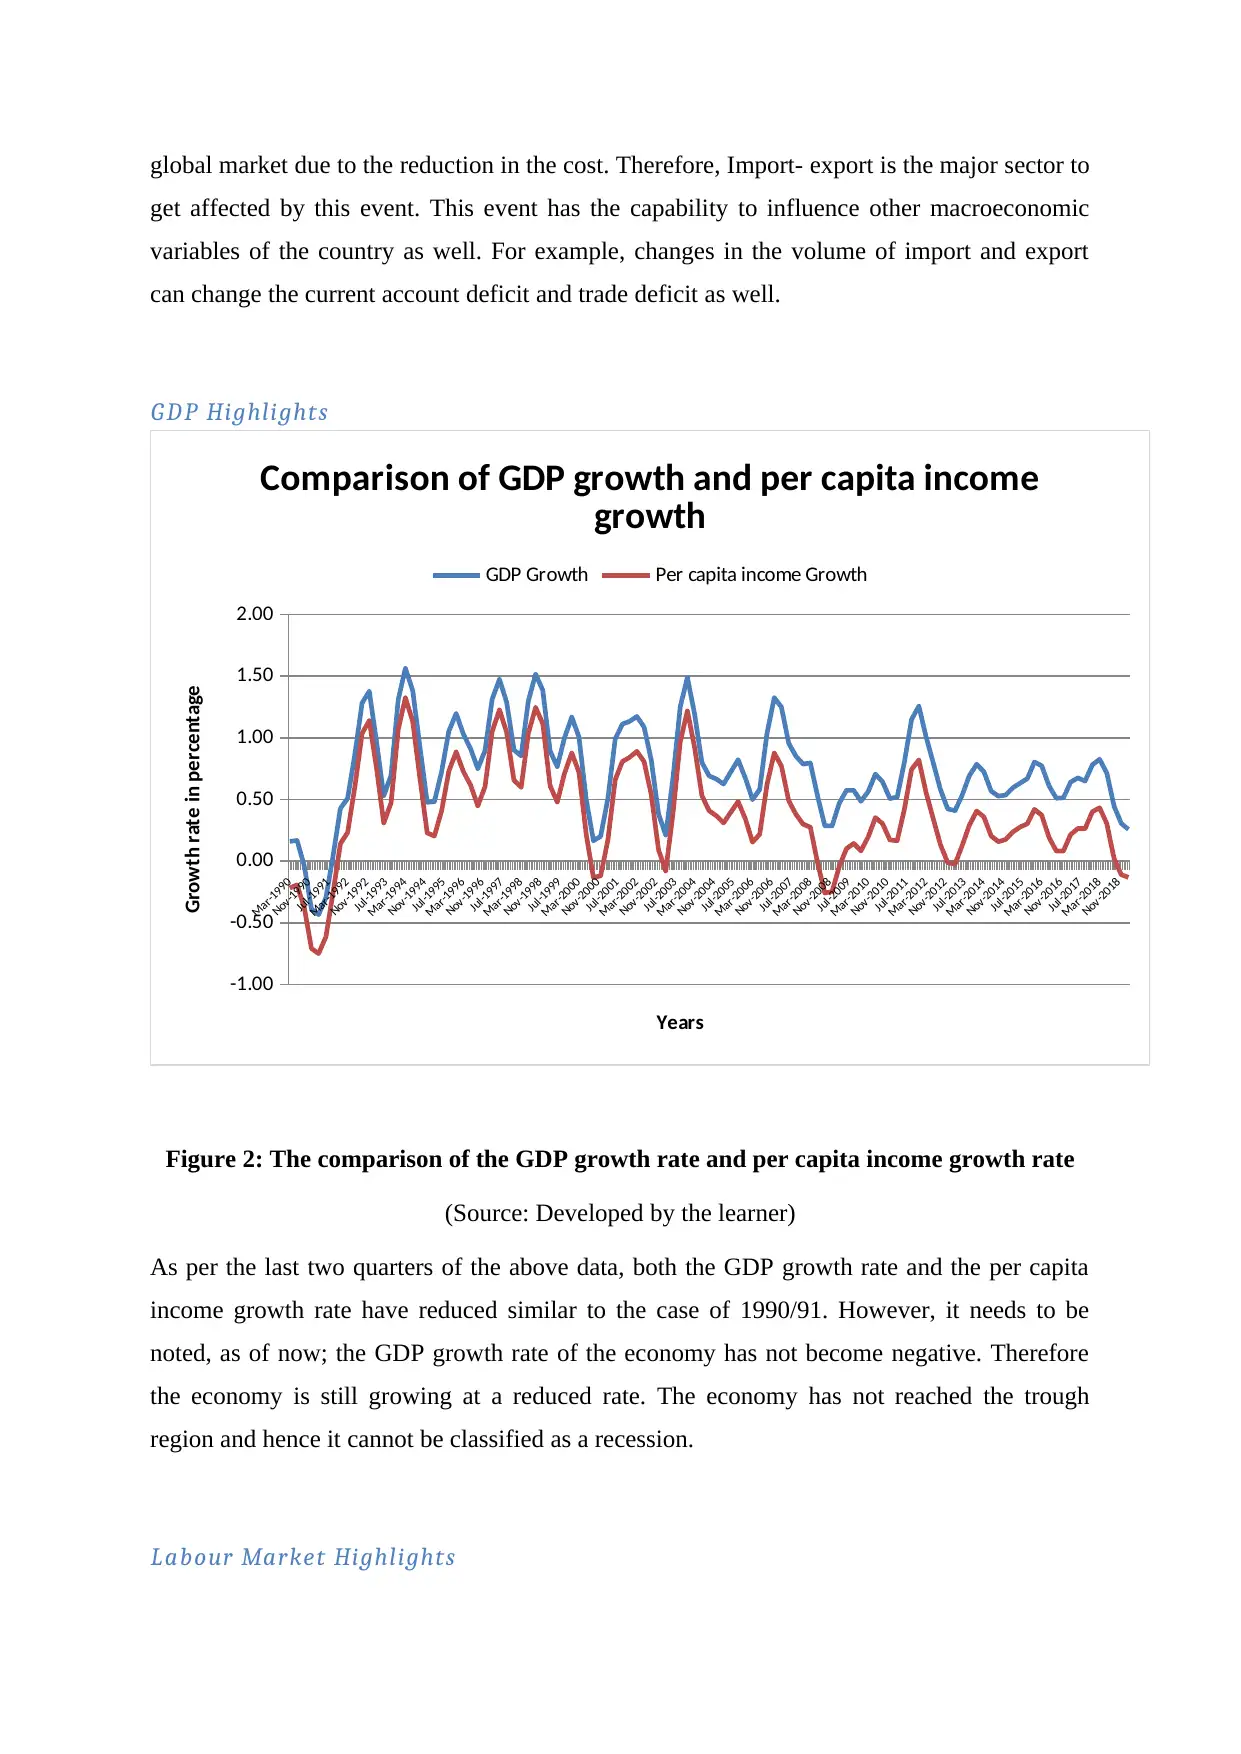
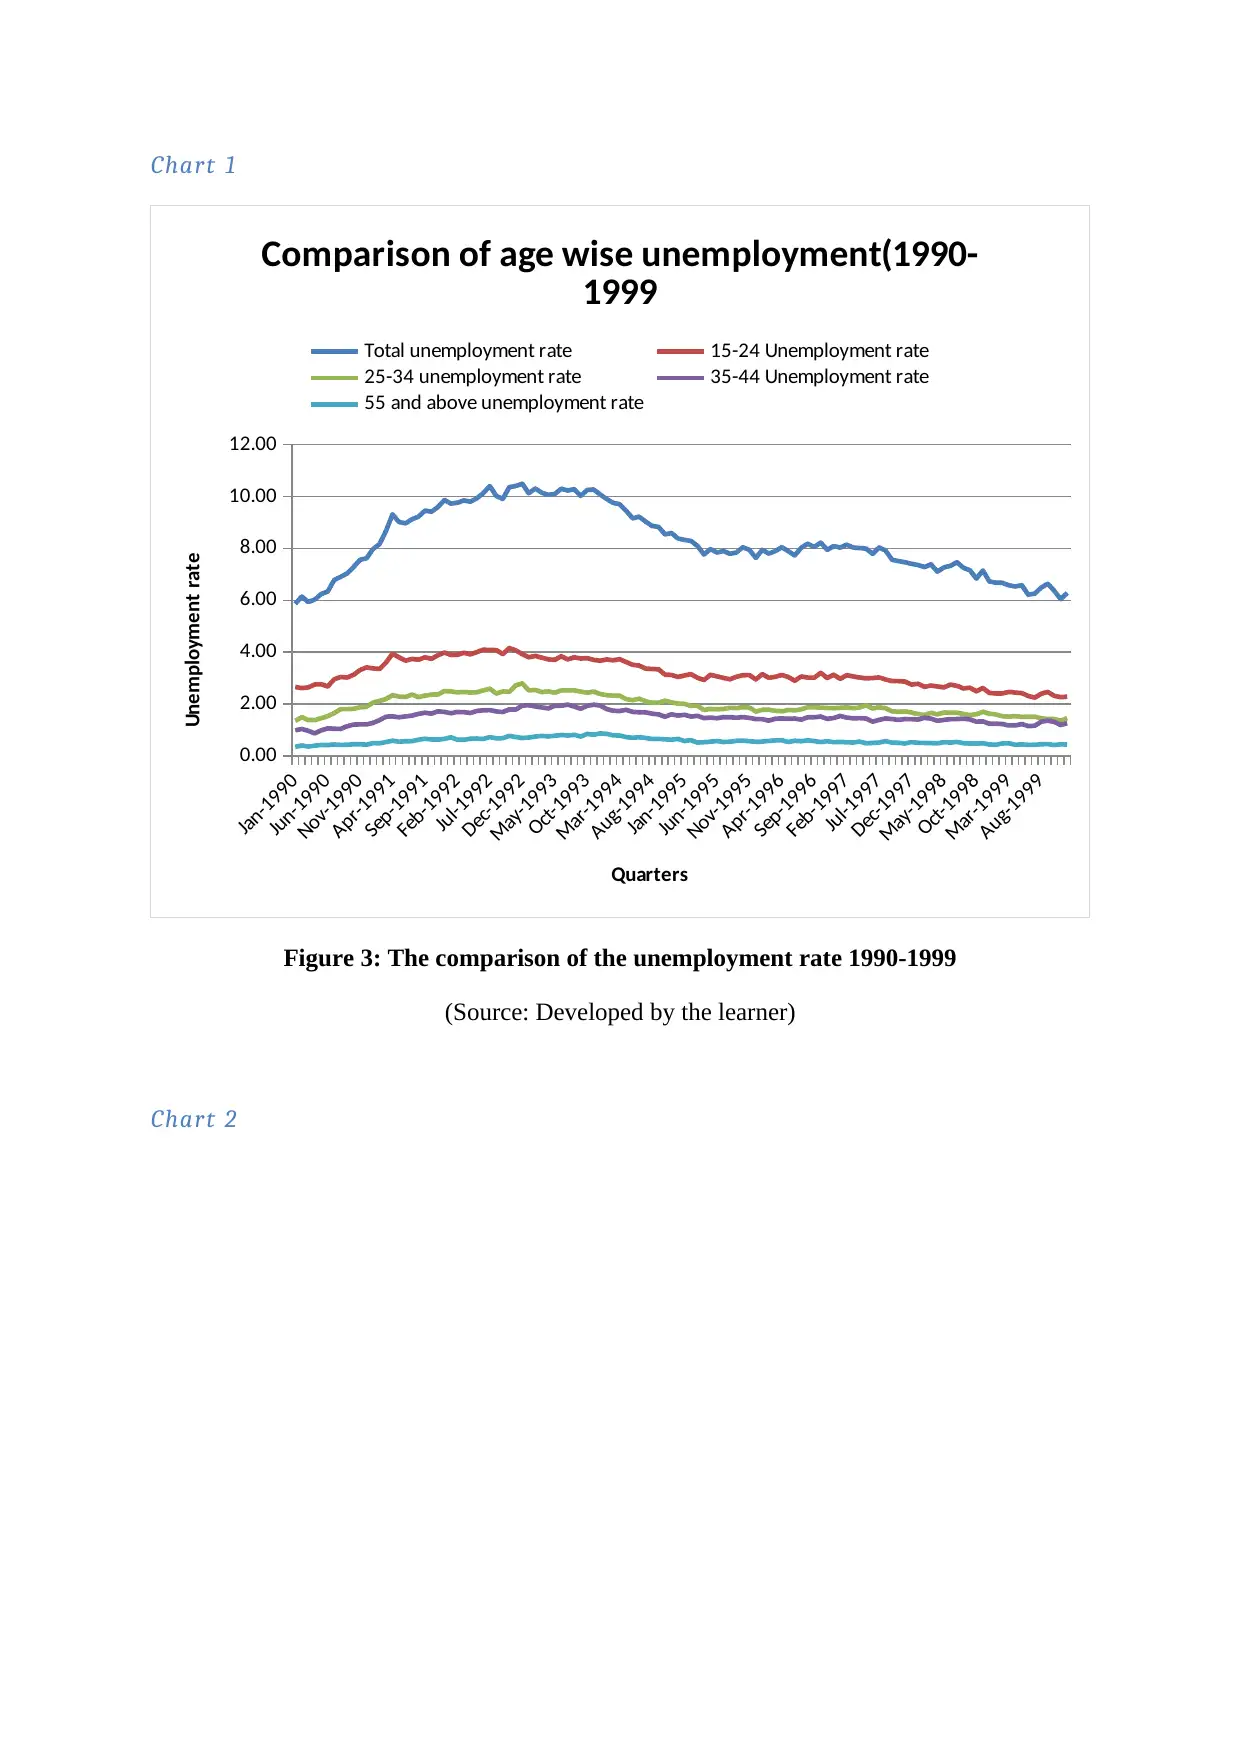
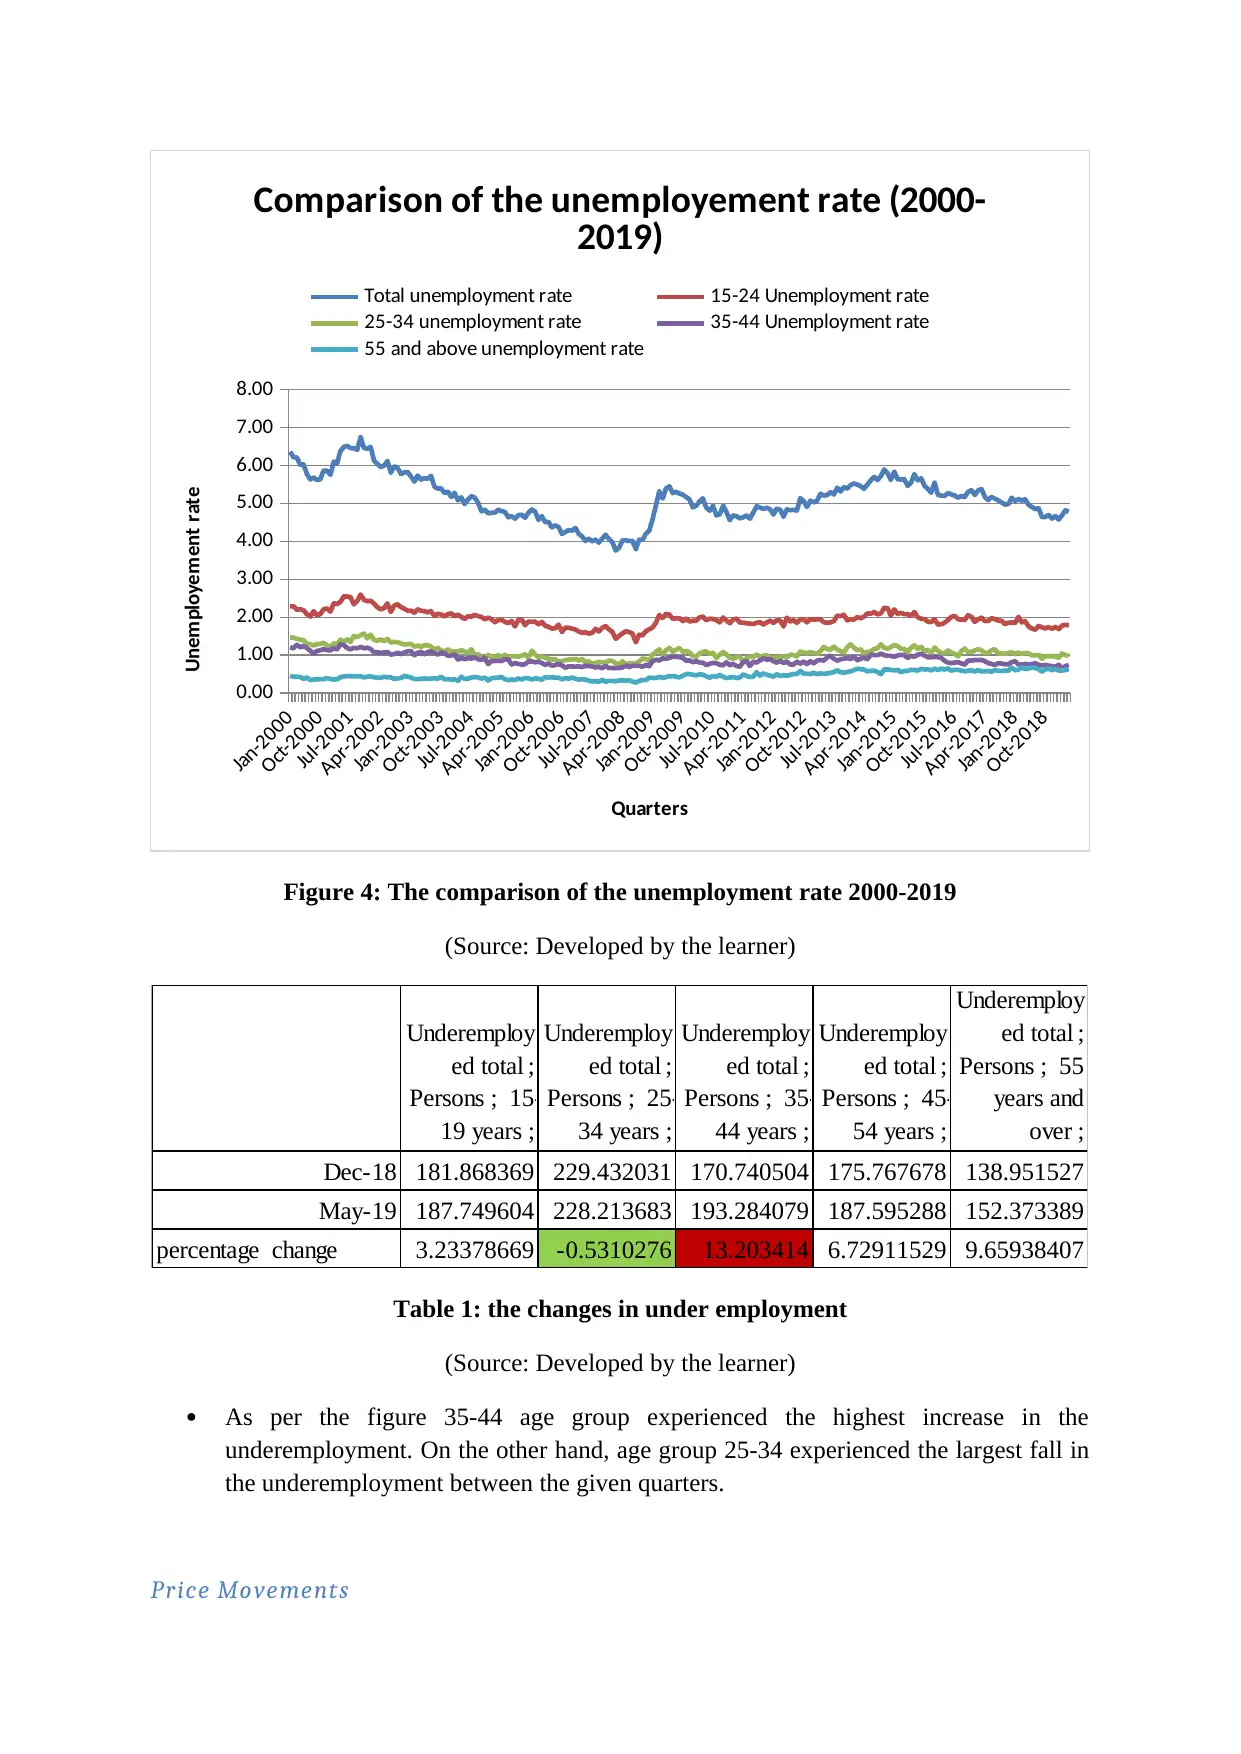
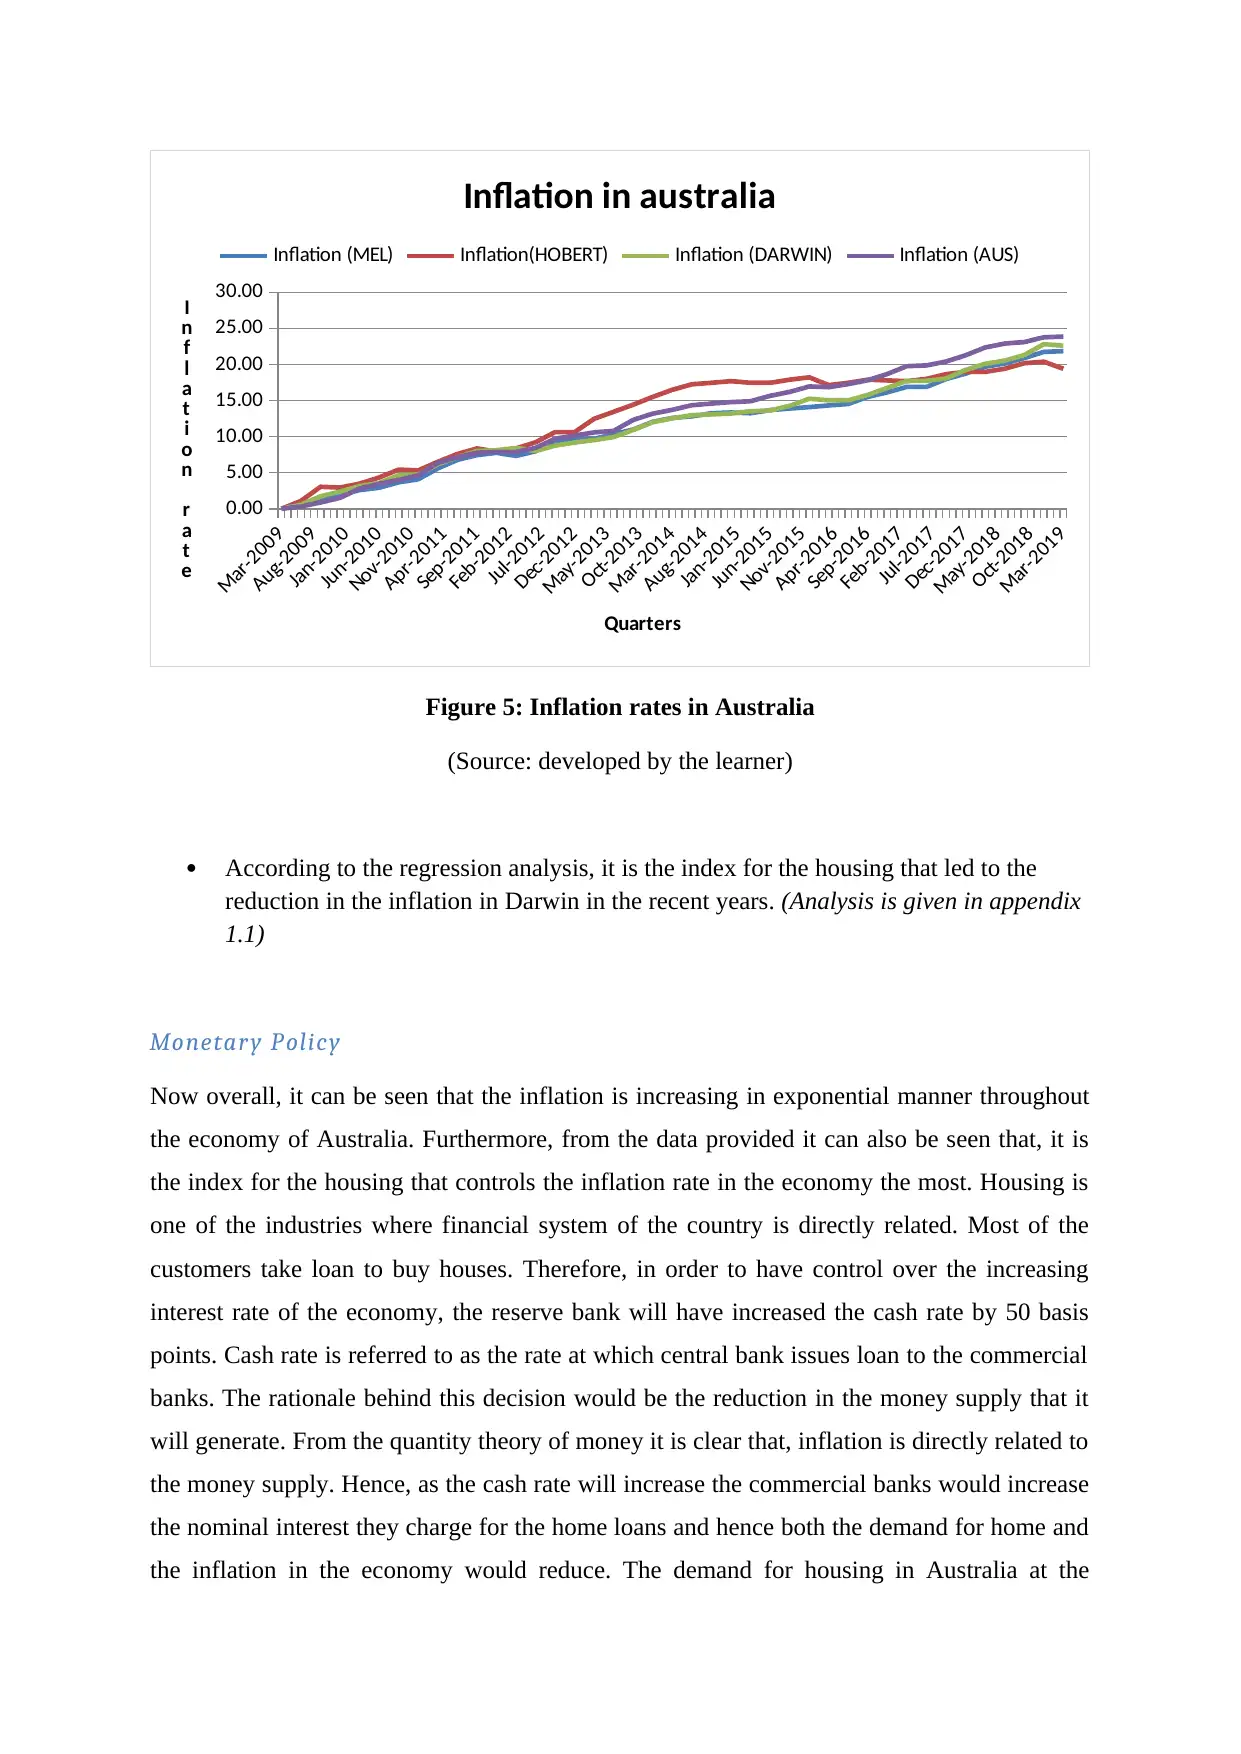
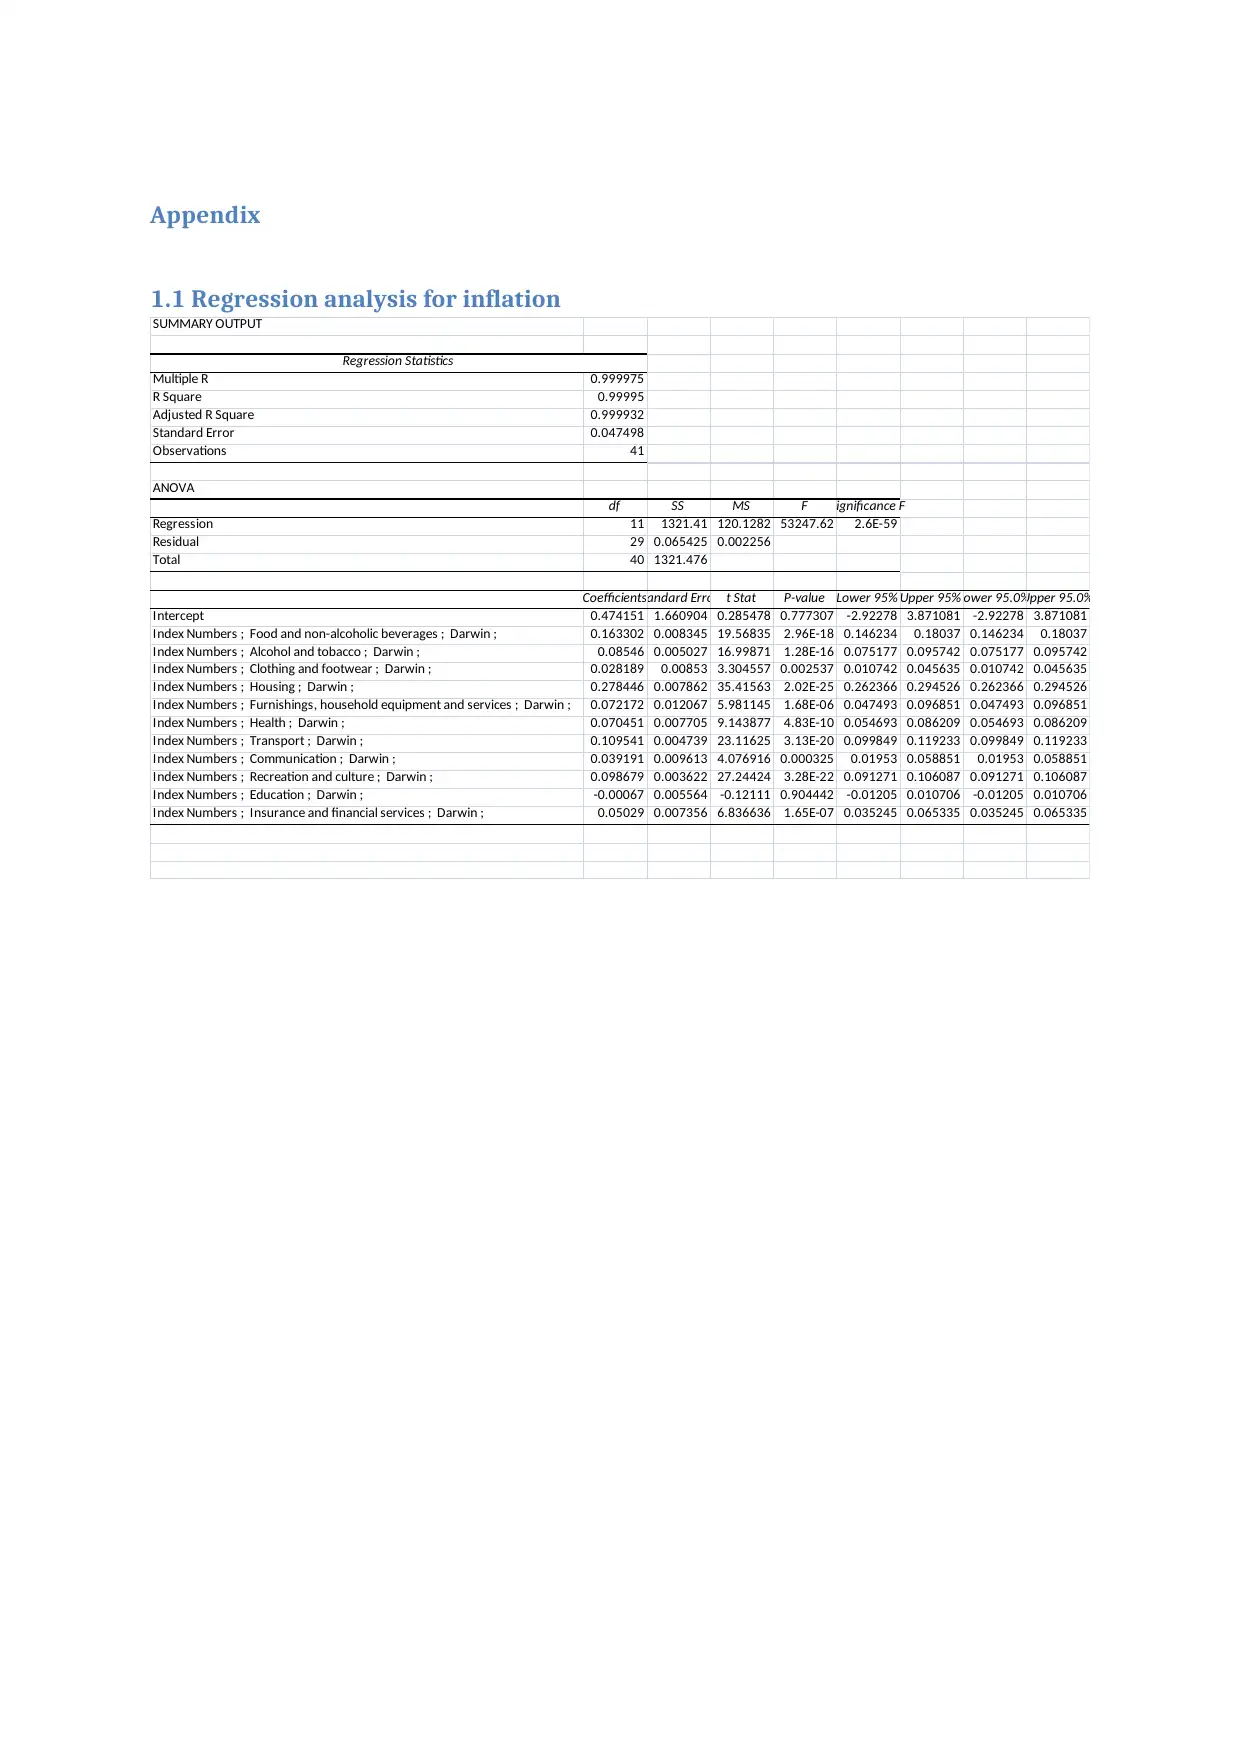
This report provides an analysis of the Australian economy, focusing on recent economic events such as the decline in the Australian dollar's value compared to the US dollar, and its impact on the economy. It examines GDP growth rates, comparing them to per capita income growth, and highlights the labor market dynamics, including unemployment and underemployment rates across different age groups. The report further investigates price movements, particularly inflation, and the factors influencing it, such as housing. It concludes with an assessment of the Reserve Bank's monetary policy, including the potential effects of increasing the cash rate to control inflation, and the rationale behind such decisions. The analysis includes several charts and tables to support the findings.
tabler-icon-diamond-filled.svg

Contribute Materials

Your contribution can guide someone’s learning journey. Share your documents today.
Document Page
Australia Economic Progress Report
Current Event
ï‚· One of the important recent economic events related to the economy of Australia has
been the reduction in the value of Australian currency. Compared to the US dollar, the
value of the Australian dollar has gone down significantly.
ï‚· Since the global financial crisis of the year 2007, it is the first time, the value of the
Australian currency have slumped so low. This event is macronomical in nature as it
influences the economy as a whole and not some specific economic agents.
ï‚· This is related to the domestic economy of Australia as the changing value of the
currency is expected to influence the purchasing power of the consumers and other
agents of the economy.
Figure 1: The value of the Australian currency compared to the US dollars over the
years
(Source: )
The reduction in the value of the Australian dollar compared to the US dollar means, its
purchasing power has gone down. This has both the negative and positive impacts on the
economy of Australia. While on one hand, the foreign debt of the country becomes more
burden for the government, the exported goods and services gets a competitive edge in the
tabler-icon-diamond-filled.svg

Secure Best Marks with AI Grader

Need help grading? Try our AI Grader for instant feedback on your assignments.
Document Page
global market due to the reduction in the cost. Therefore, Import- export is the major sector to
get affected by this event. This event has the capability to influence other macroeconomic
variables of the country as well. For example, changes in the volume of import and export
can change the current account deficit and trade deficit as well.
GDP Highlights
Mar-1990
Nov-1990
Jul-1991
Mar-1992
Nov-1992
Jul-1993
Mar-1994
Nov-1994
Jul-1995
Mar-1996
Nov-1996
Jul-1997
Mar-1998
Nov-1998
Jul-1999
Mar-2000
Nov-2000
Jul-2001
Mar-2002
Nov-2002
Jul-2003
Mar-2004
Nov-2004
Jul-2005
Mar-2006
Nov-2006
Jul-2007
Mar-2008
Nov-2008
Jul-2009
Mar-2010
Nov-2010
Jul-2011
Mar-2012
Nov-2012
Jul-2013
Mar-2014
Nov-2014
Jul-2015
Mar-2016
Nov-2016
Jul-2017
Mar-2018
Nov-2018
-1.00
-0.50
0.00
0.50
1.00
1.50
2.00
Comparison of GDP growth and per capita income
growth
GDP Growth Per capita income Growth
Years
Growth rate in percentage
Figure 2: The comparison of the GDP growth rate and per capita income growth rate
(Source: Developed by the learner)
As per the last two quarters of the above data, both the GDP growth rate and the per capita
income growth rate have reduced similar to the case of 1990/91. However, it needs to be
noted, as of now; the GDP growth rate of the economy has not become negative. Therefore
the economy is still growing at a reduced rate. The economy has not reached the trough
region and hence it cannot be classified as a recession.
Labour Market Highlights
Document Page
Chart 1
Jan-1990
Jun-1990
Nov-1990
Apr-1991
Sep-1991
Feb-1992
Jul-1992
Dec-1992
May-1993
Oct-1993
Mar-1994
Aug-1994
Jan-1995
Jun-1995
Nov-1995
Apr-1996
Sep-1996
Feb-1997
Jul-1997
Dec-1997
May-1998
Oct-1998
Mar-1999
Aug-1999
0.00
2.00
4.00
6.00
8.00
10.00
12.00
Comparison of age wise unemployment(1990-
1999
Total unemployment rate 15-24 Unemployment rate
25-34 unemployment rate 35-44 Unemployment rate
55 and above unemployment rate
Quarters
Unemployment rate
Figure 3: The comparison of the unemployment rate 1990-1999
(Source: Developed by the learner)
Chart 2
Document Page
Jan-2000
Oct-2000
Jul-2001
Apr-2002
Jan-2003
Oct-2003
Jul-2004
Apr-2005
Jan-2006
Oct-2006
Jul-2007
Apr-2008
Jan-2009
Oct-2009
Jul-2010
Apr-2011
Jan-2012
Oct-2012
Jul-2013
Apr-2014
Jan-2015
Oct-2015
Jul-2016
Apr-2017
Jan-2018
Oct-2018
0.00
1.00
2.00
3.00
4.00
5.00
6.00
7.00
8.00
Comparison of the unemployement rate (2000-
2019)
Total unemployment rate 15-24 Unemployment rate
25-34 unemployment rate 35-44 Unemployment rate
55 and above unemployment rate
Quarters
Unemployement rate
Figure 4: The comparison of the unemployment rate 2000-2019
(Source: Developed by the learner)
Underemploy
ed total ;
Persons ; 15-
19 years ;
Underemploy
ed total ;
Persons ; 25-
34 years ;
Underemploy
ed total ;
Persons ; 35-
44 years ;
Underemploy
ed total ;
Persons ; 45-
54 years ;
Underemploy
ed total ;
Persons ; 55
years and
over ;
Dec-18 181.868369 229.432031 170.740504 175.767678 138.951527
May-19 187.749604 228.213683 193.284079 187.595288 152.373389
percentage change 3.23378669 -0.5310276 13.203414 6.72911529 9.65938407
Table 1: the changes in under employment
(Source: Developed by the learner)
ï‚· As per the figure 35-44 age group experienced the highest increase in the
underemployment. On the other hand, age group 25-34 experienced the largest fall in
the underemployment between the given quarters.
Price Movements
tabler-icon-diamond-filled.svg

Secure Best Marks with AI Grader

Need help grading? Try our AI Grader for instant feedback on your assignments.
Document Page
Mar-2009
Aug-2009
Jan-2010
Jun-2010
Nov-2010
Apr-2011
Sep-2011
Feb-2012
Jul-2012
Dec-2012
May-2013
Oct-2013
Mar-2014
Aug-2014
Jan-2015
Jun-2015
Nov-2015
Apr-2016
Sep-2016
Feb-2017
Jul-2017
Dec-2017
May-2018
Oct-2018
Mar-2019
0.00
5.00
10.00
15.00
20.00
25.00
30.00
Inflation in australia
Inflation (MEL) Inflation(HOBERT) Inflation (DARWIN) Inflation (AUS)
Quarters
I
n
f
l
a
t
i
o
n
r
a
t
e
Figure 5: Inflation rates in Australia
(Source: developed by the learner)
ï‚· According to the regression analysis, it is the index for the housing that led to the
reduction in the inflation in Darwin in the recent years. (Analysis is given in appendix
1.1)
Monetary Policy
Now overall, it can be seen that the inflation is increasing in exponential manner throughout
the economy of Australia. Furthermore, from the data provided it can also be seen that, it is
the index for the housing that controls the inflation rate in the economy the most. Housing is
one of the industries where financial system of the country is directly related. Most of the
customers take loan to buy houses. Therefore, in order to have control over the increasing
interest rate of the economy, the reserve bank will have increased the cash rate by 50 basis
points. Cash rate is referred to as the rate at which central bank issues loan to the commercial
banks. The rationale behind this decision would be the reduction in the money supply that it
will generate. From the quantity theory of money it is clear that, inflation is directly related to
the money supply. Hence, as the cash rate will increase the commercial banks would increase
the nominal interest they charge for the home loans and hence both the demand for home and
the inflation in the economy would reduce. The demand for housing in Australia at the
Document Page
moment is inelastic and hence an increase in the cash rate by 25 basis point will not reduce
the demand for housing significantly and hence the inflation would remain the same.
Document Page
Appendix
1.1 Regression analysis for inflation
SUMMARY OUTPUT
Regression Statistics
Multiple R 0.999975
R Square 0.99995
Adjusted R Square 0.999932
Standard Error 0.047498
Observations 41
ANOVA
df SS MS F Significance F
Regression 11 1321.41 120.1282 53247.62 2.6E-59
Residual 29 0.065425 0.002256
Total 40 1321.476
CoefficientsStandard Error t Stat P-value Lower 95% Upper 95%Lower 95.0%Upper 95.0%
Intercept 0.474151 1.660904 0.285478 0.777307 -2.92278 3.871081 -2.92278 3.871081
Index Numbers ; Food and non-alcoholic beverages ; Darwin ; 0.163302 0.008345 19.56835 2.96E-18 0.146234 0.18037 0.146234 0.18037
Index Numbers ; Alcohol and tobacco ; Darwin ; 0.08546 0.005027 16.99871 1.28E-16 0.075177 0.095742 0.075177 0.095742
Index Numbers ; Clothing and footwear ; Darwin ; 0.028189 0.00853 3.304557 0.002537 0.010742 0.045635 0.010742 0.045635
Index Numbers ; Housing ; Darwin ; 0.278446 0.007862 35.41563 2.02E-25 0.262366 0.294526 0.262366 0.294526
Index Numbers ; Furnishings, household equipment and services ; Darwin ; 0.072172 0.012067 5.981145 1.68E-06 0.047493 0.096851 0.047493 0.096851
Index Numbers ; Health ; Darwin ; 0.070451 0.007705 9.143877 4.83E-10 0.054693 0.086209 0.054693 0.086209
Index Numbers ; Transport ; Darwin ; 0.109541 0.004739 23.11625 3.13E-20 0.099849 0.119233 0.099849 0.119233
Index Numbers ; Communication ; Darwin ; 0.039191 0.009613 4.076916 0.000325 0.01953 0.058851 0.01953 0.058851
Index Numbers ; Recreation and culture ; Darwin ; 0.098679 0.003622 27.24424 3.28E-22 0.091271 0.106087 0.091271 0.106087
Index Numbers ; Education ; Darwin ; -0.00067 0.005564 -0.12111 0.904442 -0.01205 0.010706 -0.01205 0.010706
Index Numbers ; Insurance and financial services ; Darwin ; 0.05029 0.007356 6.836636 1.65E-07 0.035245 0.065335 0.035245 0.065335
chevron_up_icon
1 out of 7
circle_padding
hide_on_mobile
zoom_out_icon
logo.png

Your All-in-One AI-Powered Toolkit for Academic Success.

Available 24*7 on WhatsApp / Email

[object Object]