Singapore's Economic Trends: Performance Analysis from 2008-2018
VerifiedAdded on 2023/06/10
|15
|2891
|207
Report
AI Summary
This report provides an analysis of Singapore's economic performance from 2008 to 2018, utilizing macroeconomic indicators such as Real GDP, Real GDP growth rate, Real GDP per capita, unemployment rate, and inflation rate to assess the strength of the economy. The analysis includes trends in production output performance, examining Real GDP growth and government measures to improve production. It also explores the labor market, focusing on unemployment trends, types of unemployment prevalent in Singapore, and government initiatives to achieve full employment. Furthermore, the report delves into price level analysis, examining inflation trends, causes of inflation, and government measures for attaining price stability. The report uses graphs and data to support its findings, providing a comprehensive overview of Singapore's economic landscape during the specified period.
Running head: ECONOMICS
Economics
Name of the Student
Name of the University
Authors Note
Course ID
Economics
Name of the Student
Name of the University
Authors Note
Course ID
Paraphrase This Document
Need a fresh take? Get an instant paraphrase of this document with our AI Paraphraser
1ECONOMICS
Introduction:
Singapore is actually built on its prosperity as the entre-pot and also the importer of
neighbouring nation’s raw materials for processing. Singapore has greater degree of
government intervention, with strong currency and comparatively lower inflation (Lim,
2016). Singapore economy has a good record of prudent macro-economic administration and
excellent growth. The Singapore economy is ranked as world’s most open economy. With
low tax rate of 14.2% of the gross domestic product, the economy of Singapore has the third
highest GDP per capita in the world in respect of the purchase power parity.
The economy has benefitted from the foreign direct investment across the global
investors and institutes because of the highly attractive climate for investment with stable
political environment (Goh, 2017). Singapore exports especially in the electronics, chemicals
and services. To preserve Singapore’s global standing and advance its economy wealth the
government has undertaken numerous measures to encourage investment, entrepreneurship
and re-train its workforce.
The essay is based on understanding the economic performance of Singapore from
2008-18. To assess the performance trend tools such as Real GDP, GDP Per Capita,
Unemployment and Inflation would be studied.
Analysis of Production Output Performance:
Real GDP:
Real GDP is better recognised as the inflation-adjusted GDP that measures the value
of the finished goods and service in an economy based on the constant base-year prices. The
Real GDP is adjusted for inflation or deflation by using the nominal GDP and GDP deflator.
2ECONOMICS
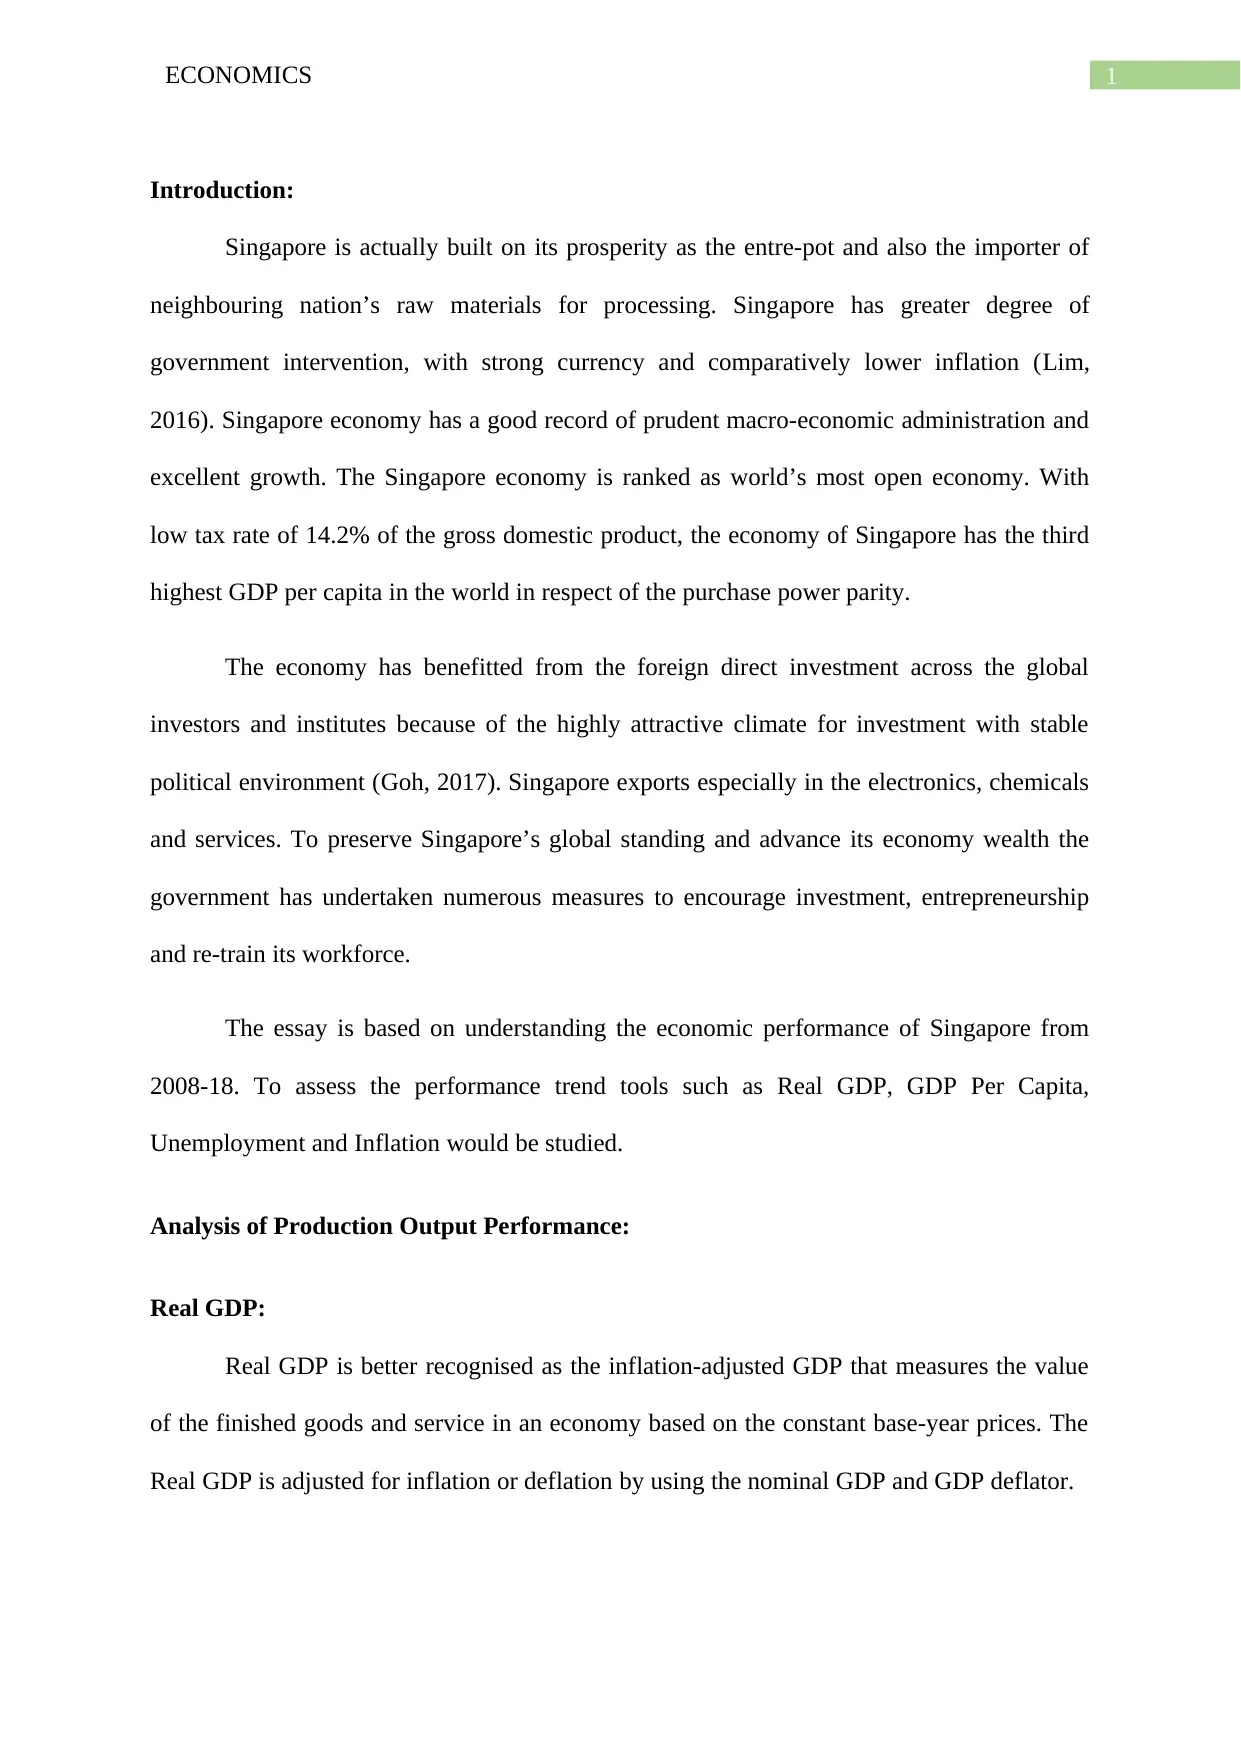
Figure 1: Figure showing Real GDP of Singapore
(Source: ceicdata, 2018)
The real GDP of Singapore increased by 3.8% during 2018 June after the growth of
4.3% in the earlier quarter (ceicdata, 2018). Until June 2018, the Singapore’s Real GDP
averaged around 7.3%. The trend reflects that it went the highest during June 2010 and also
recorded the lowest of -8.8% during 2009 March, primarily because of international financial
crisis.
Real GDP grate rate:
The real GDP growth rate is referred as the rate based on which a nations GDP
changes or increases year after year. GDP is referred as the market value of goods and
services manufactured in a nation for a particular time period.
⊘ This is a preview!⊘
Do you want full access?
Subscribe today to unlock all pages.
Trusted by 1+ million students worldwide
3ECONOMICS
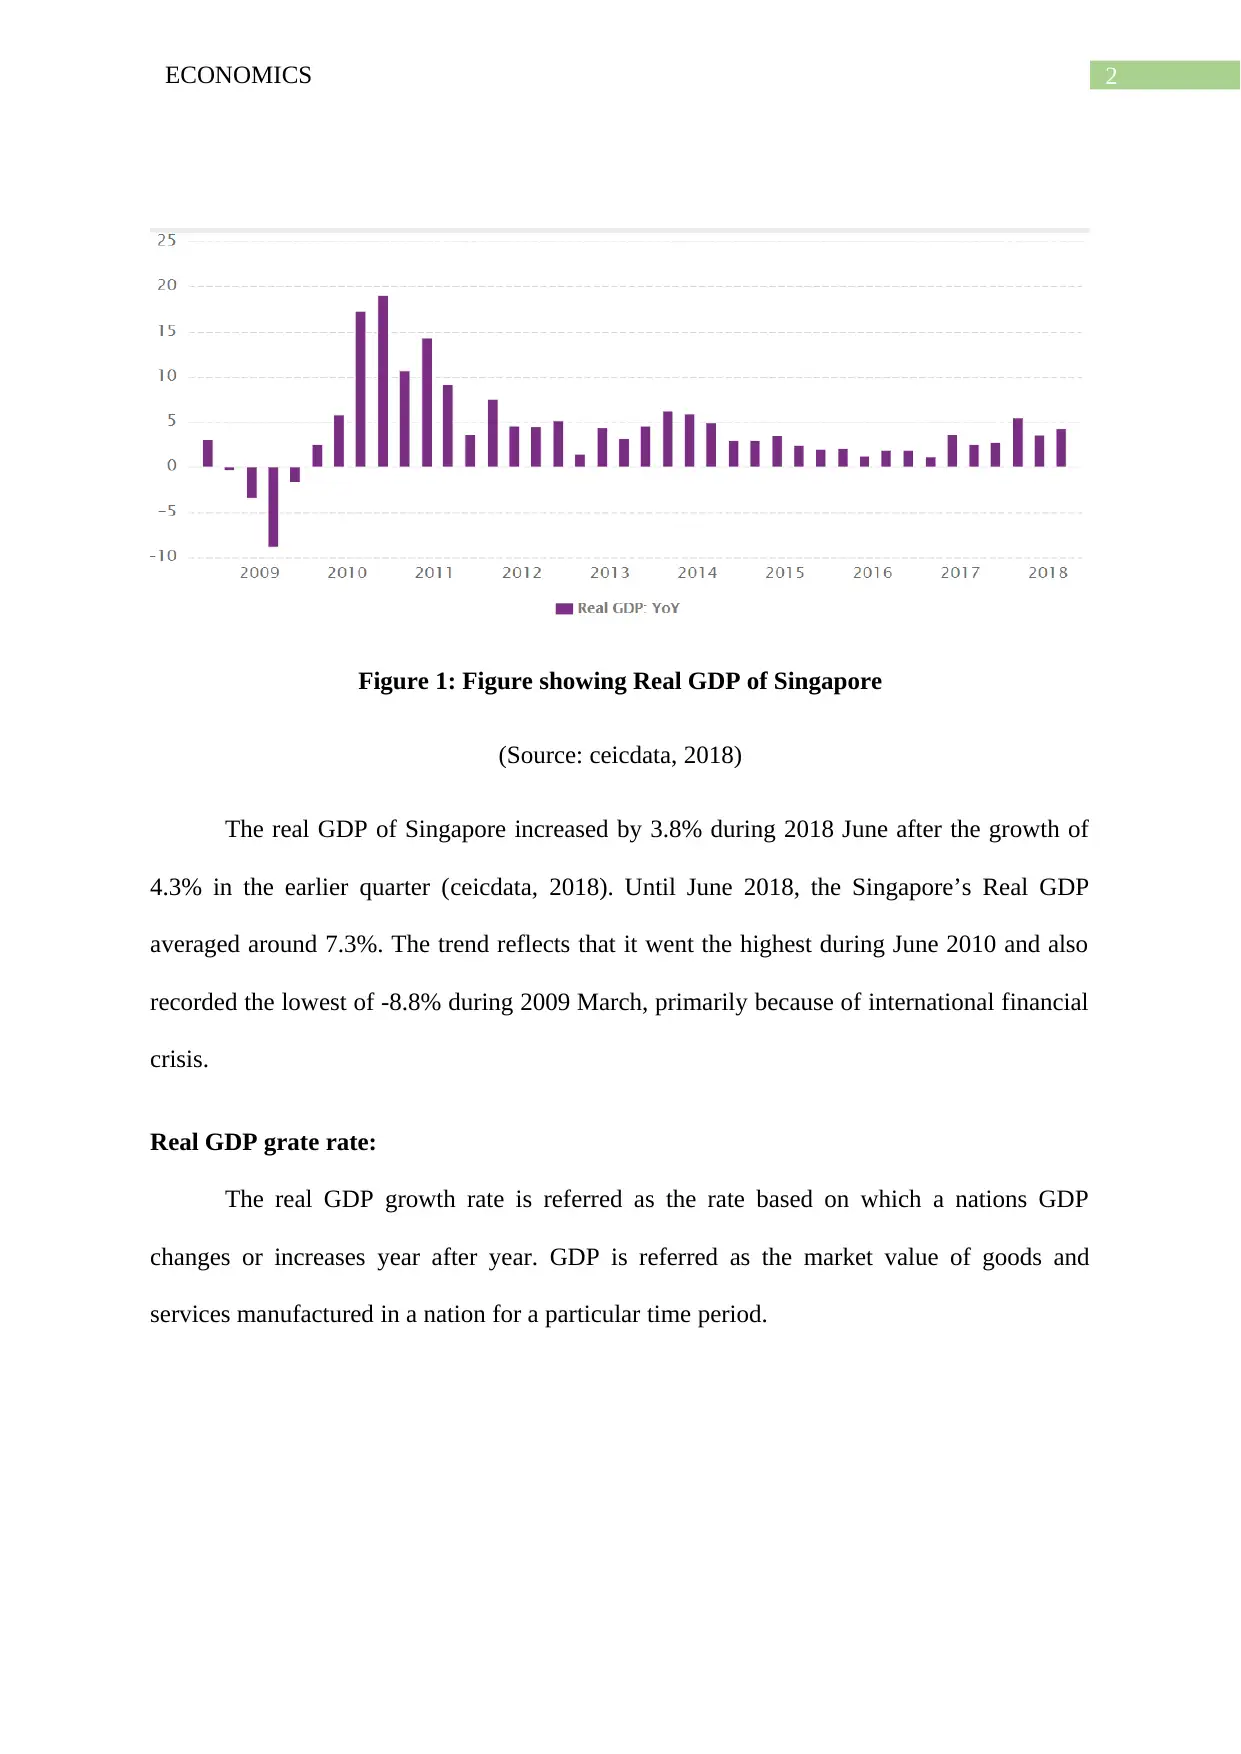
Figure 2: Figure showing Real GDP of Singapore
(Source: tradingeconomics, 2018)
The above stated graphical representation provides that the economy of Singapore has
increased by 3.8%. Evidences gained from graphical trend explains that Singapore has
reported a reduced growth in GDP from the downwardly revised trend of 4.3% which was
achieved in first quarter and less than the consensus expiation of 4% rise (tradingeconomics,
2018). The yearly quarterly growth of Singapore rose by 1% after the downward trend in
growth rate of 1.5%. The yearly GDP growth rate of Singapore averaged approximately
6.65% in 2018. The GDP growth rate increased by 19% in the second quarter 2010 but also
recorded a negative growth of -8.80 in 2009 first quarter.
Real GDP Per Capita:
The real GDP Per Capita is viewed as the value of overall economic productivity for a
country which is separated by the total number of person after adjusting with inflation. The
main purpose of real GDP per capita is to understand the standard living for a country over
the period of time.
Paraphrase This Document
Need a fresh take? Get an instant paraphrase of this document with our AI Paraphraser
4ECONOMICS
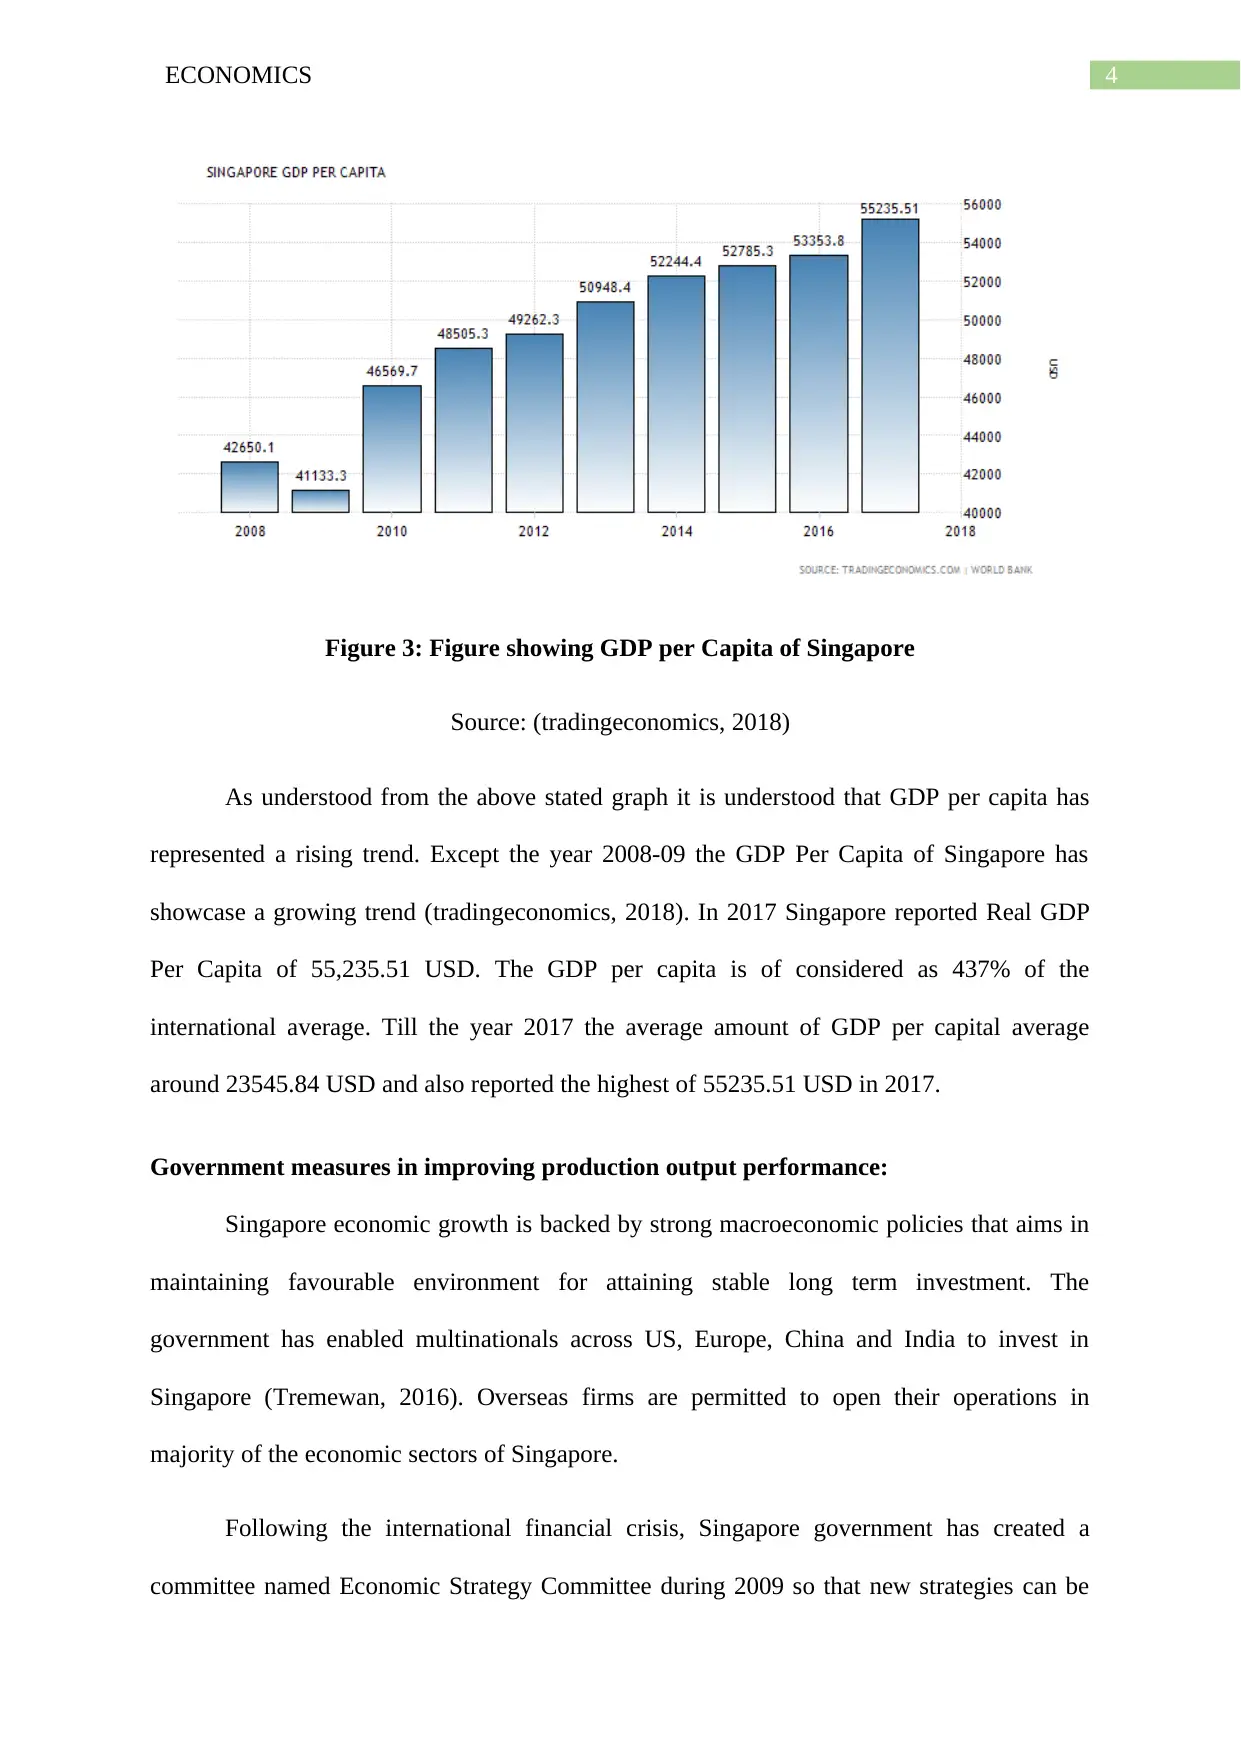
Figure 3: Figure showing GDP per Capita of Singapore
Source: (tradingeconomics, 2018)
As understood from the above stated graph it is understood that GDP per capita has
represented a rising trend. Except the year 2008-09 the GDP Per Capita of Singapore has
showcase a growing trend (tradingeconomics, 2018). In 2017 Singapore reported Real GDP
Per Capita of 55,235.51 USD. The GDP per capita is of considered as 437% of the
international average. Till the year 2017 the average amount of GDP per capital average
around 23545.84 USD and also reported the highest of 55235.51 USD in 2017.
Government measures in improving production output performance:
Singapore economic growth is backed by strong macroeconomic policies that aims in
maintaining favourable environment for attaining stable long term investment. The
government has enabled multinationals across US, Europe, China and India to invest in
Singapore (Tremewan, 2016). Overseas firms are permitted to open their operations in
majority of the economic sectors of Singapore.
Following the international financial crisis, Singapore government has created a
committee named Economic Strategy Committee during 2009 so that new strategies can be
5ECONOMICS
implemented towards attaining sustainable economic growth (Thangavelu, 2016). The
government has also encouraged skill and innovation to strengthen commercialization of
R&D for making diversified corporate system (Ho & Wong, 2016). This would help
Singapore in making smart energy efficient economy with increased productivity for future
expansion of the economy and developing a distinctive city as well.
Analysis of Labour Market:
Unemployment trends:
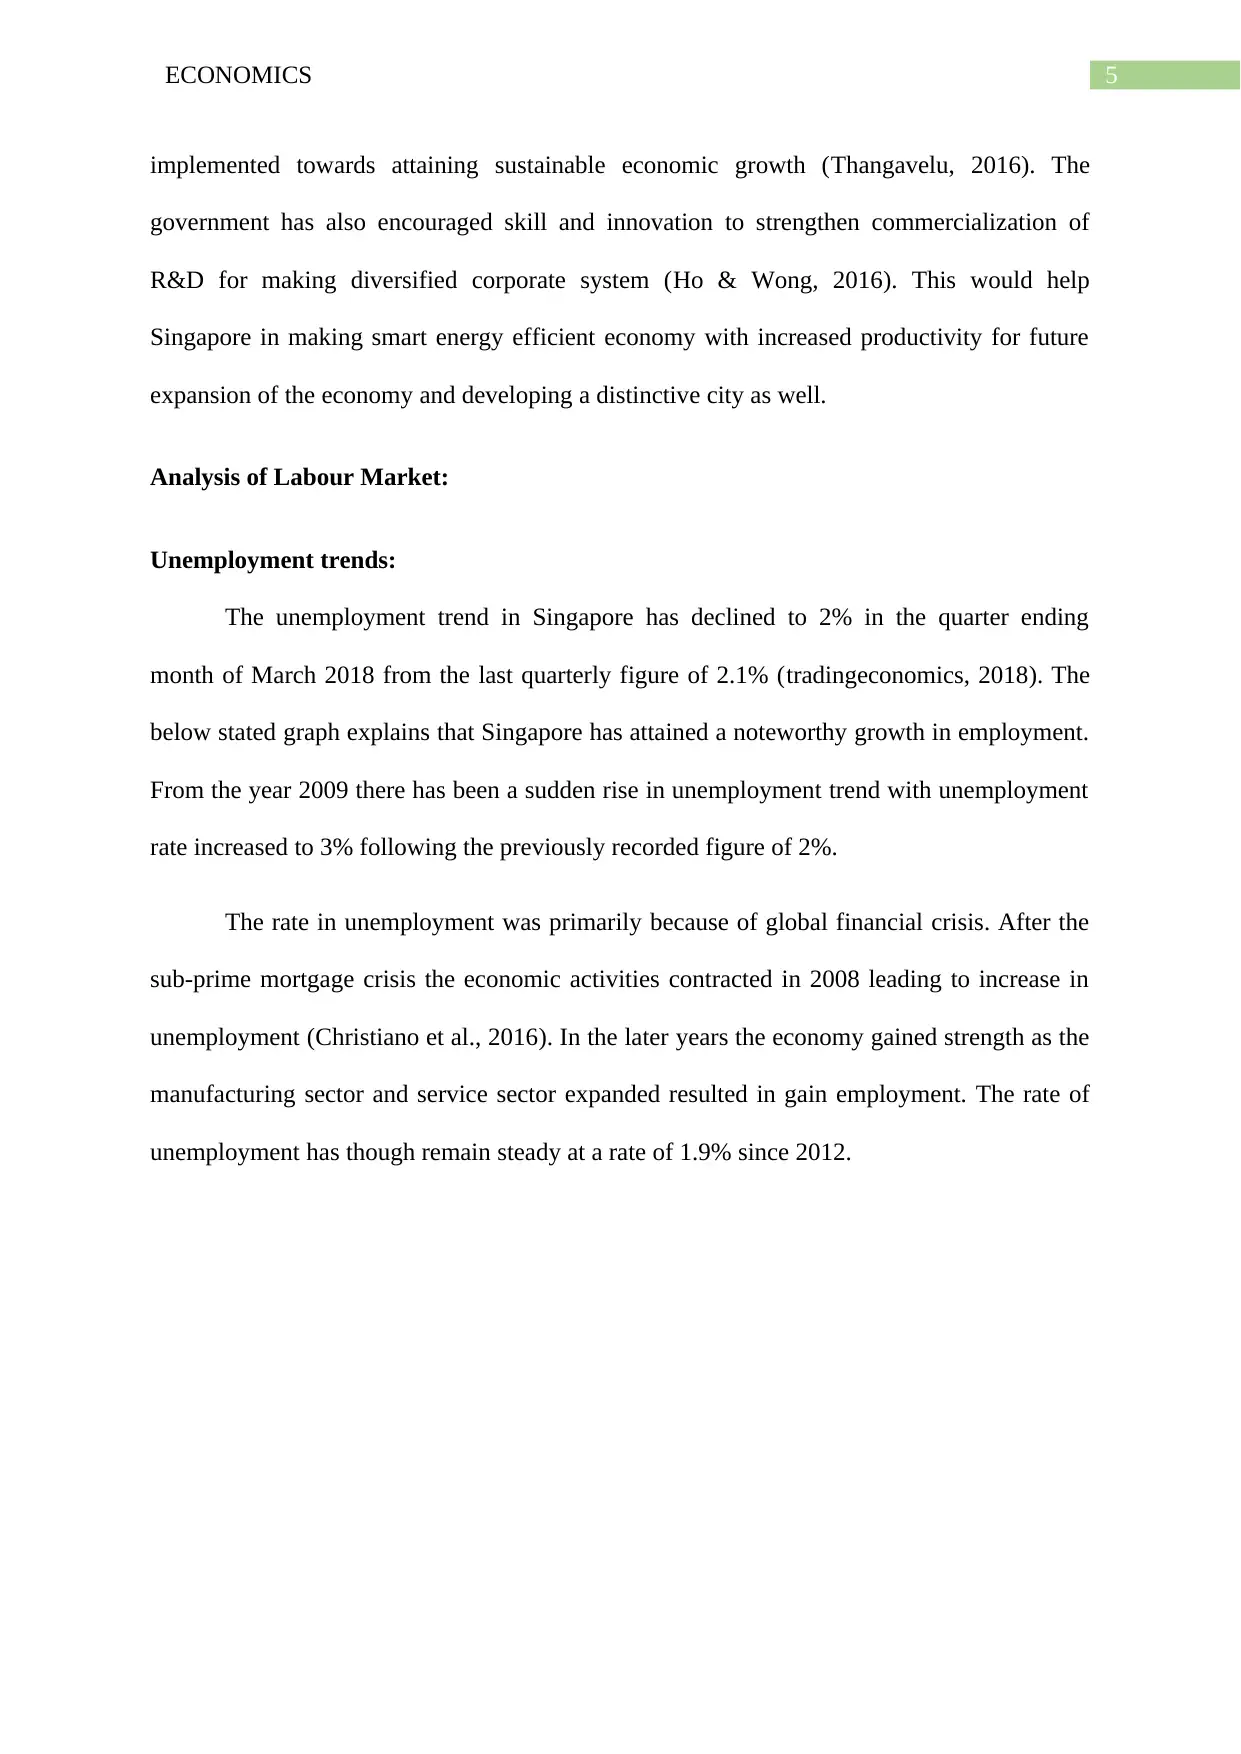
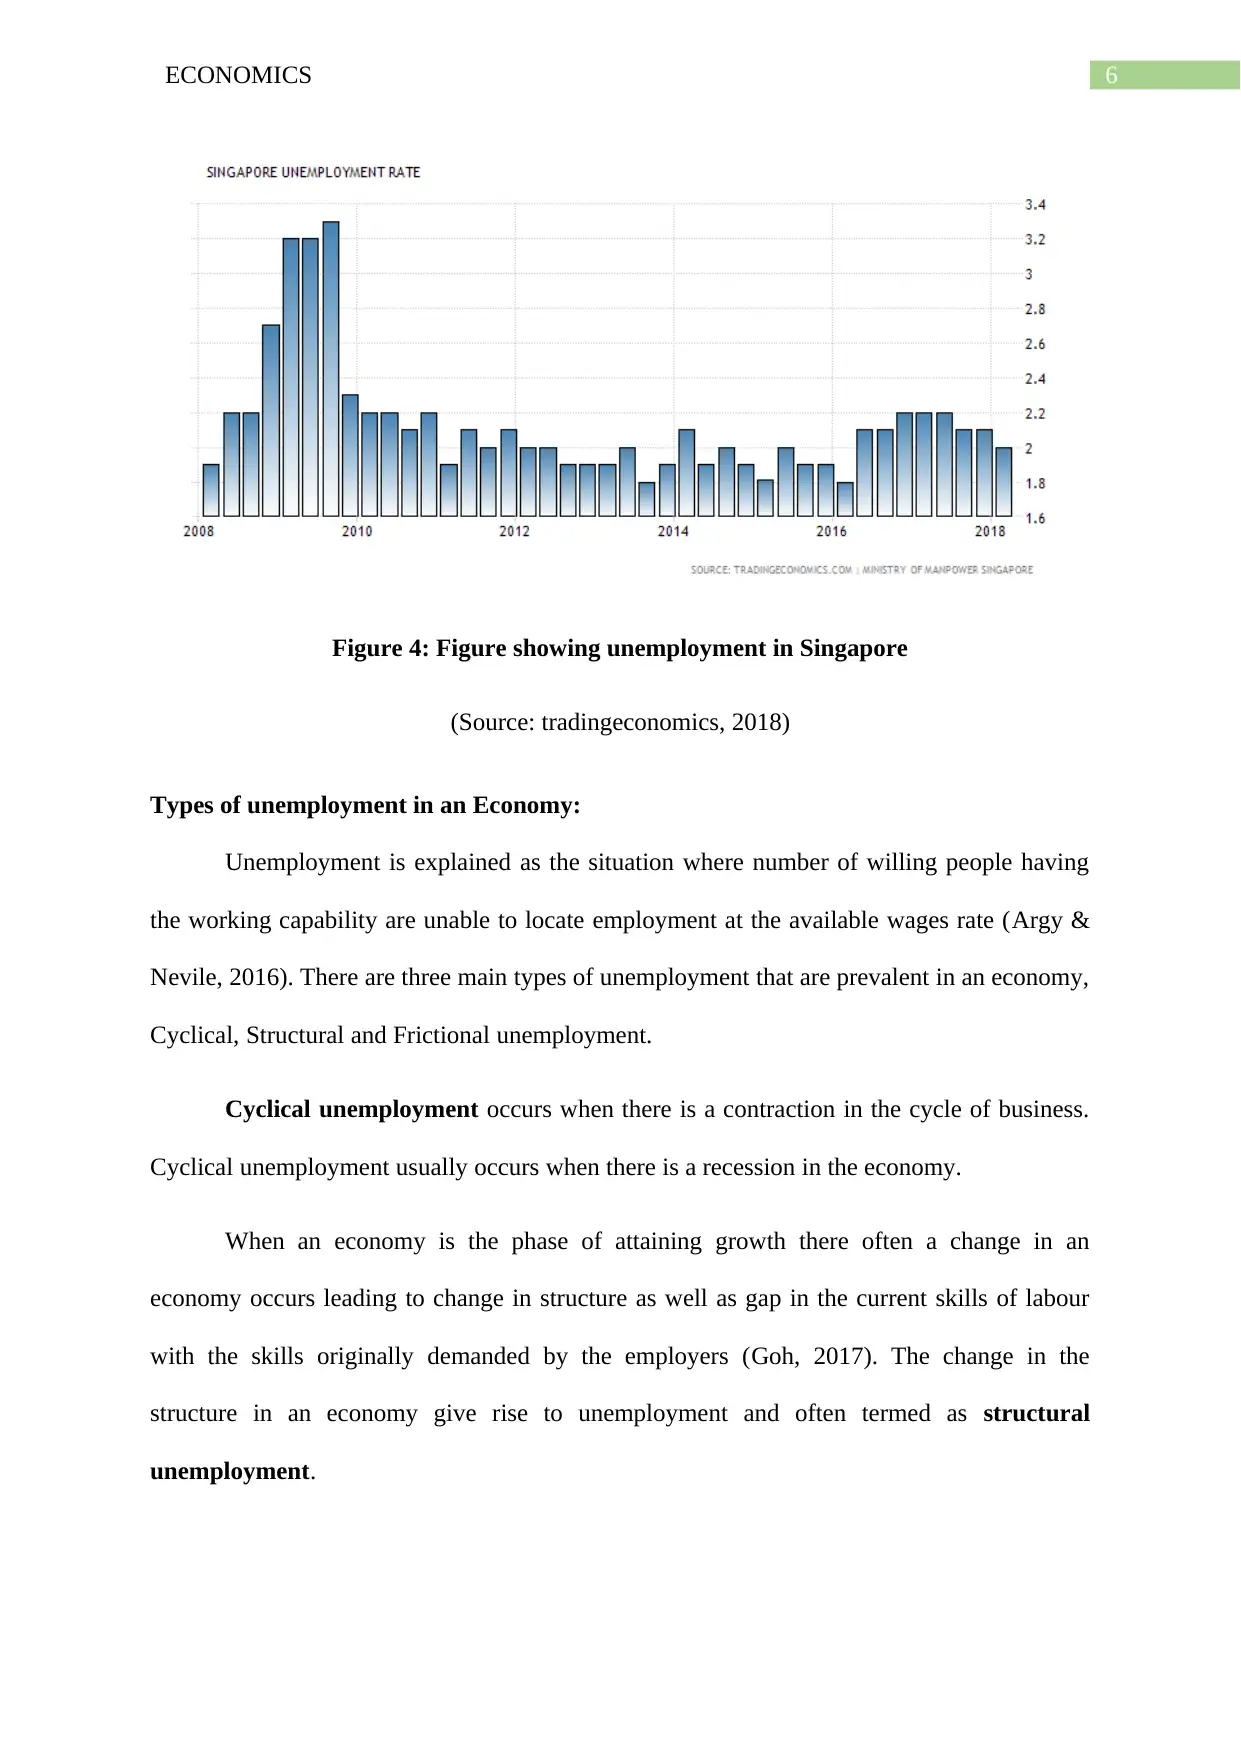
The unemployment trend in Singapore has declined to 2% in the quarter ending
month of March 2018 from the last quarterly figure of 2.1% (tradingeconomics, 2018). The
below stated graph explains that Singapore has attained a noteworthy growth in employment.
From the year 2009 there has been a sudden rise in unemployment trend with unemployment
rate increased to 3% following the previously recorded figure of 2%.
The rate in unemployment was primarily because of global financial crisis. After the
sub-prime mortgage crisis the economic activities contracted in 2008 leading to increase in
unemployment (Christiano et al., 2016). In the later years the economy gained strength as the
manufacturing sector and service sector expanded resulted in gain employment. The rate of
unemployment has though remain steady at a rate of 1.9% since 2012.
implemented towards attaining sustainable economic growth (Thangavelu, 2016). The
government has also encouraged skill and innovation to strengthen commercialization of
R&D for making diversified corporate system (Ho & Wong, 2016). This would help
Singapore in making smart energy efficient economy with increased productivity for future
expansion of the economy and developing a distinctive city as well.
Analysis of Labour Market:
Unemployment trends:
The unemployment trend in Singapore has declined to 2% in the quarter ending
month of March 2018 from the last quarterly figure of 2.1% (tradingeconomics, 2018). The
below stated graph explains that Singapore has attained a noteworthy growth in employment.
From the year 2009 there has been a sudden rise in unemployment trend with unemployment
rate increased to 3% following the previously recorded figure of 2%.
The rate in unemployment was primarily because of global financial crisis. After the
sub-prime mortgage crisis the economic activities contracted in 2008 leading to increase in
unemployment (Christiano et al., 2016). In the later years the economy gained strength as the
manufacturing sector and service sector expanded resulted in gain employment. The rate of
unemployment has though remain steady at a rate of 1.9% since 2012.
⊘ This is a preview!⊘
Do you want full access?
Subscribe today to unlock all pages.
Trusted by 1+ million students worldwide
6ECONOMICS
Figure 4: Figure showing unemployment in Singapore
(Source: tradingeconomics, 2018)
Types of unemployment in an Economy:
Unemployment is explained as the situation where number of willing people having
the working capability are unable to locate employment at the available wages rate (Argy &
Nevile, 2016). There are three main types of unemployment that are prevalent in an economy,
Cyclical, Structural and Frictional unemployment.
Cyclical unemployment occurs when there is a contraction in the cycle of business.
Cyclical unemployment usually occurs when there is a recession in the economy.
When an economy is the phase of attaining growth there often a change in an
economy occurs leading to change in structure as well as gap in the current skills of labour
with the skills originally demanded by the employers (Goh, 2017). The change in the
structure in an economy give rise to unemployment and often termed as structural
unemployment.
Paraphrase This Document
Need a fresh take? Get an instant paraphrase of this document with our AI Paraphraser
7ECONOMICS
Frictional unemployment occurs due to the infrequent turnover in work market and
the time a worker takes to locate a new work. Where in labour market a labour changes job
and time taken by the labour to find new job in matching with abilities is regarded as
frictional employment.
Types of unemployment in Singapore:
Singapore mainly suffers from three types of unemployment, this includes structural
unemployment, cyclical unemployment and frictional unemployment.
With the rapid globalization the economy of Singapore has underwent significant
reformation and this has given rise to structural unemployment among the labour market. The
economy of Singapore has changed from labour intensive to capital intensive economy and
this has given rise to varied capabilities (Lim, 2016). Currently Singapore has moved to R&D
and biomedical which force the workers to find work in secondary engineering production or
may find in a situation of joblessness since majority of the manufacturing may be contracted
to China and India.
Frictional unemployment is another form of employment that is prevalent in the
economy of Singapore due to the time taken by the labour for finding new from old job (Lim,
2016). Fresh graduates and students that are studying in Singapore are generally frictionally
unemployed for the time taken by the student to find new job.
Government measures in achieving full employment:
The objective of Singapore government is to attain full employment following the
global financial crisis (Ho, 2017). The government of Singapore has initiated demand side
policy to curb down the cyclical unemployment by promoting Job Credit Schemes by
promoting investment in small and medium term enterprise.
8ECONOMICS
Singapore labour market consists of both the overseas and domestic labours.
Singapore manpower ministry believes that the economy can be open for better job
opportunity by promoting investment in career support program (Maitra, 2016). Such
programs would help citizens below the 40 years to be employed as manager, consultant,
executive and technicians following the redundancy from their employment.
Other government measures such as wage subsidiaries, P-max program and career
conversion programs are some of the initiatives that are aimed at attaining full employment in
Singapore.
Price level analysis:
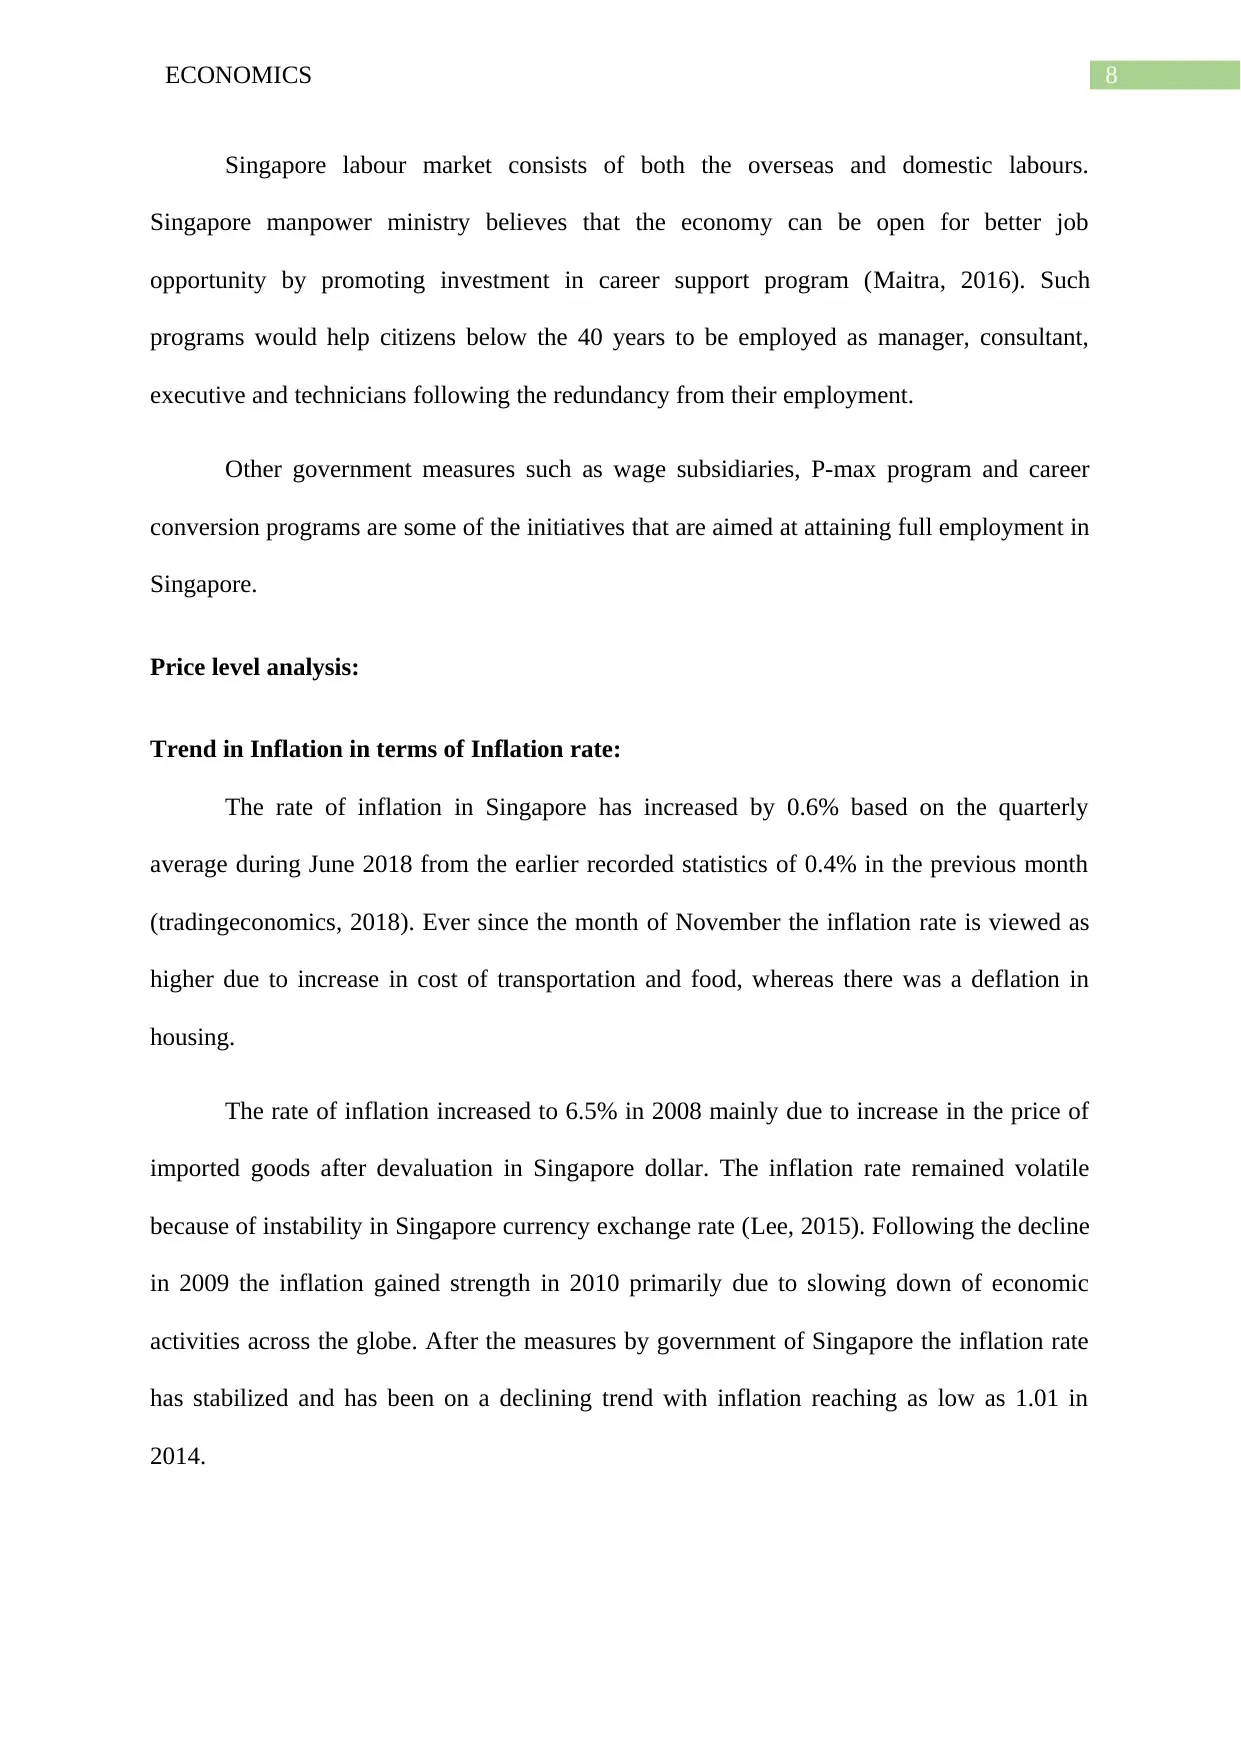
Trend in Inflation in terms of Inflation rate:
The rate of inflation in Singapore has increased by 0.6% based on the quarterly
average during June 2018 from the earlier recorded statistics of 0.4% in the previous month
(tradingeconomics, 2018). Ever since the month of November the inflation rate is viewed as
higher due to increase in cost of transportation and food, whereas there was a deflation in
housing.
The rate of inflation increased to 6.5% in 2008 mainly due to increase in the price of
imported goods after devaluation in Singapore dollar. The inflation rate remained volatile
because of instability in Singapore currency exchange rate (Lee, 2015). Following the decline
in 2009 the inflation gained strength in 2010 primarily due to slowing down of economic
activities across the globe. After the measures by government of Singapore the inflation rate
has stabilized and has been on a declining trend with inflation reaching as low as 1.01 in
2014.
Singapore labour market consists of both the overseas and domestic labours.
Singapore manpower ministry believes that the economy can be open for better job
opportunity by promoting investment in career support program (Maitra, 2016). Such
programs would help citizens below the 40 years to be employed as manager, consultant,
executive and technicians following the redundancy from their employment.
Other government measures such as wage subsidiaries, P-max program and career
conversion programs are some of the initiatives that are aimed at attaining full employment in
Singapore.
Price level analysis:
Trend in Inflation in terms of Inflation rate:
The rate of inflation in Singapore has increased by 0.6% based on the quarterly
average during June 2018 from the earlier recorded statistics of 0.4% in the previous month
(tradingeconomics, 2018). Ever since the month of November the inflation rate is viewed as
higher due to increase in cost of transportation and food, whereas there was a deflation in
housing.
The rate of inflation increased to 6.5% in 2008 mainly due to increase in the price of
imported goods after devaluation in Singapore dollar. The inflation rate remained volatile
because of instability in Singapore currency exchange rate (Lee, 2015). Following the decline
in 2009 the inflation gained strength in 2010 primarily due to slowing down of economic
activities across the globe. After the measures by government of Singapore the inflation rate
has stabilized and has been on a declining trend with inflation reaching as low as 1.01 in
2014.
⊘ This is a preview!⊘
Do you want full access?
Subscribe today to unlock all pages.
Trusted by 1+ million students worldwide
9ECONOMICS
Figure 5: Figure showing inflation rate in Singapore
(Source: tradingeconomics, 2018)
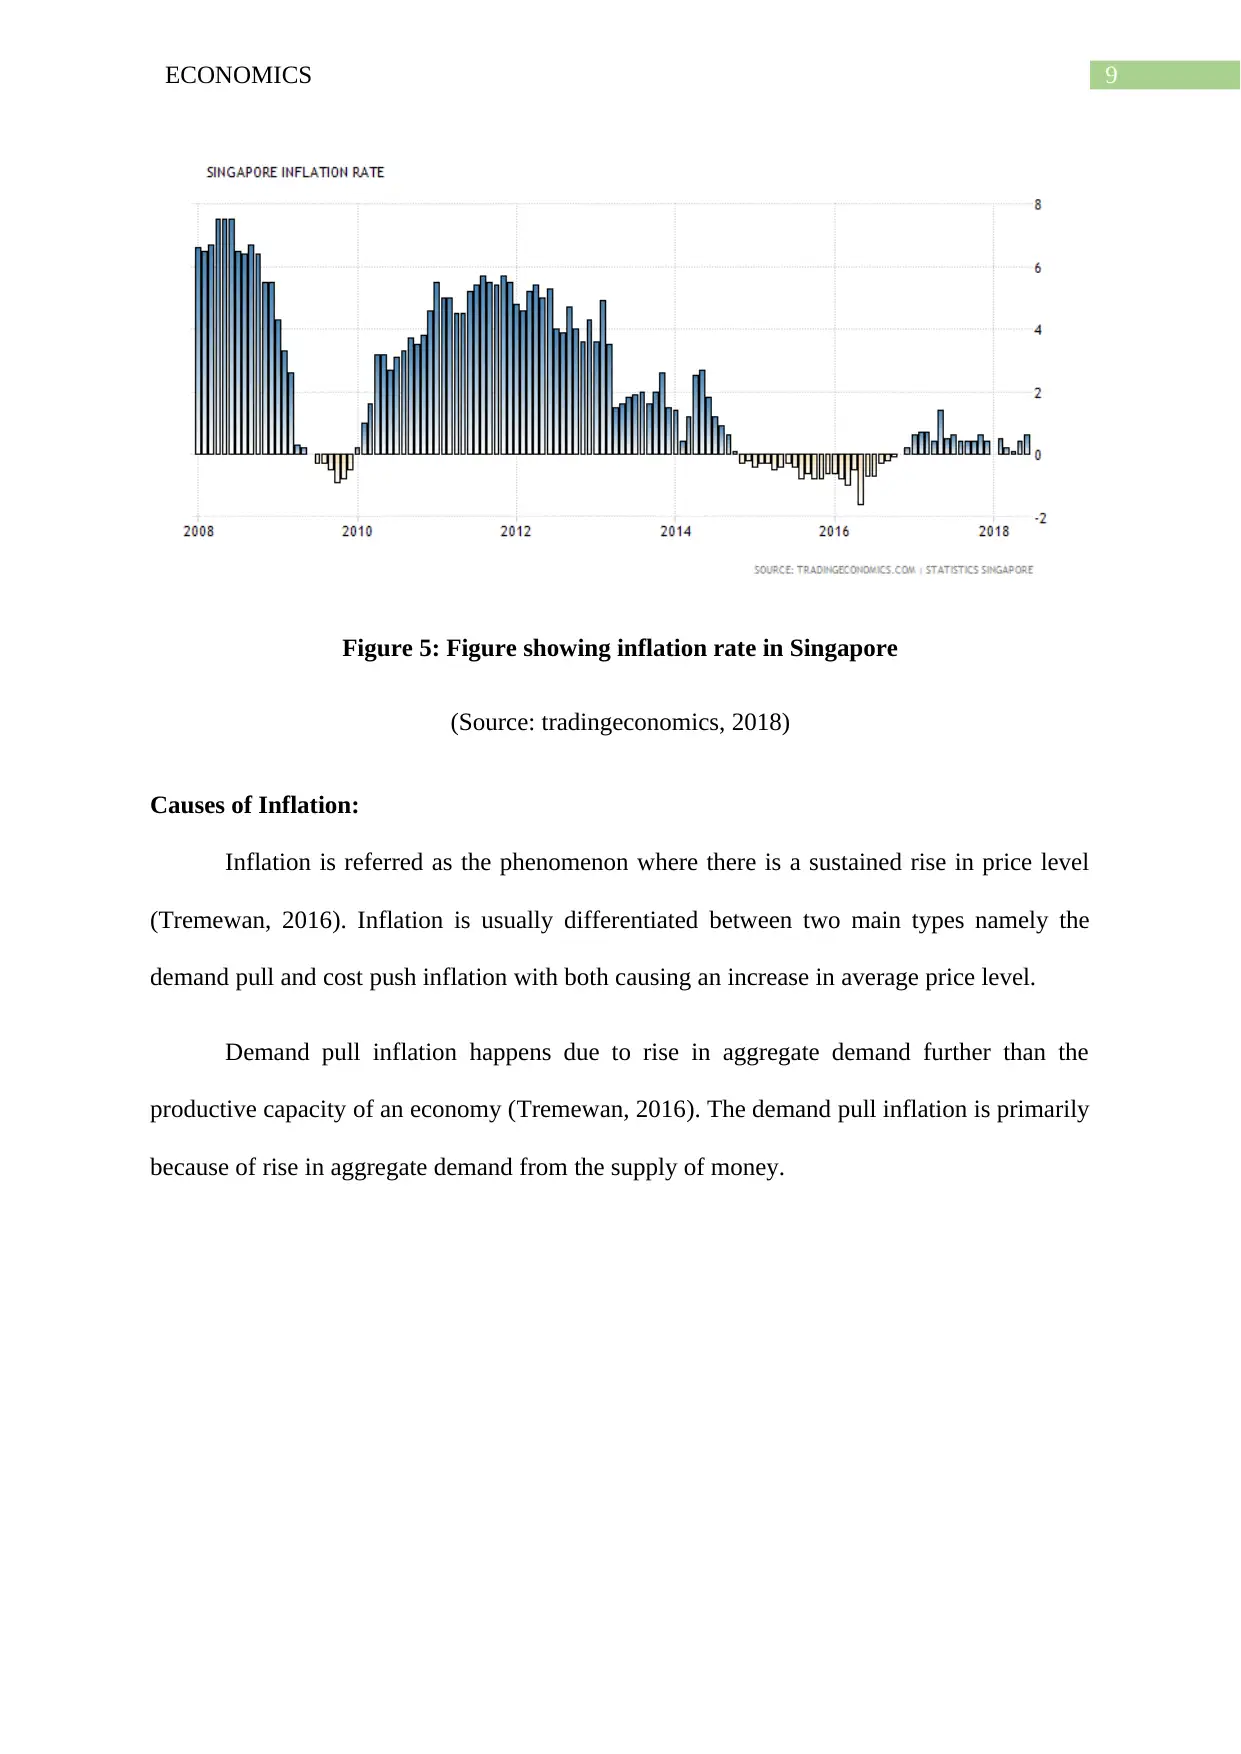
Causes of Inflation:
Inflation is referred as the phenomenon where there is a sustained rise in price level
(Tremewan, 2016). Inflation is usually differentiated between two main types namely the
demand pull and cost push inflation with both causing an increase in average price level.
Demand pull inflation happens due to rise in aggregate demand further than the
productive capacity of an economy (Tremewan, 2016). The demand pull inflation is primarily
because of rise in aggregate demand from the supply of money.
Figure 5: Figure showing inflation rate in Singapore
(Source: tradingeconomics, 2018)
Causes of Inflation:
Inflation is referred as the phenomenon where there is a sustained rise in price level
(Tremewan, 2016). Inflation is usually differentiated between two main types namely the
demand pull and cost push inflation with both causing an increase in average price level.
Demand pull inflation happens due to rise in aggregate demand further than the
productive capacity of an economy (Tremewan, 2016). The demand pull inflation is primarily
because of rise in aggregate demand from the supply of money.
Paraphrase This Document
Need a fresh take? Get an instant paraphrase of this document with our AI Paraphraser
10ECONOMICS
Figure 6: Figure showing Demand – Pull Inflation
(Source: As Created by Author)
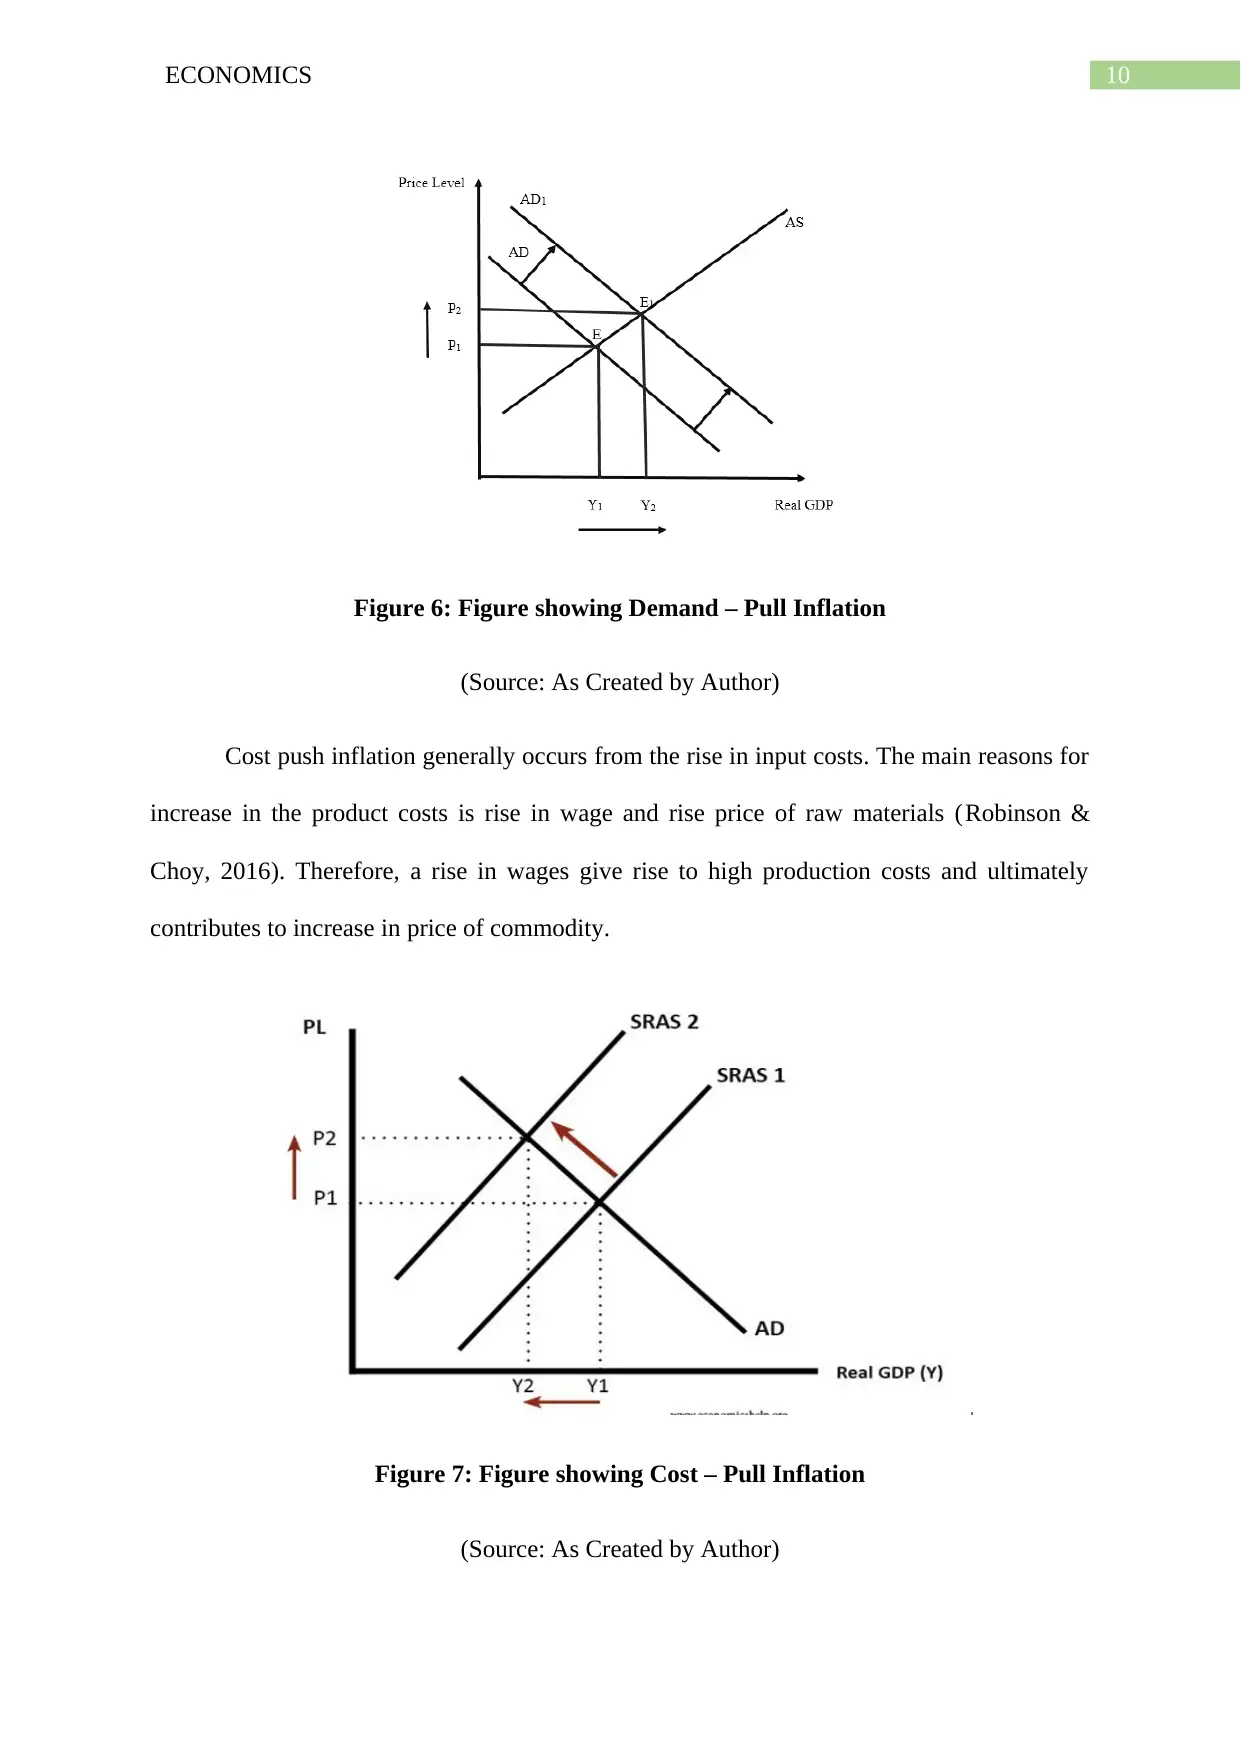
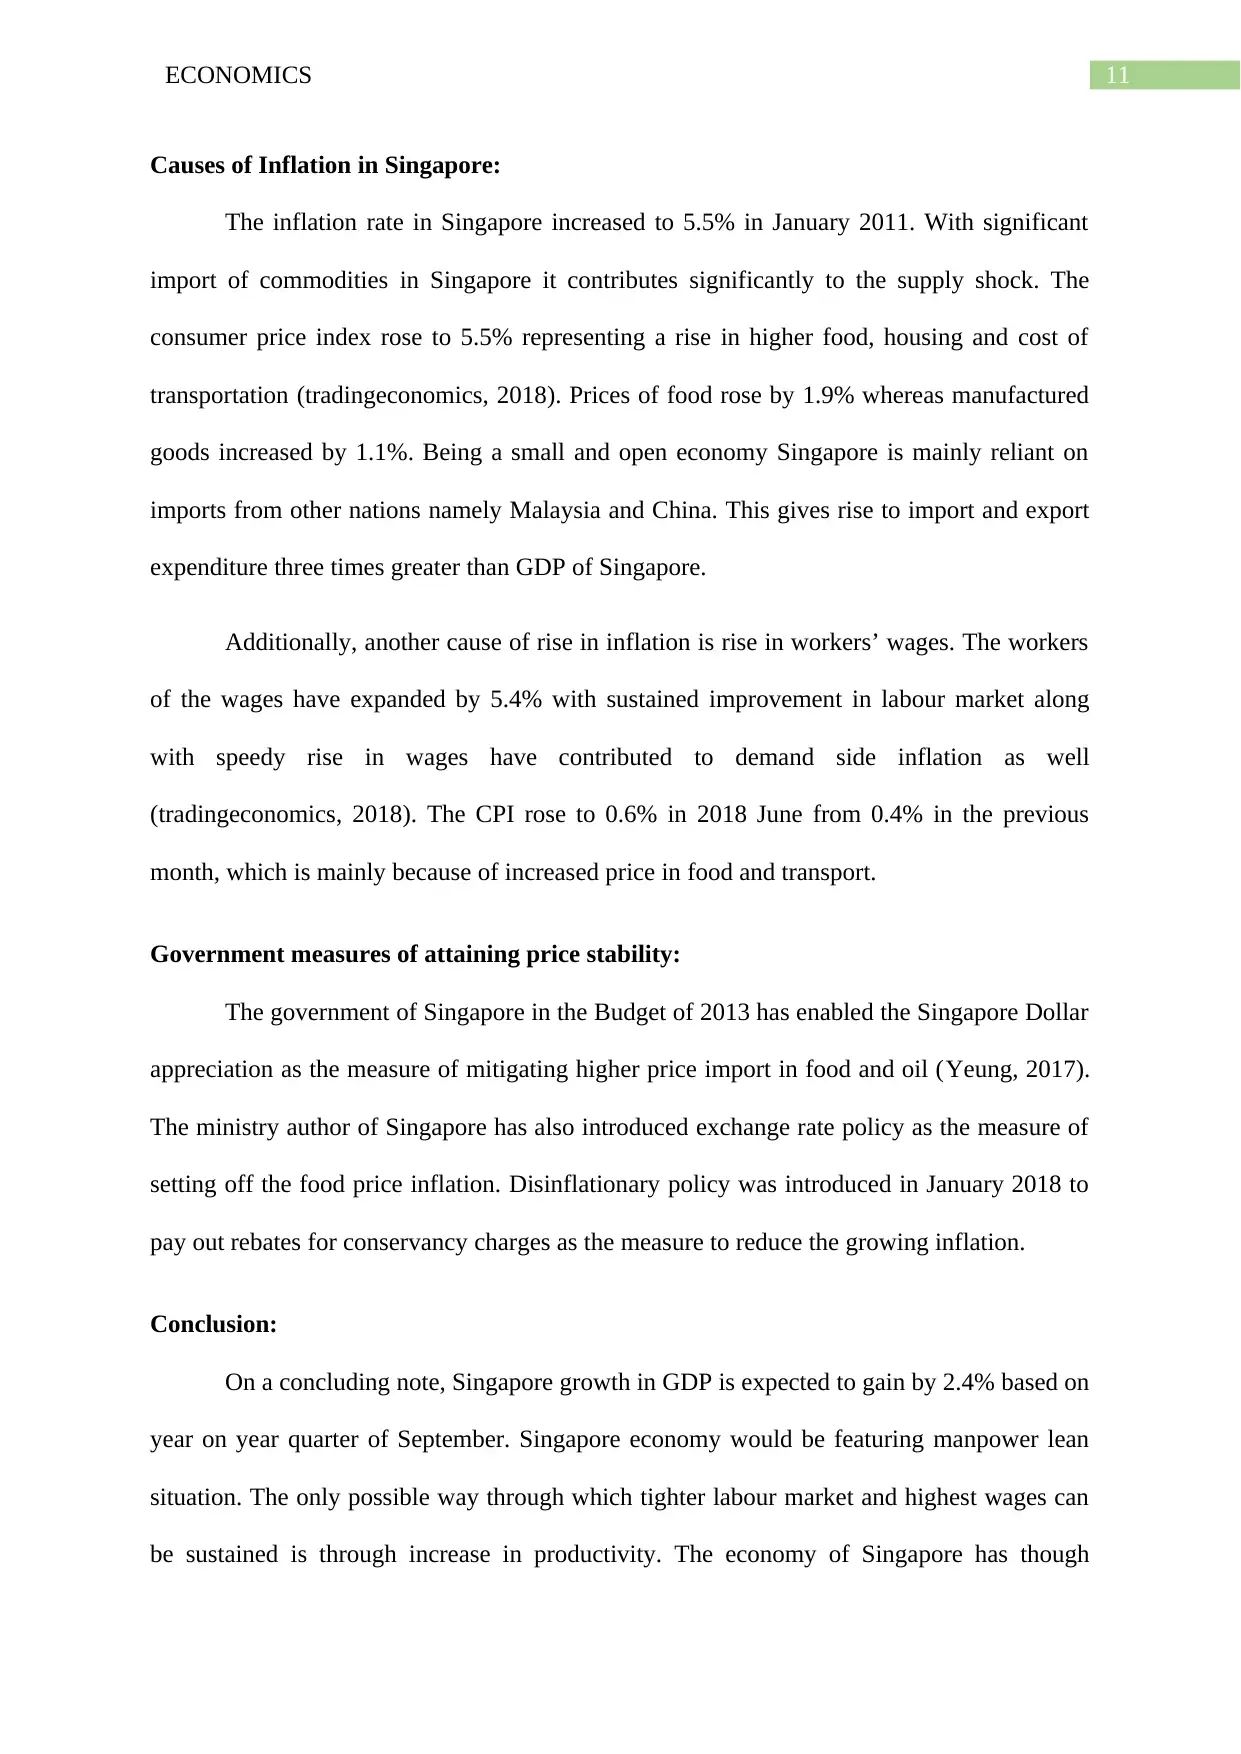
Cost push inflation generally occurs from the rise in input costs. The main reasons for
increase in the product costs is rise in wage and rise price of raw materials (Robinson &
Choy, 2016). Therefore, a rise in wages give rise to high production costs and ultimately
contributes to increase in price of commodity.
Figure 7: Figure showing Cost – Pull Inflation
(Source: As Created by Author)
Figure 6: Figure showing Demand – Pull Inflation
(Source: As Created by Author)
Cost push inflation generally occurs from the rise in input costs. The main reasons for
increase in the product costs is rise in wage and rise price of raw materials (Robinson &
Choy, 2016). Therefore, a rise in wages give rise to high production costs and ultimately
contributes to increase in price of commodity.
Figure 7: Figure showing Cost – Pull Inflation
(Source: As Created by Author)
11ECONOMICS
Causes of Inflation in Singapore:
The inflation rate in Singapore increased to 5.5% in January 2011. With significant
import of commodities in Singapore it contributes significantly to the supply shock. The
consumer price index rose to 5.5% representing a rise in higher food, housing and cost of
transportation (tradingeconomics, 2018). Prices of food rose by 1.9% whereas manufactured
goods increased by 1.1%. Being a small and open economy Singapore is mainly reliant on
imports from other nations namely Malaysia and China. This gives rise to import and export
expenditure three times greater than GDP of Singapore.
Additionally, another cause of rise in inflation is rise in workers’ wages. The workers
of the wages have expanded by 5.4% with sustained improvement in labour market along
with speedy rise in wages have contributed to demand side inflation as well
(tradingeconomics, 2018). The CPI rose to 0.6% in 2018 June from 0.4% in the previous
month, which is mainly because of increased price in food and transport.
Government measures of attaining price stability:
The government of Singapore in the Budget of 2013 has enabled the Singapore Dollar
appreciation as the measure of mitigating higher price import in food and oil (Yeung, 2017).
The ministry author of Singapore has also introduced exchange rate policy as the measure of
setting off the food price inflation. Disinflationary policy was introduced in January 2018 to
pay out rebates for conservancy charges as the measure to reduce the growing inflation.
Conclusion:
On a concluding note, Singapore growth in GDP is expected to gain by 2.4% based on
year on year quarter of September. Singapore economy would be featuring manpower lean
situation. The only possible way through which tighter labour market and highest wages can
be sustained is through increase in productivity. The economy of Singapore has though
⊘ This is a preview!⊘
Do you want full access?
Subscribe today to unlock all pages.
Trusted by 1+ million students worldwide
1 out of 15
Related Documents


Your All-in-One AI-Powered Toolkit for Academic Success.
+13062052269
info@desklib.com
Available 24*7 on WhatsApp / Email
![[object Object]](/_next/static/media/star-bottom.7253800d.svg)
Unlock your academic potential
Copyright © 2020–2026 A2Z Services. All Rights Reserved. Developed and managed by ZUCOL.