Analysis of Australia's Macroeconomic Production, Output, and Price
VerifiedAdded on 2022/10/12
|14
|3213
|250
Report
AI Summary
This report provides a detailed analysis of Australia's macroeconomic factors. It begins with an introduction to the Australian economy, highlighting the dominance of the service sector and the contributions of agriculture and manufacturing. The report then delves into the analysis of production output performance, focusing on Real GDP and its growth trends, including the impact of the 2008/09 recession and long-term productivity growth. It also examines the labor market, including unemployment rates, participation rates, and various types of unemployment such as cyclical, structural, and frictional unemployment. The report also explores government labor initiatives aimed at addressing unemployment. Finally, the report analyzes price levels in Australia, focusing on inflation, its causes (demand-pull, cost-push, and built-in inflation), and the inflation rate trend over the past decade. The report uses data and figures to support its analysis, offering a comprehensive overview of the Australian economy's key macroeconomic indicators.
Running head: ANALYSIS OF AUSTRALIA’S MACROECONOMIC FACTORS 1
ANALYSIS OF AUSTRALIA’S MACROECONOMIC FACTORS: PRODUCTION OUTPUT
PERFORMANCE, UNEMPLOYMENT, INFLATION AND PRICE
Student’s Name:
Student’s Affiliation:
ANALYSIS OF AUSTRALIA’S MACROECONOMIC FACTORS: PRODUCTION OUTPUT
PERFORMANCE, UNEMPLOYMENT, INFLATION AND PRICE
Student’s Name:
Student’s Affiliation:
Paraphrase This Document
Need a fresh take? Get an instant paraphrase of this document with our AI Paraphraser
ANALYSIS OF AUSTRALIA’S MACROECONOMIC FACTORS 2
Analysis of Australia’s Macroeconomic Factors: Production Output Performance,
Unemployment, Inflation and Price
Introduction
The service sector of Australia has dominated the economy of Australia constituting of
over 70% of the Gross Domestic Product. Whereas the economic growth is mainly reliant on the
sector of agriculture which comprises 3 percent of the GDP at the farm, and 12% if the value
addition through processing is done beyond the farm (Holton, 2013). The manufacturing
industry, on the other hand, currently contributes to 6% of the country's GDP exporting AUD$96
billion worth of goods. The country is dotted with wine products, agricultural products, minerals,
education-related services, and recreational travel services (Holton, 2013). The top exports of
Australia include iron ore and concentrate, gold, coal, natural gases, and education-related
services. According to Garnaut (2011), the top Australian imports are freight transport, Telco
parts, refined petroleum, cars, and personal travel/tourism. Some of the large companies of
Australia are Commonwealth Bank, Wesfarmers, Telstra, BHP Billiton, and Tinto Group.
Australia's economy, as of 2015, with a GDP of 1.62 trillion Australian Dollars, is one of the
world’s major economies, which are mixed market (Garnaut, 2011). In the past decade, the total
wealth of Australia has amounted to 6.4 trillion Australian Dollars. In 2012, by nominal GDP it
was the twelfth major national economy and measured by PPP-adjusted GDP, it was the
seventeenth-largest national economy, approximately 1.7% of the economy of the world.
Analysis of Australia’s Production Output Performance
The real GDP is a measurement that has been attuned to the inflation rate of a country
hence reflecting the worth of all services and goods produced by the economy of the country in a
ANALYSIS OF AUSTRALIA’S MACROECONOMIC FACTORS 3
given year, stated in the prices of the base year and is frequently regarded to as the “constant
dollar” GDP, “inflation-corrected GDP” or “constant price” GDP (Macdonald, 2010). Real GDP
accounts for the changes in the level of price and offers a more accurate figure of the growth in
the economy.
Computing Real GDP
Real GDP is obtained as nominal GDP divided by a deflator (R):
Nominal GDP = Real GDP
R
GDP Deflator (R) = Nominal GDP * 100
Real GDP
The deflator (R) is the inflation measurement since the base year; apportioning the
nominal GDP number by the deflator eradicates the inflation effects. A large deviation between
the nominal and real GDP shows the substantial inflation or deflation in its economy concerning
the deflator’s base year.
Australia’s Real GDP
Following a 2.1% economy increase in the past ten years, the real GDP of Australia has
grown by 2.9% as to per the latest figures of the national account which were released by the
Australian Bureau of Statistics. Australia has entered its 11th consecutive economic growth year,
and according to International Monetary Fund (IMF) World Economic Outlook April 2018
(IMF, 2019), its production trend has been predicted to outperform every other major advanced
economy. From 2008-09 to 2017-18 the economy of Australia grew by annually by an average
rate of 3.2% in real terms and is now deep into its 11th year of uninterrupted economic growth
annually, a record which has been unequaled by another developed country over this period
(Macdonald, 2010). Below are the ten financial years of real GDP growth from 2009 to 2018.
⊘ This is a preview!⊘
Do you want full access?
Subscribe today to unlock all pages.
Trusted by 1+ million students worldwide
ANALYSIS OF AUSTRALIA’S MACROECONOMIC FACTORS 4
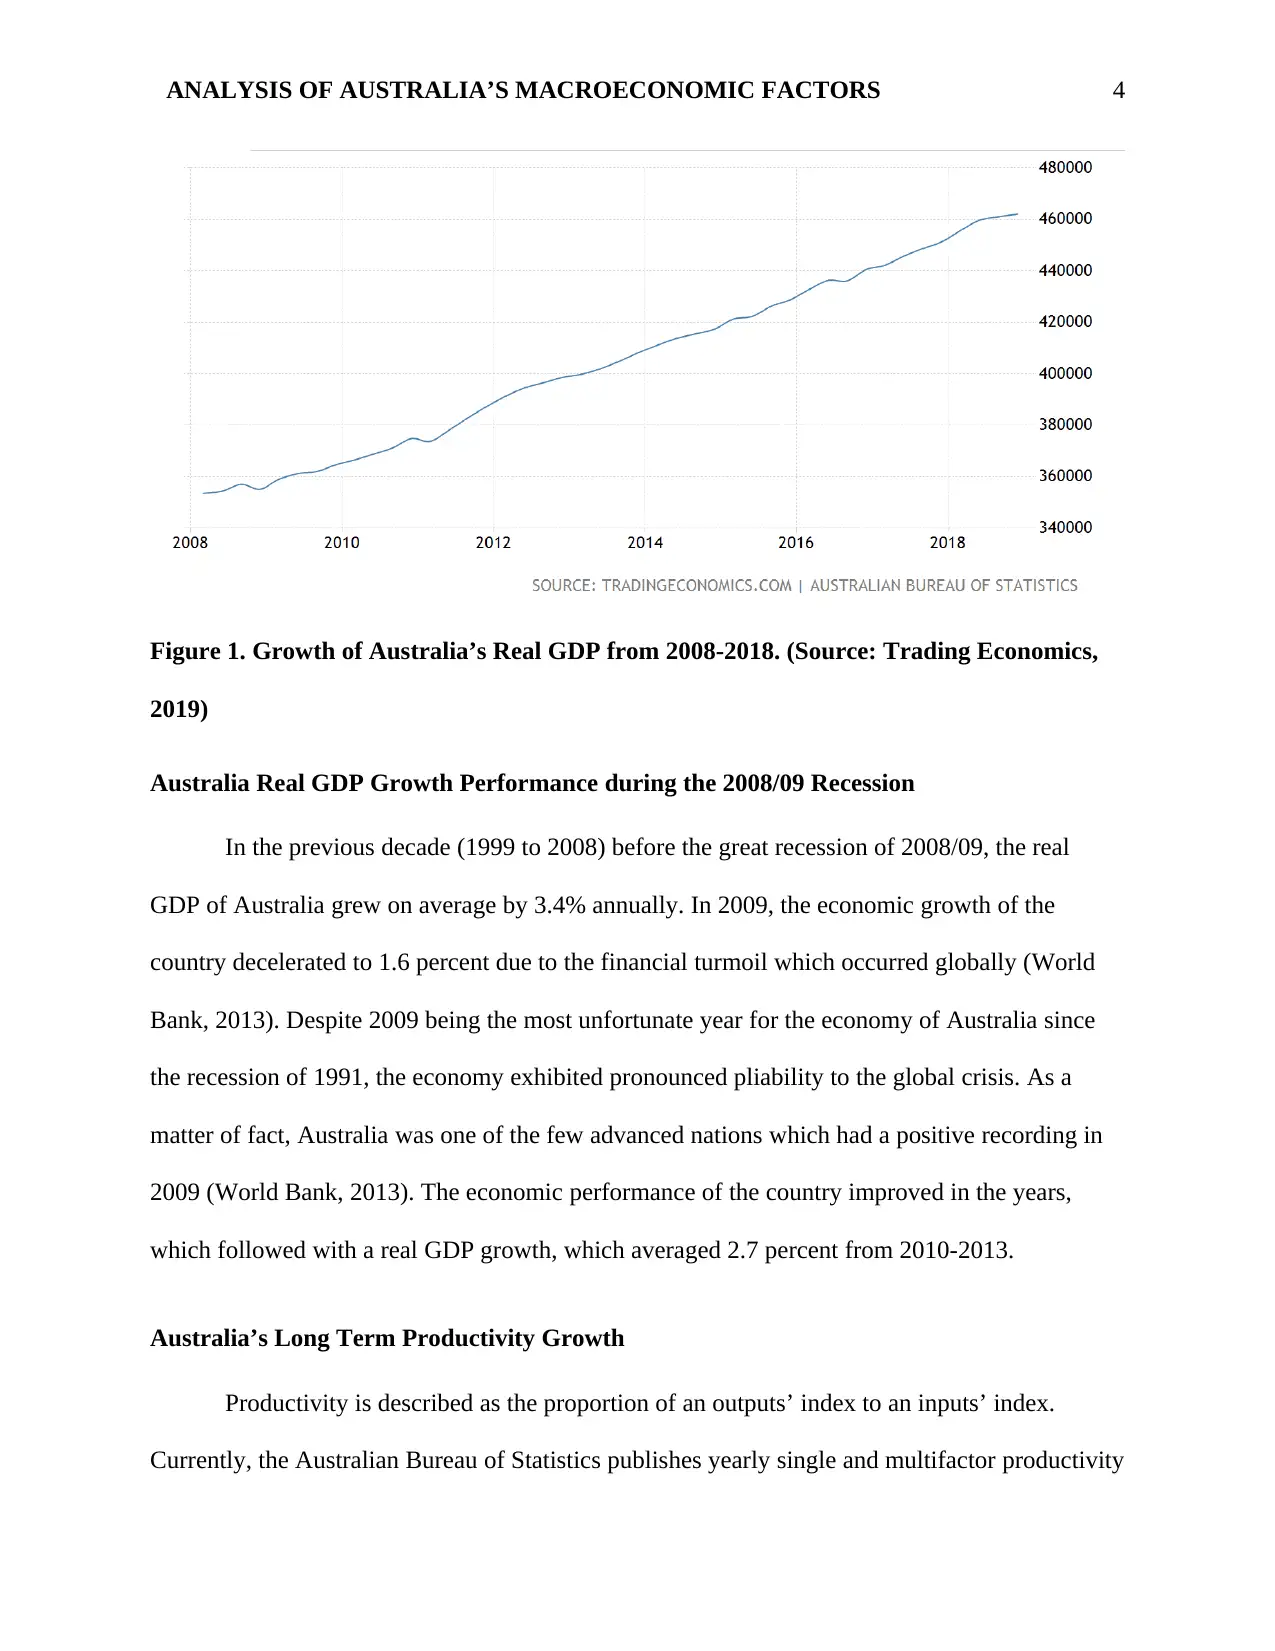
Figure 1. Growth of Australia’s Real GDP from 2008-2018. (Source: Trading Economics,
2019)
Australia Real GDP Growth Performance during the 2008/09 Recession
In the previous decade (1999 to 2008) before the great recession of 2008/09, the real
GDP of Australia grew on average by 3.4% annually. In 2009, the economic growth of the
country decelerated to 1.6 percent due to the financial turmoil which occurred globally (World
Bank, 2013). Despite 2009 being the most unfortunate year for the economy of Australia since
the recession of 1991, the economy exhibited pronounced pliability to the global crisis. As a
matter of fact, Australia was one of the few advanced nations which had a positive recording in
2009 (World Bank, 2013). The economic performance of the country improved in the years,
which followed with a real GDP growth, which averaged 2.7 percent from 2010-2013.
Australia’s Long Term Productivity Growth
Productivity is described as the proportion of an outputs’ index to an inputs’ index.
Currently, the Australian Bureau of Statistics publishes yearly single and multifactor productivity
Paraphrase This Document
Need a fresh take? Get an instant paraphrase of this document with our AI Paraphraser
ANALYSIS OF AUSTRALIA’S MACROECONOMIC FACTORS 5
growth estimates. The ABS publications of the multifactor and single estimates of productivity
growth are for the Australian economy’s market sector. The Government of Australia uses a
number of measures of productivity.
Investment in Physical Capital
Labor productivity growth (Y/L) is impacted by the proportion of growth in the capital to
labor (K/L) and the MFP rate of growth. Capital deepening or increases in (K/L) tend to enhance
the productivity of labor since capital productivity is slow to change relatively (Trading
Economics, 2019).
Investment in Research and Development
The government of Australia has developed models in which the technological growth
rate progress depends on the quantity of resources (labor and capital) and the existing technology
level devoted to the production of new inventions and ideas (Bishop, Kent, Plumb, & Rayner,
2013). Under specific conditions, these models imply that an increment in the fraction of
Australia's resources devoted to R&D will increase the MFP growth rate, consequently output
per capita growth rate.
Investment in Human Capital
Accumulation of human capital is an essential factor in the productivity rate of growth.
Basu and Drew (2010) present proof that human capital variations are significant in determining
the cross-country differences in income per capita. People can attain human capital by two
essential means: by on-the-job training and through formal schooling. While both are essential, it
ANALYSIS OF AUSTRALIA’S MACROECONOMIC FACTORS 6
is the former which appears to most likely explain the persistently high rates of growth in
productivity and income.
Australia’s Labor Market Analysis
Unemployment
Structural and frictional unemployment are types of unemployment which occur when
the economy is perfectly normal. The phrase of the natural unemployment rate is used to denote
to the rate of unemployment, which happens in an economy functioning normally. Cyclical
unemployment, on the other hand, is, is higher at the trough of a business cycle than normal
unemployment and lower at the peak of a business cycle than normal unemployment. The
participation rate of the labor force also decreases when people who are available for work or
discouraged workers stop making efforts of seeking jobs after seeking for jobs for a long time.
How to Calculate the Natural Rate of Unemployment
The total rate of unemployment is computed by dividing the overall number of
unemployed people (U) by the whole number of people in the labor force (LF)
Unemployed People = Total unemployment
Labor Force
To compute the natural rate, first, add the number of those who are structurally unemployed (SU)
to the number of frictionally unemployed (FU) then divide by the total labor force.
(Frictionally Unemployed + Structurally Unemployed) = Natural rate of unemployment
Labor Force
Labor Force Participation rate= Unemployed and Employed Labor Force
Population
⊘ This is a preview!⊘
Do you want full access?
Subscribe today to unlock all pages.
Trusted by 1+ million students worldwide
ANALYSIS OF AUSTRALIA’S MACROECONOMIC FACTORS 7
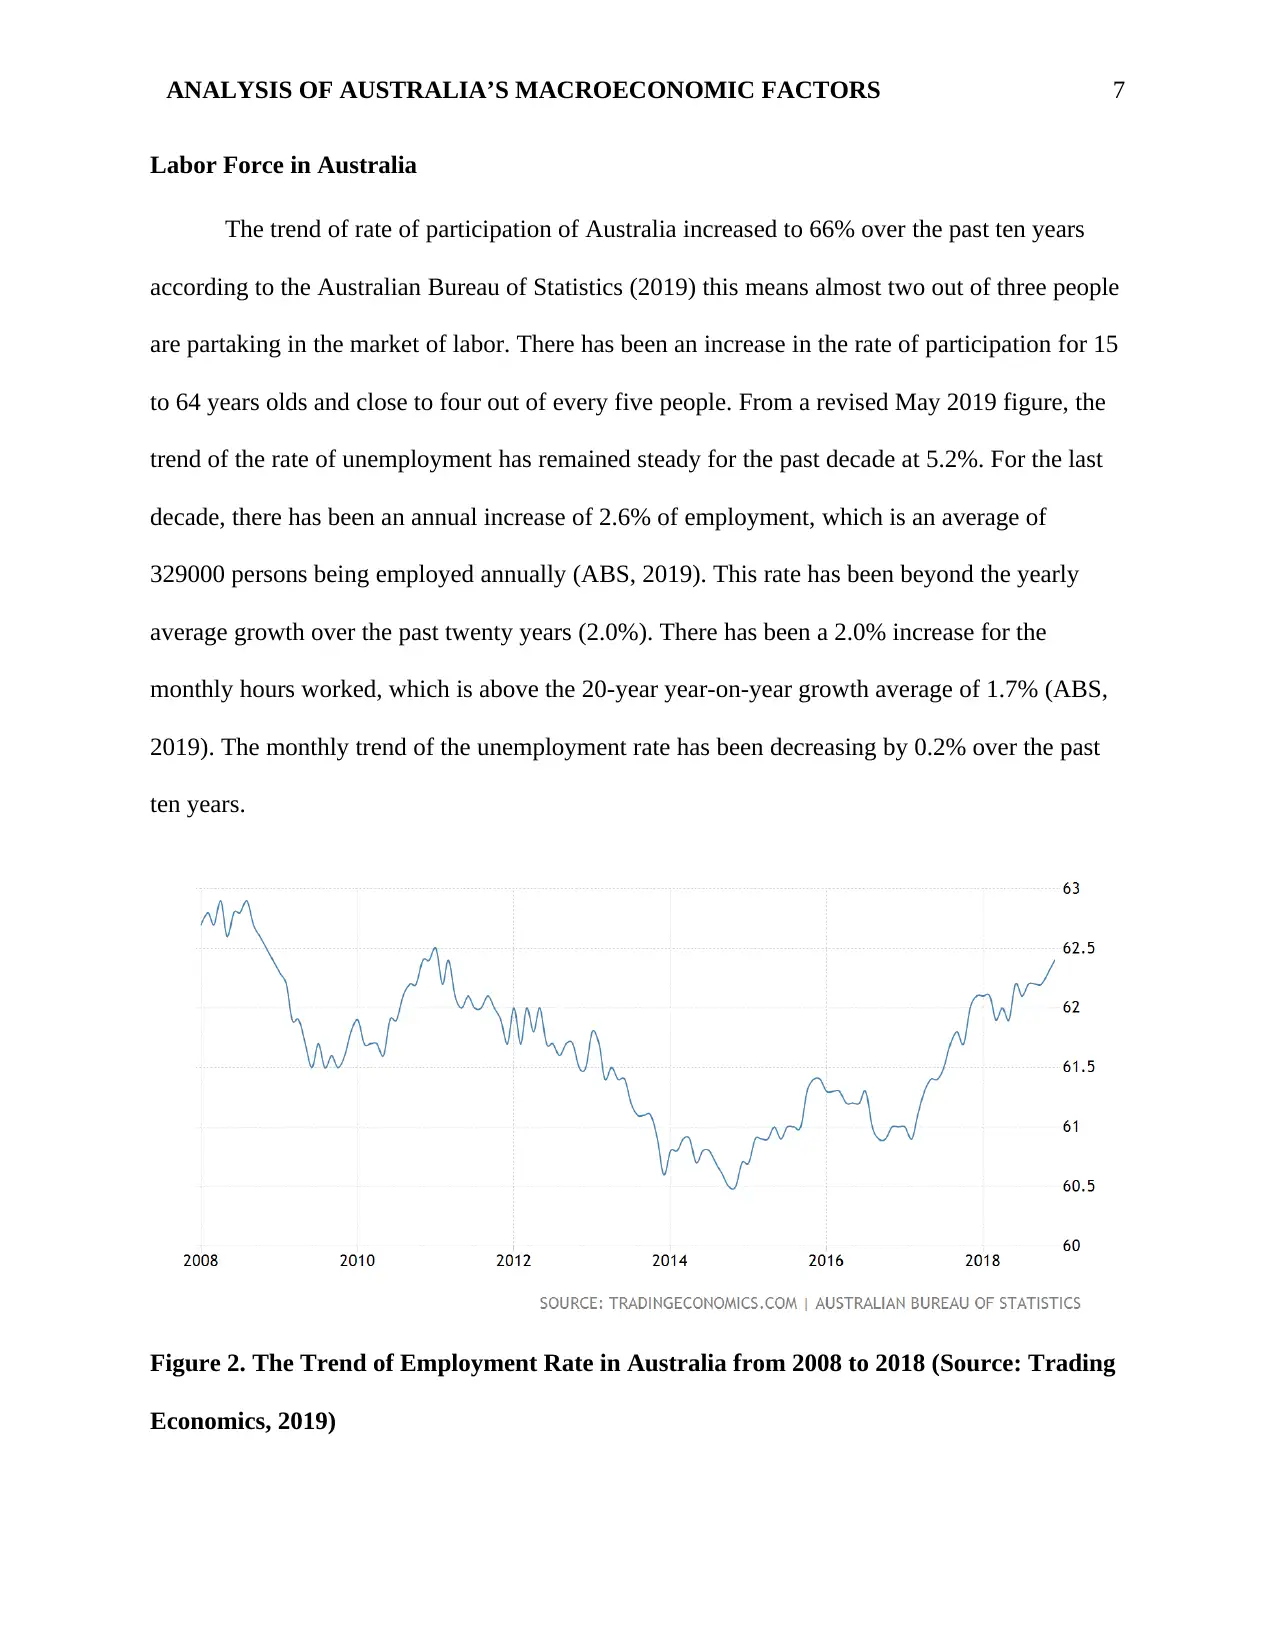
Labor Force in Australia
The trend of rate of participation of Australia increased to 66% over the past ten years
according to the Australian Bureau of Statistics (2019) this means almost two out of three people
are partaking in the market of labor. There has been an increase in the rate of participation for 15
to 64 years olds and close to four out of every five people. From a revised May 2019 figure, the
trend of the rate of unemployment has remained steady for the past decade at 5.2%. For the last
decade, there has been an annual increase of 2.6% of employment, which is an average of
329000 persons being employed annually (ABS, 2019). This rate has been beyond the yearly
average growth over the past twenty years (2.0%). There has been a 2.0% increase for the
monthly hours worked, which is above the 20-year year-on-year growth average of 1.7% (ABS,
2019). The monthly trend of the unemployment rate has been decreasing by 0.2% over the past
ten years.
Figure 2. The Trend of Employment Rate in Australia from 2008 to 2018 (Source: Trading
Economics, 2019)
Paraphrase This Document
Need a fresh take? Get an instant paraphrase of this document with our AI Paraphraser
ANALYSIS OF AUSTRALIA’S MACROECONOMIC FACTORS 8
Types of Unemployment in Australia
Cyclical Unemployment
Australia experiences cyclical unemployment throughout business cycles. Instances are
like the unemployment rate sharply rising with the early 1990s recession and by mid-2000s
decreasing to low levels before increasing again around the global financial crisis (Carvalho,
2015). An increment in cyclical unemployment may imply the economy is operating below its
potential.
Structural Unemployment
Instances of structural unemployment in the recent decades have been noticeable in a
decrease in the number of people employed in mundane manual jobs with some of the jobs
becoming automated due to technological advancements (Carvalho, 2015). Australian's
manufacturing industry is an example of an industry whose size in the Australian economy has
decreased due to the automation of jobs.
Frictional Unemployment
This occurs when people move between jobs in the labor market as well as transitioning
out and into the labor force (Carvalho, 2015). This type of unemployment enables the
achievement of efficient allocation of labor across the Australian economy. It tends to be shorter
(less than a month).
Underemployment
This is whereby the employed people would like or are available to work more hours. In
Australia, it is higher generally among the female older and younger workers.
ANALYSIS OF AUSTRALIA’S MACROECONOMIC FACTORS 9
Hidden Unemployment
This happens when individuals are not counted as unemployed in the formal labor market
statistics of ABS, yet would work probably should they be given a chance (Ezzy, 2017).
Seasonal Unemployment
This occurs at varied points in a year due to the seasonal patterns which influence jobs.
Some instances are holiday-related jobs, fruit pickers, and ski instructors.
Australian Government Labor Initiatives
The Australian government has adopted several policies to tackle unemployment over the
past decade. Assistance to the unemployed via active labor market programs (ALMPs) is the
most common practice of the government’s response to unemployment (Carvalho, 2015).
Primarily this program seeks to increase the participation of employment of people receiving the
government's income support or are at a risk of ending up unemployed. As part of the federal
budgets of the Australian Government, the government reduced emphasizing on the participation
in Work for the Dole (Ezzy, 2017). This strategy tackling unemployment is broadly consistent
with both investment and evidence-based approaches to social welfare. The government also
introduced the Youth Jobs PaTH program, which is aimed to offer adequate assistance to job
seekers in producing meaningful results.
Price Level Analysis in Australia
Inflation
Inflation is the quantifiable extent of the rate at which the average level of price of a
basket of selected services and goods in an economy rises over time. It the rising of general price
⊘ This is a preview!⊘
Do you want full access?
Subscribe today to unlock all pages.
Trusted by 1+ million students worldwide
ANALYSIS OF AUSTRALIA’S MACROECONOMIC FACTORS 10
levels constantly where a currency unit purchases less than it did in previous periods.
Mathematically it is calculated as follows:
Increase in Inflation = Final Index Value of CPI
Initial Index Value of CPI
Causes of Inflation
Demand-Pull Effect
This happens when the total demand for services and goods in an economy rises more
speedily than the capacity of production of the economy. This results in a demand-supply gap
with a lower supply and higher demand resulting in higher prices.
Cost-Push Effect
This is due to a growth in the inputs’ prices of the production process. Consequently
leading to higher costs for the complete service or product and contributing to inflation.
Built-In Inflation
This type of inflation is associated with adaptive prospects. As the prices of services and
goods increases, labor demands and expects more earnings to sustain their living costs; hence
their increased incomes lead to higher costs of services and goods.
Inflation Rate Trend in Australia
Over the past decade, the inflation rate of Australia has been rising gradually, hitting
1.6% by June 2019 from a 2-1/1-year low of 1.3 percent in 2018. The latest reading of CPI was
above 1.5 percent, which is the market consensus, as food inflation in five years hits its highest
while the prices of transport have been picking up strongly. Year-on-year, non-alcoholic
Paraphrase This Document
Need a fresh take? Get an instant paraphrase of this document with our AI Paraphraser
ANALYSIS OF AUSTRALIA’S MACROECONOMIC FACTORS 11
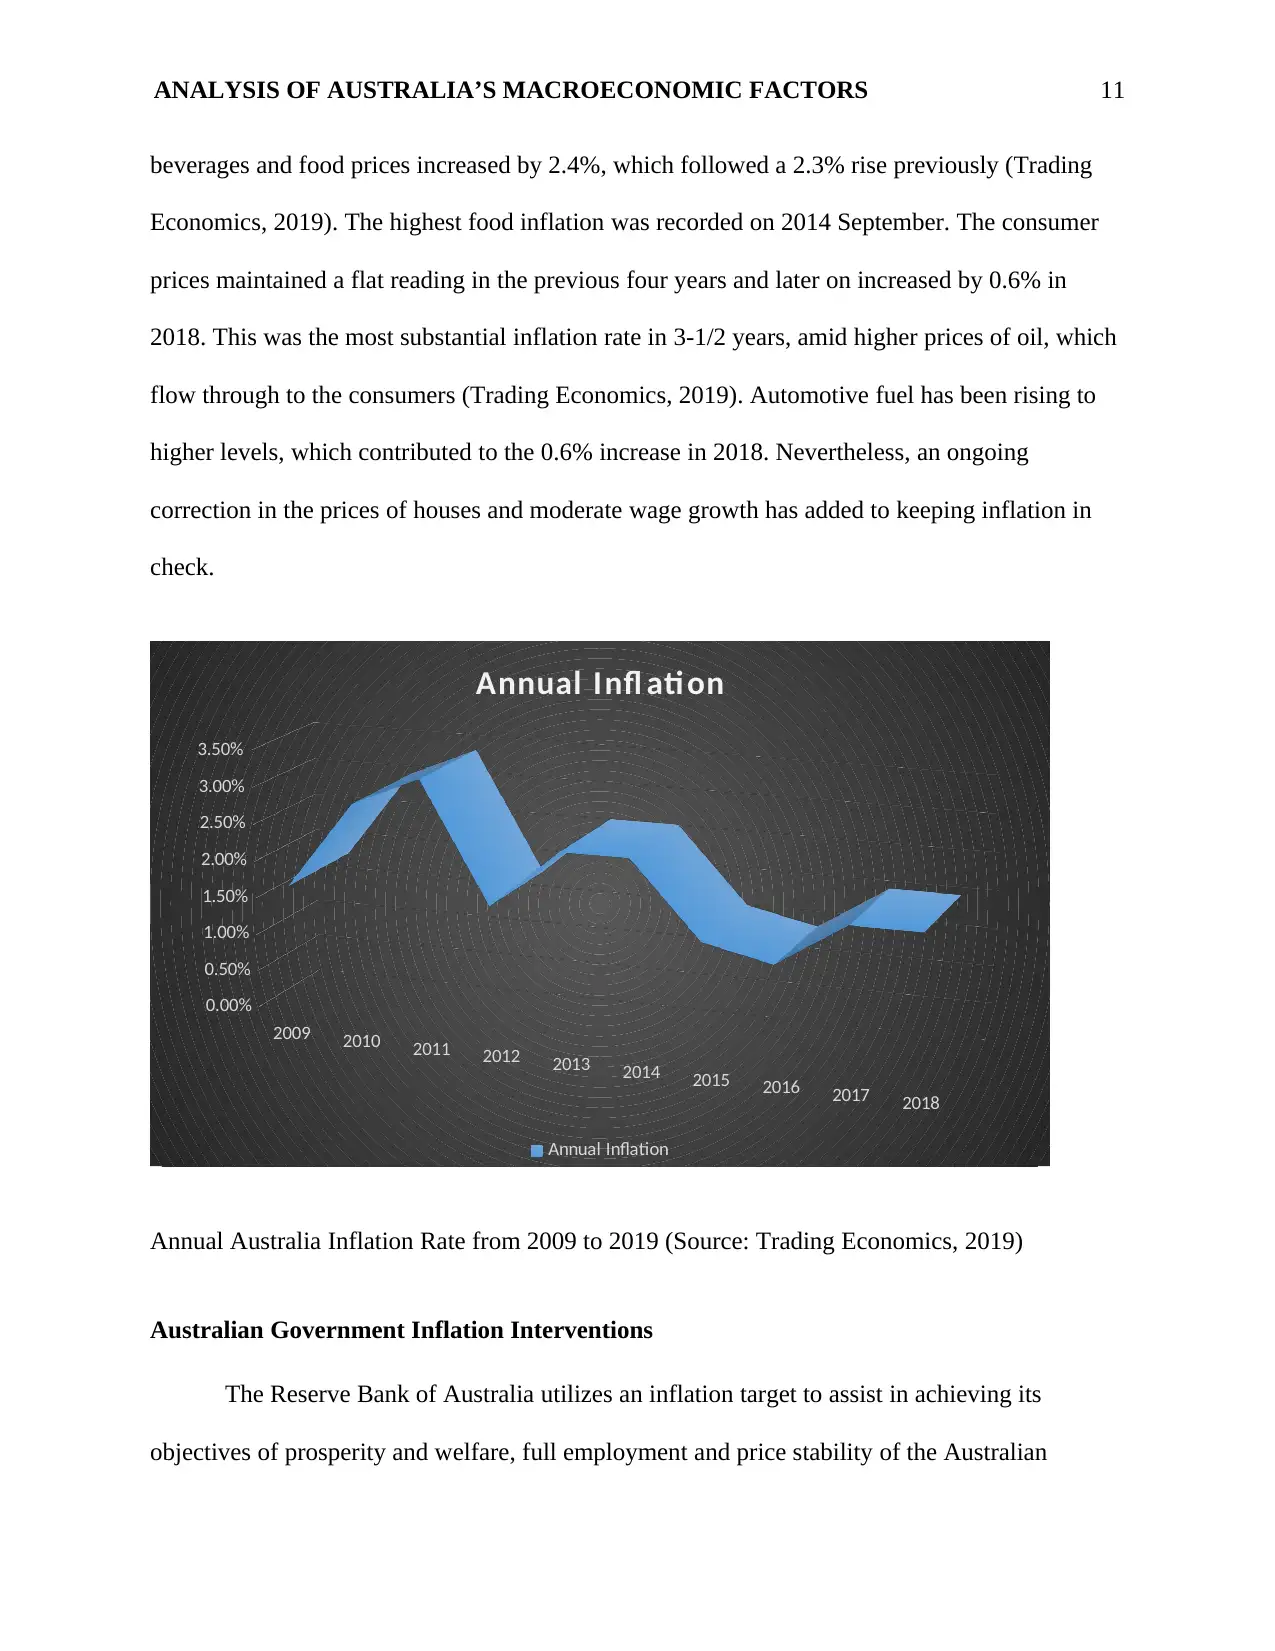
beverages and food prices increased by 2.4%, which followed a 2.3% rise previously (Trading
Economics, 2019). The highest food inflation was recorded on 2014 September. The consumer
prices maintained a flat reading in the previous four years and later on increased by 0.6% in
2018. This was the most substantial inflation rate in 3-1/2 years, amid higher prices of oil, which
flow through to the consumers (Trading Economics, 2019). Automotive fuel has been rising to
higher levels, which contributed to the 0.6% increase in 2018. Nevertheless, an ongoing
correction in the prices of houses and moderate wage growth has added to keeping inflation in
check.
2009 2010 2011 2012 2013 2014 2015 2016 2017 2018
0.00%
0.50%
1.00%
1.50%
2.00%
2.50%
3.00%
3.50%
Annual Infl ati on
Annual Inflation
Annual Australia Inflation Rate from 2009 to 2019 (Source: Trading Economics, 2019)
Australian Government Inflation Interventions
The Reserve Bank of Australia utilizes an inflation target to assist in achieving its
objectives of prosperity and welfare, full employment and price stability of the Australian
ANALYSIS OF AUSTRALIA’S MACROECONOMIC FACTORS 12
people. Targeting inflation of two to three percent avoids the numerous costs inflation poses on
the economy. The Australian monetary policy aims at keeping the inflation between 2-3%.
Assessment of the expected and current inflation rate against the inflation target assists the
Reserve Bank in creating decisions of monetary policy. The rate of cash is then utilized to
stimulate or dampen the economic activities so that inflation and the target are consistent.
Conclusion
Australia’s economy as of 2015, with a GDP of 1.62 trillion Australian Dollars, is one of
the world’s major economies, which mixed market (Garnaut, 2011). The service sector of
Australia has dominated the economy of Australia constituting of over 70 percent of the GDP
employing over 79% of the force of labor. Following a 2.1% economy increase in the past ten
years, the real GDP of Australia has grown by 2.9% as to per the latest figures of the national
account which were released by the Australian Bureau of Statistics. The trend of labor
participation rate of Australia increased to 66% over the past ten years according to the
Australian Bureau of Statistics (2019) this means almost two out of three people are partaking in
the market of labor. Over the past decade, the inflation rate of Australia has been rising
gradually, hitting 1.6% by June 2019 from a 2-1/1-year low of 1.3 percent in 2018. With almost
all Australian’s industries open for competition in the international markets and a freely available
workforce, Australia remains to be a destination that is dynamic and attractive for investment.
⊘ This is a preview!⊘
Do you want full access?
Subscribe today to unlock all pages.
Trusted by 1+ million students worldwide
1 out of 14
Related Documents


Your All-in-One AI-Powered Toolkit for Academic Success.
+13062052269
info@desklib.com
Available 24*7 on WhatsApp / Email
![[object Object]](/_next/static/media/star-bottom.7253800d.svg)
Unlock your academic potential
Copyright © 2020–2026 A2Z Services. All Rights Reserved. Developed and managed by ZUCOL.