Economics Report: Australia's Economic Performance (2008-2018)
VerifiedAdded on 2022/10/19
|14
|2836
|314
Report
AI Summary
This economics report provides a comprehensive analysis of Australia's economic performance from 2008 to 2018, examining key macroeconomic indicators. The report begins with an introduction to Australia's mixed market economy, highlighting its GDP and global economic standing. It then delves into an analysis of output performance, focusing on real GDP, GDP growth rates, and per capita real GDP, with supporting figures and charts. The analysis of the labor market covers unemployment trends, types of unemployment (structural, cyclical, and frictional), and government policies to address unemployment. The report also examines price level performance, including inflation, its causes (demand-pull and cost-push), and the government's measures to maintain stable prices through monetary policy. The report concludes with an overview of the Australian economy's performance during the period, assessing its strengths and weaknesses based on the data and analysis presented.
Running head: ECONOMICS
Economics
Name of the Student
Name of the University
Course ID
Economics
Name of the Student
Name of the University
Course ID
Paraphrase This Document
Need a fresh take? Get an instant paraphrase of this document with our AI Paraphraser
1ECONOMICS
Introduction
Australia belong to a mixed market economic structure. The recorded GDP of
Australia in 2017 was AUD 1.69 trillion. With faster economic growth Australia has become
the nation having largest per capita wealth for adults. Followed by nominal GDP, Australia
possesses 13th largest GDP. When adjusted for purchasing power parity, rank of Australia in
terms of nominal GDP become 20. Globally, the economy holds a significant position for
experiencing a steady growth for a recorded long period. The economy is highly dominated
by service sector. The sector is highest contributor to GDP and employment. Accounted share
of service sector in Australia’s GDP is approximately 61.1 percent while that of its share in
employment is 79.2 percent (Ellem & Tonts, 2018) Besides service agriculture and
manufacturing play a dominating role in Australia. Large reserves of natural resources of
Australia is another important factor making Australia globally significant. Because of access
to various kind of minerals, mining has become one important industries of Australia. Despite
end of mining boom, Australia remain relatively stable and resilient. The essay investigates
Australia’s economic performance for a chosen period ranged from 2008 to 2018. Particular
focus has been given on making an analysis of output performance, labor market performance
and price level performance.
Production output performance analysis
Real GDP
Real GDP refers to a macroeconomic measure for estimating aggregate value of
economy’s output adjusted for change in price level of the economy or inflation rate. The
adjustment is done using a price deflator that transforms money value measured GDP or
nominal GDO into real GDP. GDP is a comprehensive measure of aggregate output. Changes
2ECONOMICS
in GDP due to changes in price level does not reflect changes in actual output. For this, GDP
has to be adjusted in terms of inflation.
Real GDP growth
Growth rate in real GDP refers to the percentage rate at which real GPD of a country
changes from one year to next (Goodwin et al., 2015). As real GDP is an aggregate measure
of economy’s output growth in real GDP reflects the actual economic growth rate.
Per capita real GDP
Per capita real GDP reflects a measure that reflects average production of a country. It
is a useful estimates obtained by dividing aggregate economic output by total population of
the country. The measure of per capita GDP is generally used to make a comparative analysis
of standard of living between two different nations over time.
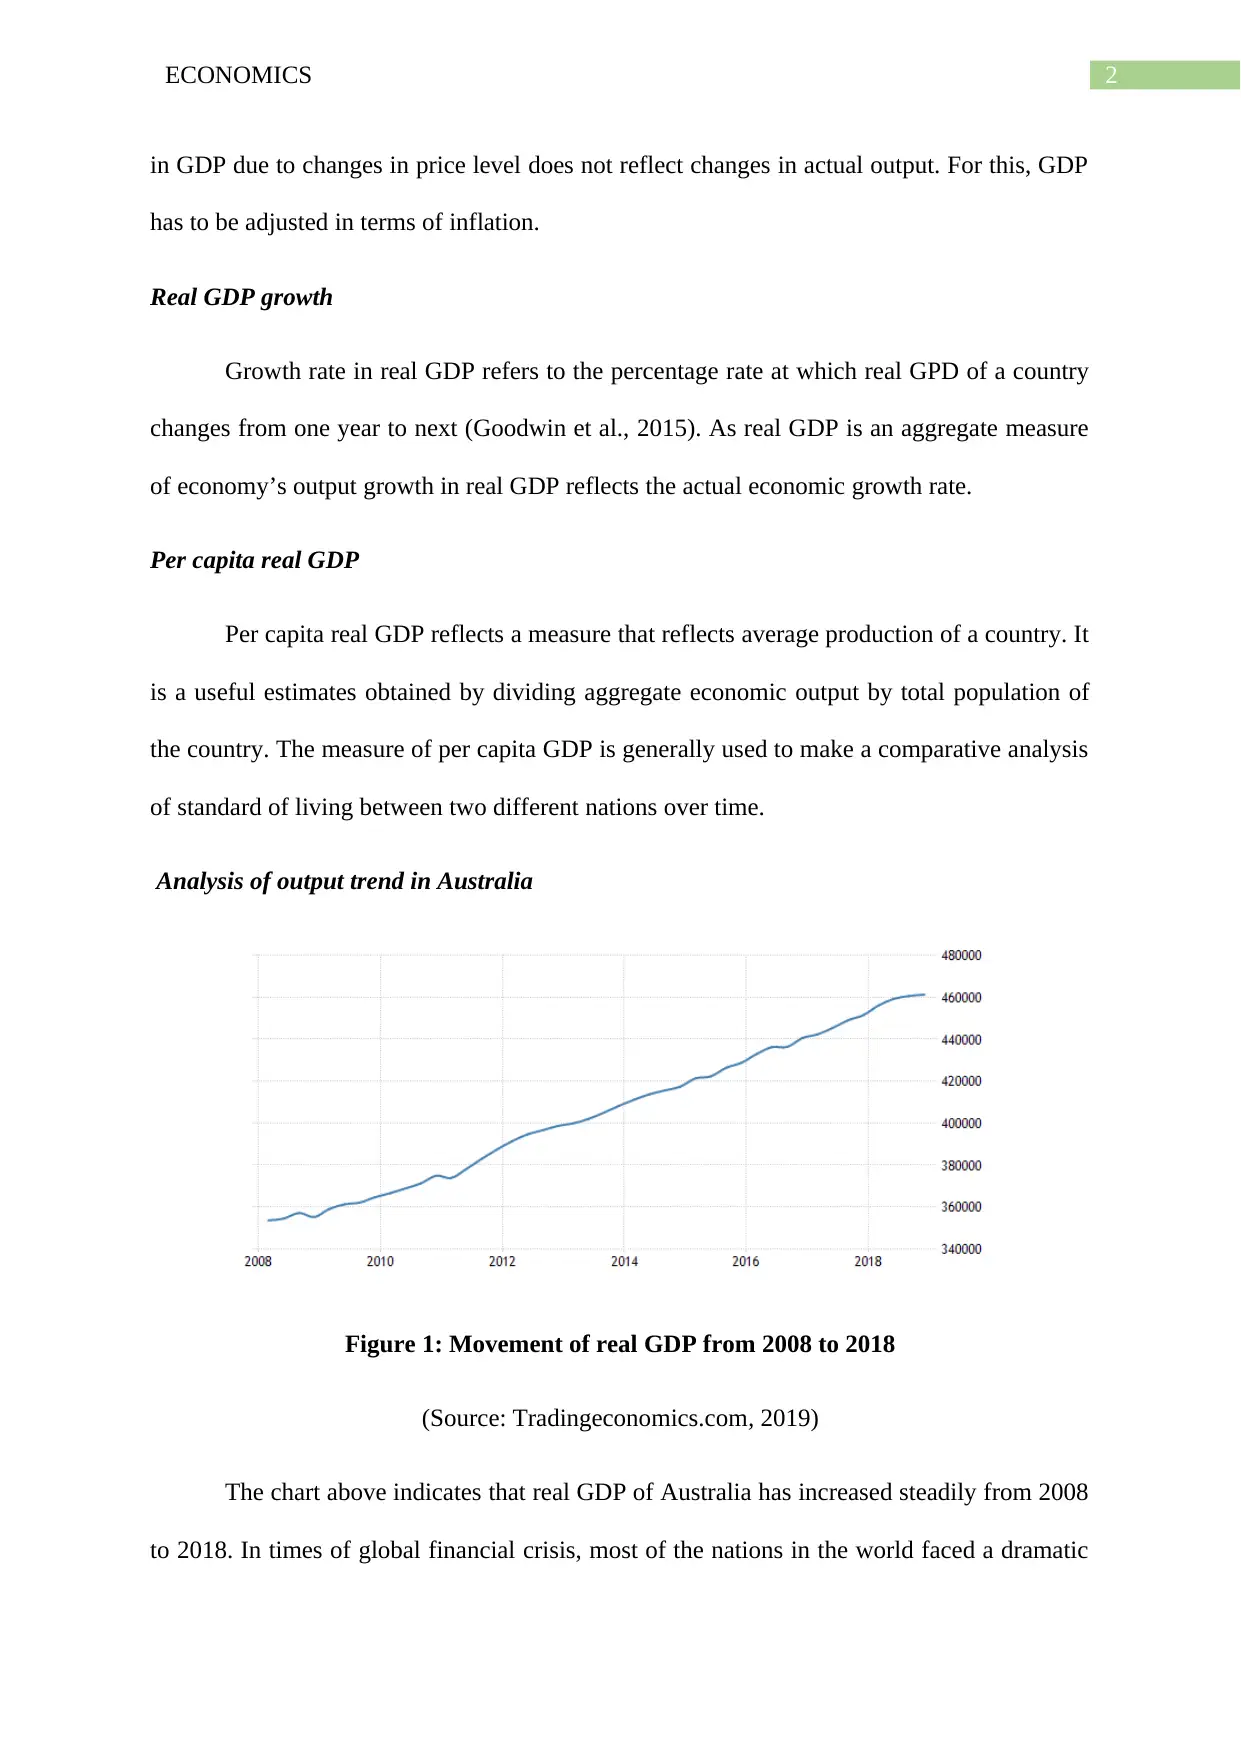
Analysis of output trend in Australia
Figure 1: Movement of real GDP from 2008 to 2018
(Source: Tradingeconomics.com, 2019)
The chart above indicates that real GDP of Australia has increased steadily from 2008
to 2018. In times of global financial crisis, most of the nations in the world faced a dramatic
in GDP due to changes in price level does not reflect changes in actual output. For this, GDP
has to be adjusted in terms of inflation.
Real GDP growth
Growth rate in real GDP refers to the percentage rate at which real GPD of a country
changes from one year to next (Goodwin et al., 2015). As real GDP is an aggregate measure
of economy’s output growth in real GDP reflects the actual economic growth rate.
Per capita real GDP
Per capita real GDP reflects a measure that reflects average production of a country. It
is a useful estimates obtained by dividing aggregate economic output by total population of
the country. The measure of per capita GDP is generally used to make a comparative analysis
of standard of living between two different nations over time.
Analysis of output trend in Australia
Figure 1: Movement of real GDP from 2008 to 2018
(Source: Tradingeconomics.com, 2019)
The chart above indicates that real GDP of Australia has increased steadily from 2008
to 2018. In times of global financial crisis, most of the nations in the world faced a dramatic
⊘ This is a preview!⊘
Do you want full access?
Subscribe today to unlock all pages.
Trusted by 1+ million students worldwide
3ECONOMICS
turmoil in their economic performances and took a considerably long time to overcome the
crisis. The relatively resilient financial sector of Australia protected the economy from this
crisis and the economy recovered at a quick phase. Initially after the financial crisis strong
mining and housing sector supported the economy largely (Rahman, Shahbaz & Farooq,
2015). The mining boom however ended after 2013. The economy still remained resilient due
to steady performance of non-mining industries and service sector.
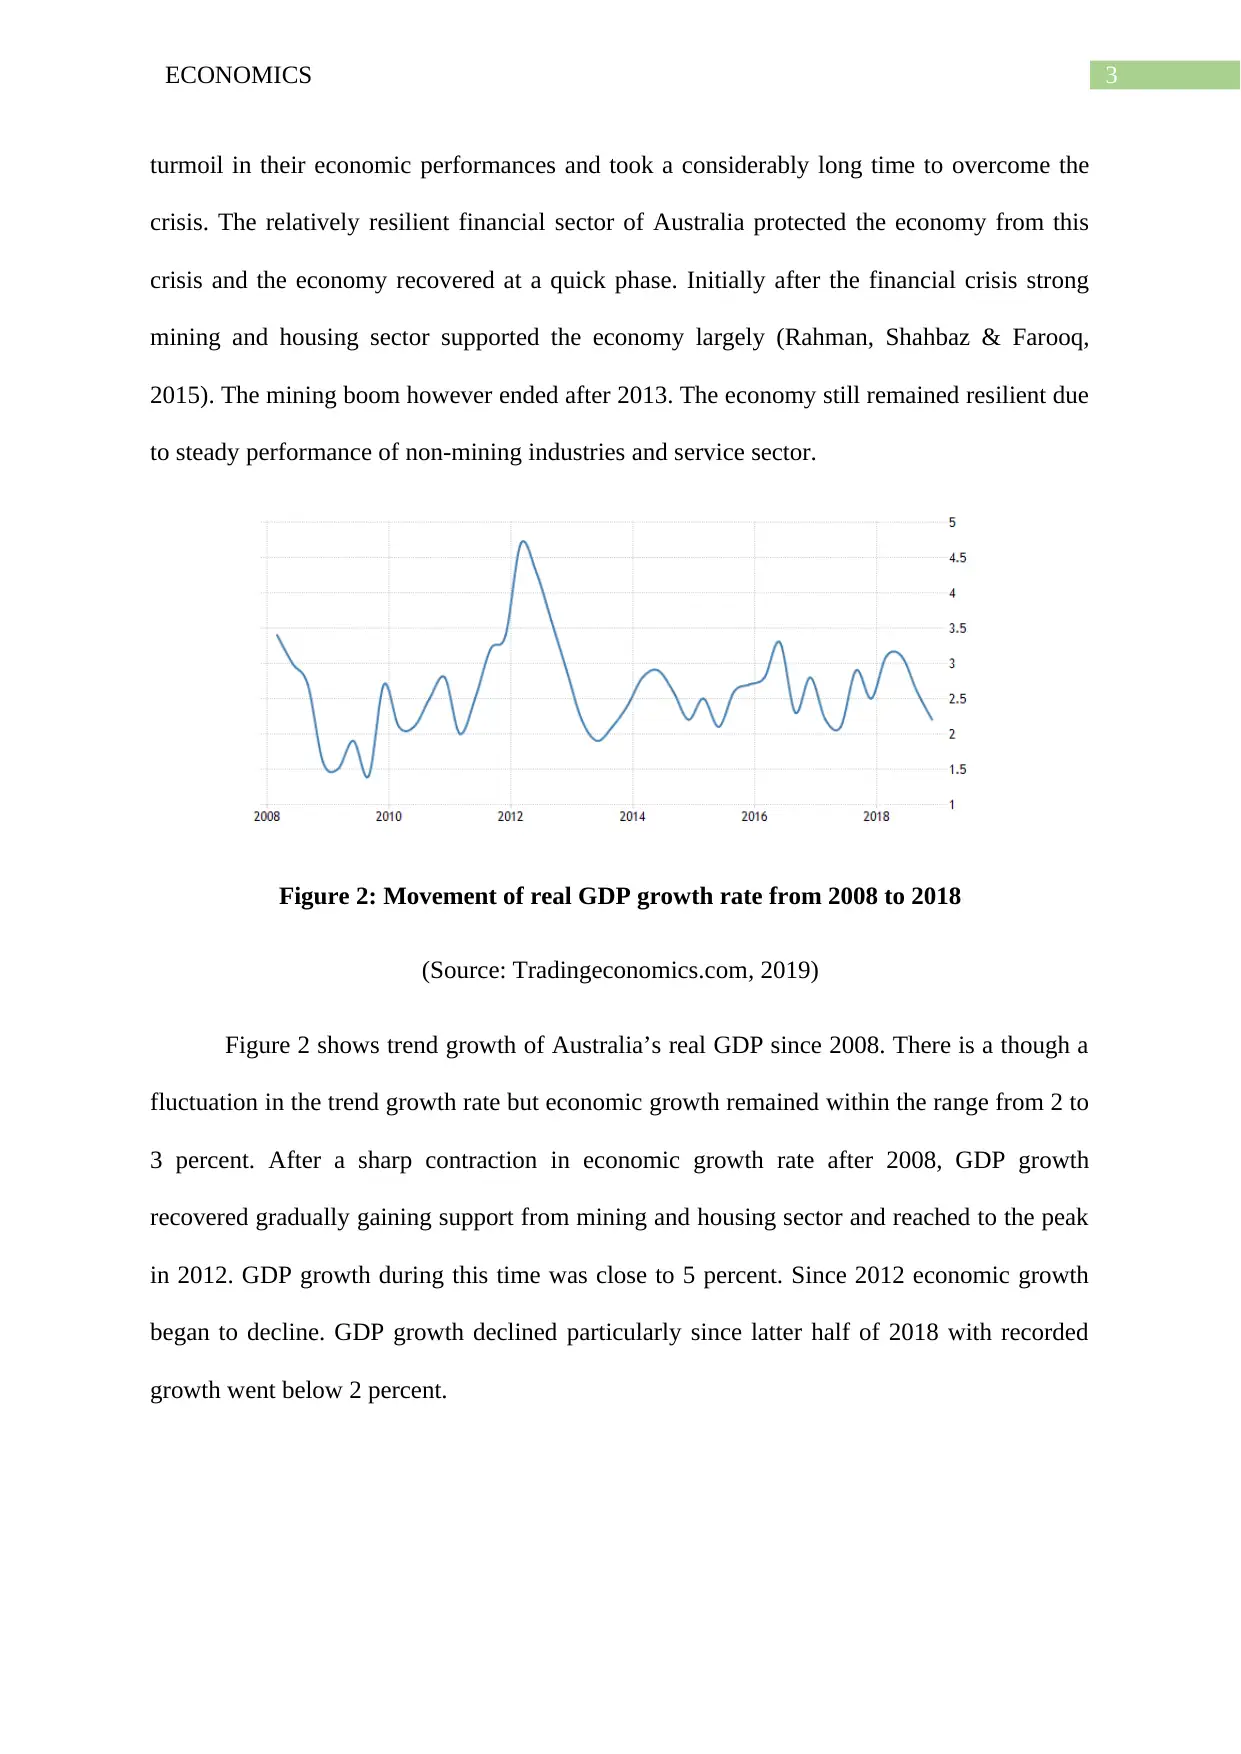
Figure 2: Movement of real GDP growth rate from 2008 to 2018
(Source: Tradingeconomics.com, 2019)
Figure 2 shows trend growth of Australia’s real GDP since 2008. There is a though a
fluctuation in the trend growth rate but economic growth remained within the range from 2 to
3 percent. After a sharp contraction in economic growth rate after 2008, GDP growth
recovered gradually gaining support from mining and housing sector and reached to the peak
in 2012. GDP growth during this time was close to 5 percent. Since 2012 economic growth
began to decline. GDP growth declined particularly since latter half of 2018 with recorded
growth went below 2 percent.
turmoil in their economic performances and took a considerably long time to overcome the
crisis. The relatively resilient financial sector of Australia protected the economy from this
crisis and the economy recovered at a quick phase. Initially after the financial crisis strong
mining and housing sector supported the economy largely (Rahman, Shahbaz & Farooq,
2015). The mining boom however ended after 2013. The economy still remained resilient due
to steady performance of non-mining industries and service sector.
Figure 2: Movement of real GDP growth rate from 2008 to 2018
(Source: Tradingeconomics.com, 2019)
Figure 2 shows trend growth of Australia’s real GDP since 2008. There is a though a
fluctuation in the trend growth rate but economic growth remained within the range from 2 to
3 percent. After a sharp contraction in economic growth rate after 2008, GDP growth
recovered gradually gaining support from mining and housing sector and reached to the peak
in 2012. GDP growth during this time was close to 5 percent. Since 2012 economic growth
began to decline. GDP growth declined particularly since latter half of 2018 with recorded
growth went below 2 percent.
Paraphrase This Document
Need a fresh take? Get an instant paraphrase of this document with our AI Paraphraser
4ECONOMICS
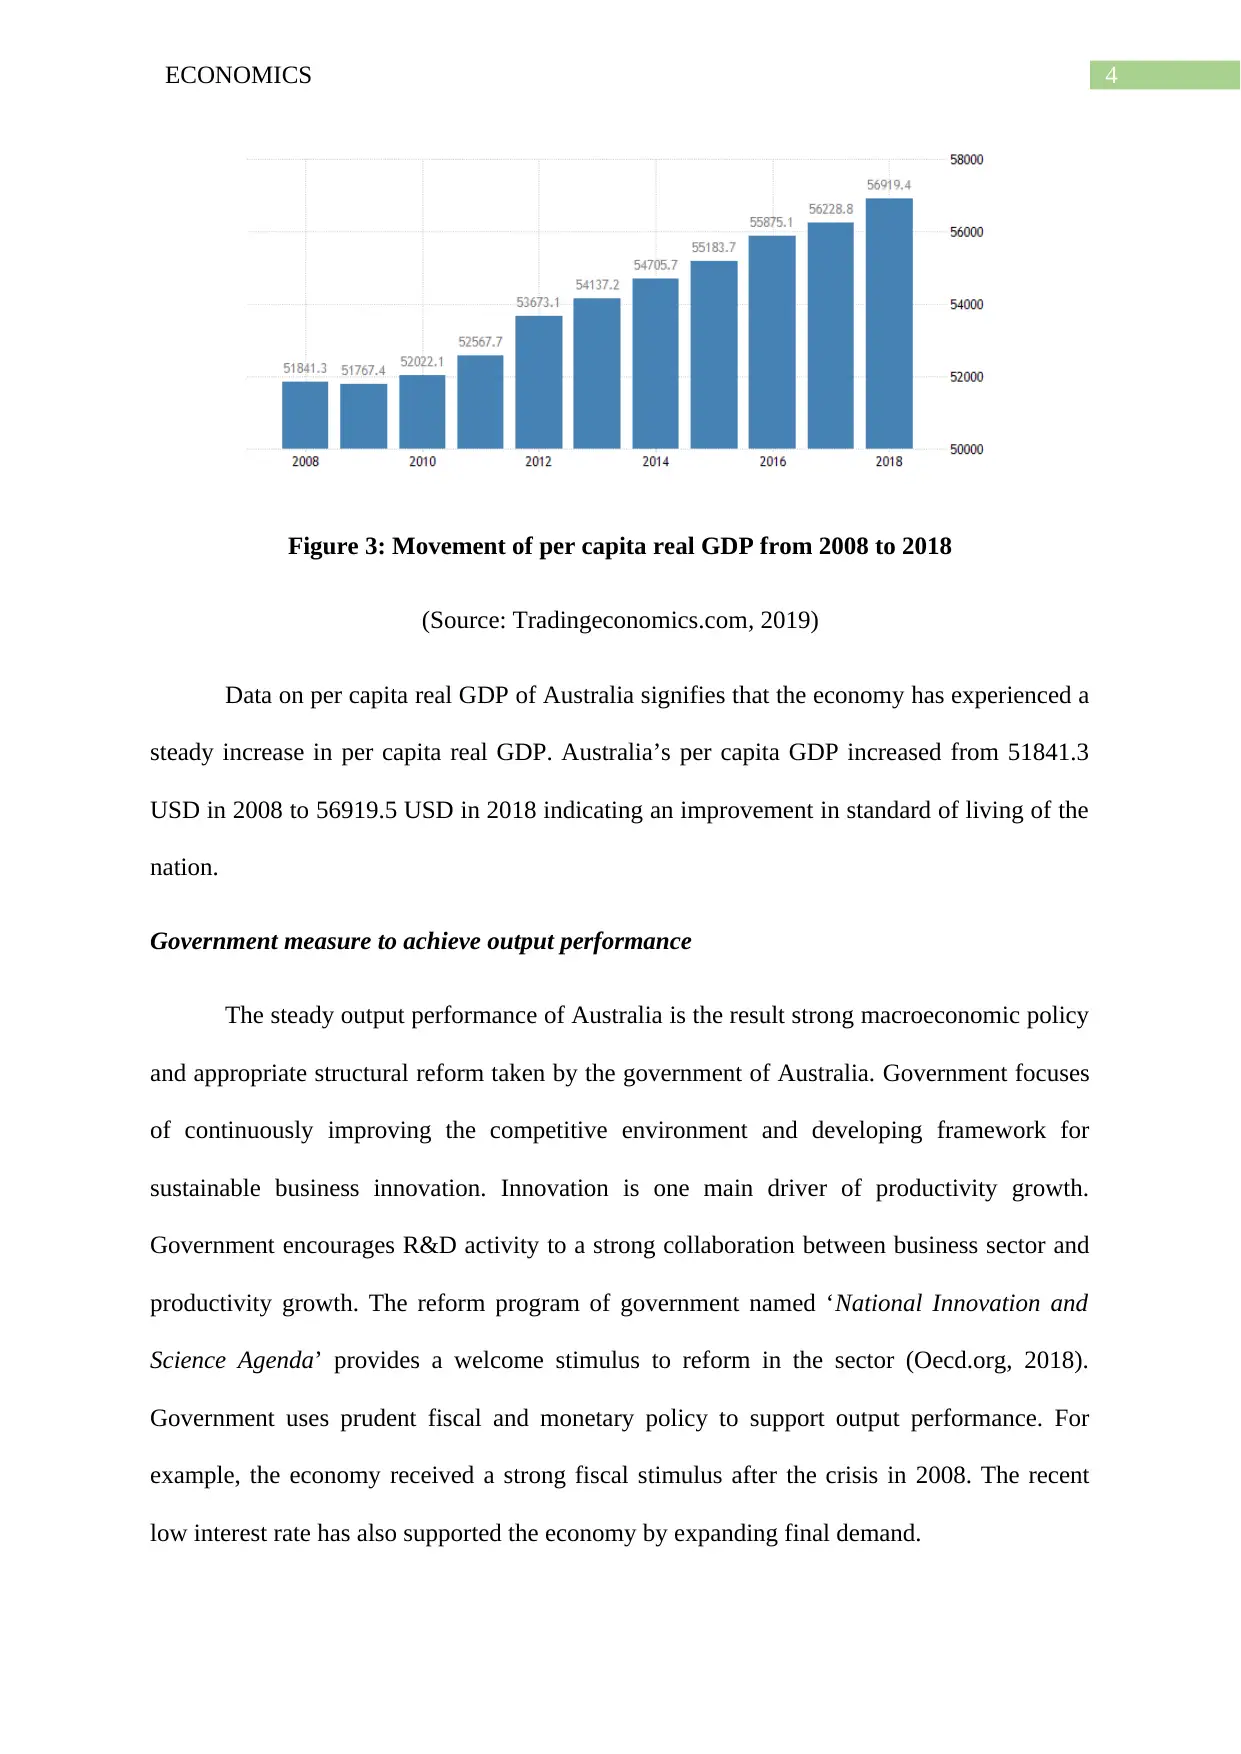
Figure 3: Movement of per capita real GDP from 2008 to 2018
(Source: Tradingeconomics.com, 2019)
Data on per capita real GDP of Australia signifies that the economy has experienced a
steady increase in per capita real GDP. Australia’s per capita GDP increased from 51841.3
USD in 2008 to 56919.5 USD in 2018 indicating an improvement in standard of living of the
nation.
Government measure to achieve output performance
The steady output performance of Australia is the result strong macroeconomic policy
and appropriate structural reform taken by the government of Australia. Government focuses
of continuously improving the competitive environment and developing framework for
sustainable business innovation. Innovation is one main driver of productivity growth.
Government encourages R&D activity to a strong collaboration between business sector and
productivity growth. The reform program of government named ‘National Innovation and
Science Agenda’ provides a welcome stimulus to reform in the sector (Oecd.org, 2018).
Government uses prudent fiscal and monetary policy to support output performance. For
example, the economy received a strong fiscal stimulus after the crisis in 2008. The recent
low interest rate has also supported the economy by expanding final demand.
5ECONOMICS
Labor market analysis
Unemployment and its types
In an economy, unemployment represents circumstances where some of the working
age people are unable to find a job despite looking for a full time employment. Considering
various reasons for unemployment, there are three central types of unemployment – structural
unemployment, cyclical unemployment and frictional unemployment.
Structural unemployment
An economy experiences structural unemployment in times of structural shift of the
economy. Because of the structural shift there occurs a mismatch between skilled and
unskilled workers. One example of unemployment resulted from structural shift is the
unemployment created when machine workers are replaced by robots.
Cyclical unemployment
An economy experiences several ups and down due to fluctuation in business cycle.
During recession, the economy experienced a contraction in the activity. Demand for goods
and services fall resulting in a decline in aggregate demand. This induces business to cut
down labor strength to lower the cost (Heijdra, 2017). Unemployment resulted from
fluctuation in business cycle is known as cyclical unemployment.
Frictional unemployment
Frictional unemployment in the country seems to exist when workers leave existing
jobs however have not found a new job. This type of unemployment mostly occurs as
workers leave their jobs voluntarily to search for a better job opportunity.
⊘ This is a preview!⊘
Do you want full access?
Subscribe today to unlock all pages.
Trusted by 1+ million students worldwide
6ECONOMICS
Analysis of unemployment trend in Australia
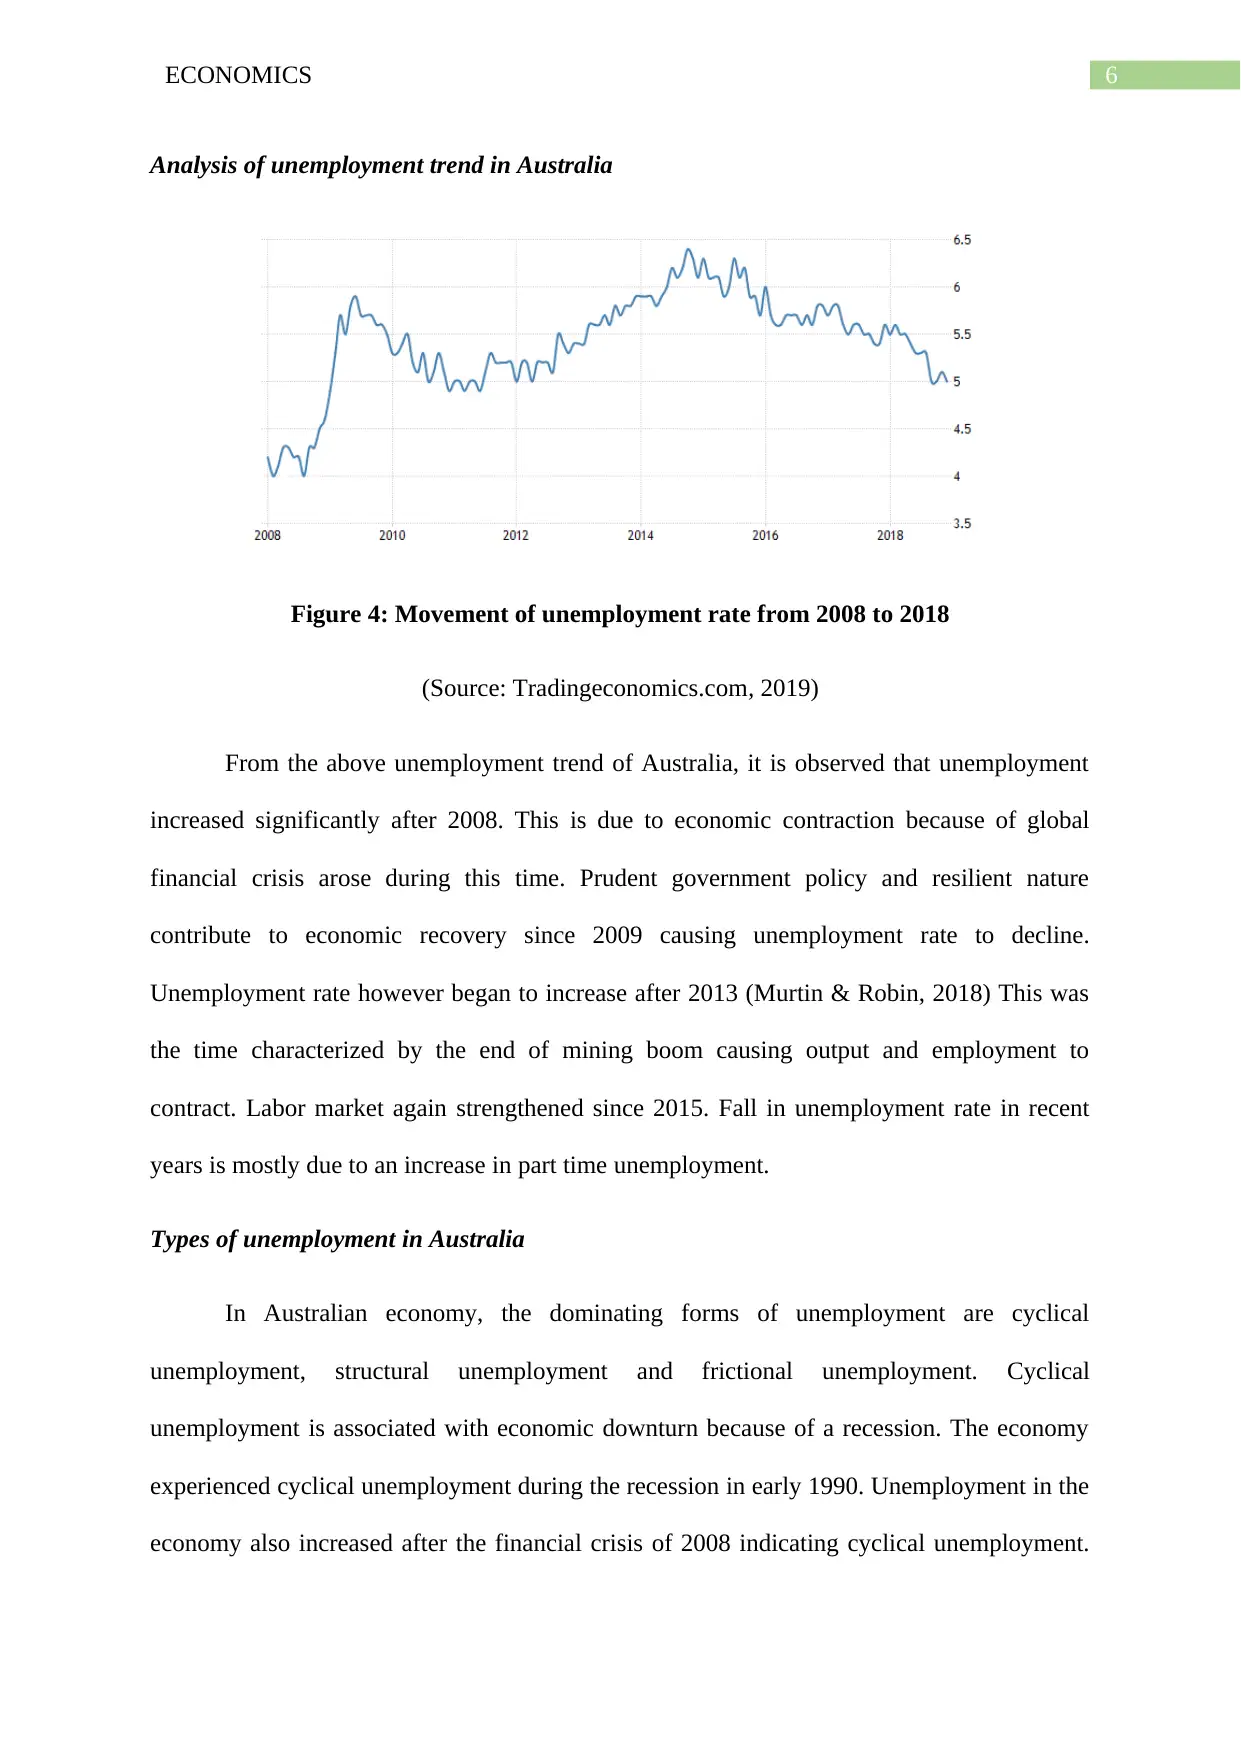
Figure 4: Movement of unemployment rate from 2008 to 2018
(Source: Tradingeconomics.com, 2019)
From the above unemployment trend of Australia, it is observed that unemployment
increased significantly after 2008. This is due to economic contraction because of global
financial crisis arose during this time. Prudent government policy and resilient nature
contribute to economic recovery since 2009 causing unemployment rate to decline.
Unemployment rate however began to increase after 2013 (Murtin & Robin, 2018) This was
the time characterized by the end of mining boom causing output and employment to
contract. Labor market again strengthened since 2015. Fall in unemployment rate in recent
years is mostly due to an increase in part time unemployment.
Types of unemployment in Australia
In Australian economy, the dominating forms of unemployment are cyclical
unemployment, structural unemployment and frictional unemployment. Cyclical
unemployment is associated with economic downturn because of a recession. The economy
experienced cyclical unemployment during the recession in early 1990. Unemployment in the
economy also increased after the financial crisis of 2008 indicating cyclical unemployment.
Analysis of unemployment trend in Australia
Figure 4: Movement of unemployment rate from 2008 to 2018
(Source: Tradingeconomics.com, 2019)
From the above unemployment trend of Australia, it is observed that unemployment
increased significantly after 2008. This is due to economic contraction because of global
financial crisis arose during this time. Prudent government policy and resilient nature
contribute to economic recovery since 2009 causing unemployment rate to decline.
Unemployment rate however began to increase after 2013 (Murtin & Robin, 2018) This was
the time characterized by the end of mining boom causing output and employment to
contract. Labor market again strengthened since 2015. Fall in unemployment rate in recent
years is mostly due to an increase in part time unemployment.
Types of unemployment in Australia
In Australian economy, the dominating forms of unemployment are cyclical
unemployment, structural unemployment and frictional unemployment. Cyclical
unemployment is associated with economic downturn because of a recession. The economy
experienced cyclical unemployment during the recession in early 1990. Unemployment in the
economy also increased after the financial crisis of 2008 indicating cyclical unemployment.
Paraphrase This Document
Need a fresh take? Get an instant paraphrase of this document with our AI Paraphraser
7ECONOMICS
Structural unemployment in Australia is prevalent because of change in structure within an
industry. There is a notable decline in manual employment in recent years because of
adaption of automation technology in the manufacturing sector (Rba.gov.au, 2019). This has
increased structural unemployment in the economy. Frictional unemployment indicates
flexibility if the labor market. When students join labor market after completing their studies
they experience this kind of unemployment. Youth unemployment is one major problem of
Australia economy.
Government measure to achieve full employment in Australia
The Australian government gives considerable priority towards achieving full
employment in the economy. As a part of government strategy to address unemployment,
government has focused on ensuring a better performance of employment service system
(Oecdobserver.org, 2019) The market driven employment system in Australia has been
restructured for delivering a better outcome for people searching for jobs. Government has
given a greater importance on the mutual obligation principle. In order to address the ongoing
problem of youth unemployment government took an employment strategy for the youth in
its budget during 2015-16. Under the strategy government took two new policy measures to
generate employment for young people (Aph.gov.au., 2019) Youth Jobs path program costing
the government around $751.7 million aimed to provide employment to people under the age
of 25 years.
Price level analysis
Inflation and typical causes of inflation
Inflation implies a quantitative measure estimating the rate of increase of an average
basket of some selected goods and services of the economy for a long period of time. Two
primary causes of inflation include either a surge in demand or a contraction in supply. Based
8ECONOMICS
on the cause of inflation, the two major types of inflation are demand-pull inflation and cost-
push inflation.
Demand-pull inflation
Demand-pull inflation is observed to be occurred when the economy experiences a
demand side pressure. When there is a surge in demand for goods and services a demand –
supply gap is created due to high demand and low supply pushing the price upward.
Cost-push inflation
Cost-push inflation is the result of an increase in price of inputs used in the production
process. The higher cost reduces aggregate supply (Minford & Peel, 2019) The shortage of
supply results in a higher price or inflation.
Analysis of inflation trend in Australia
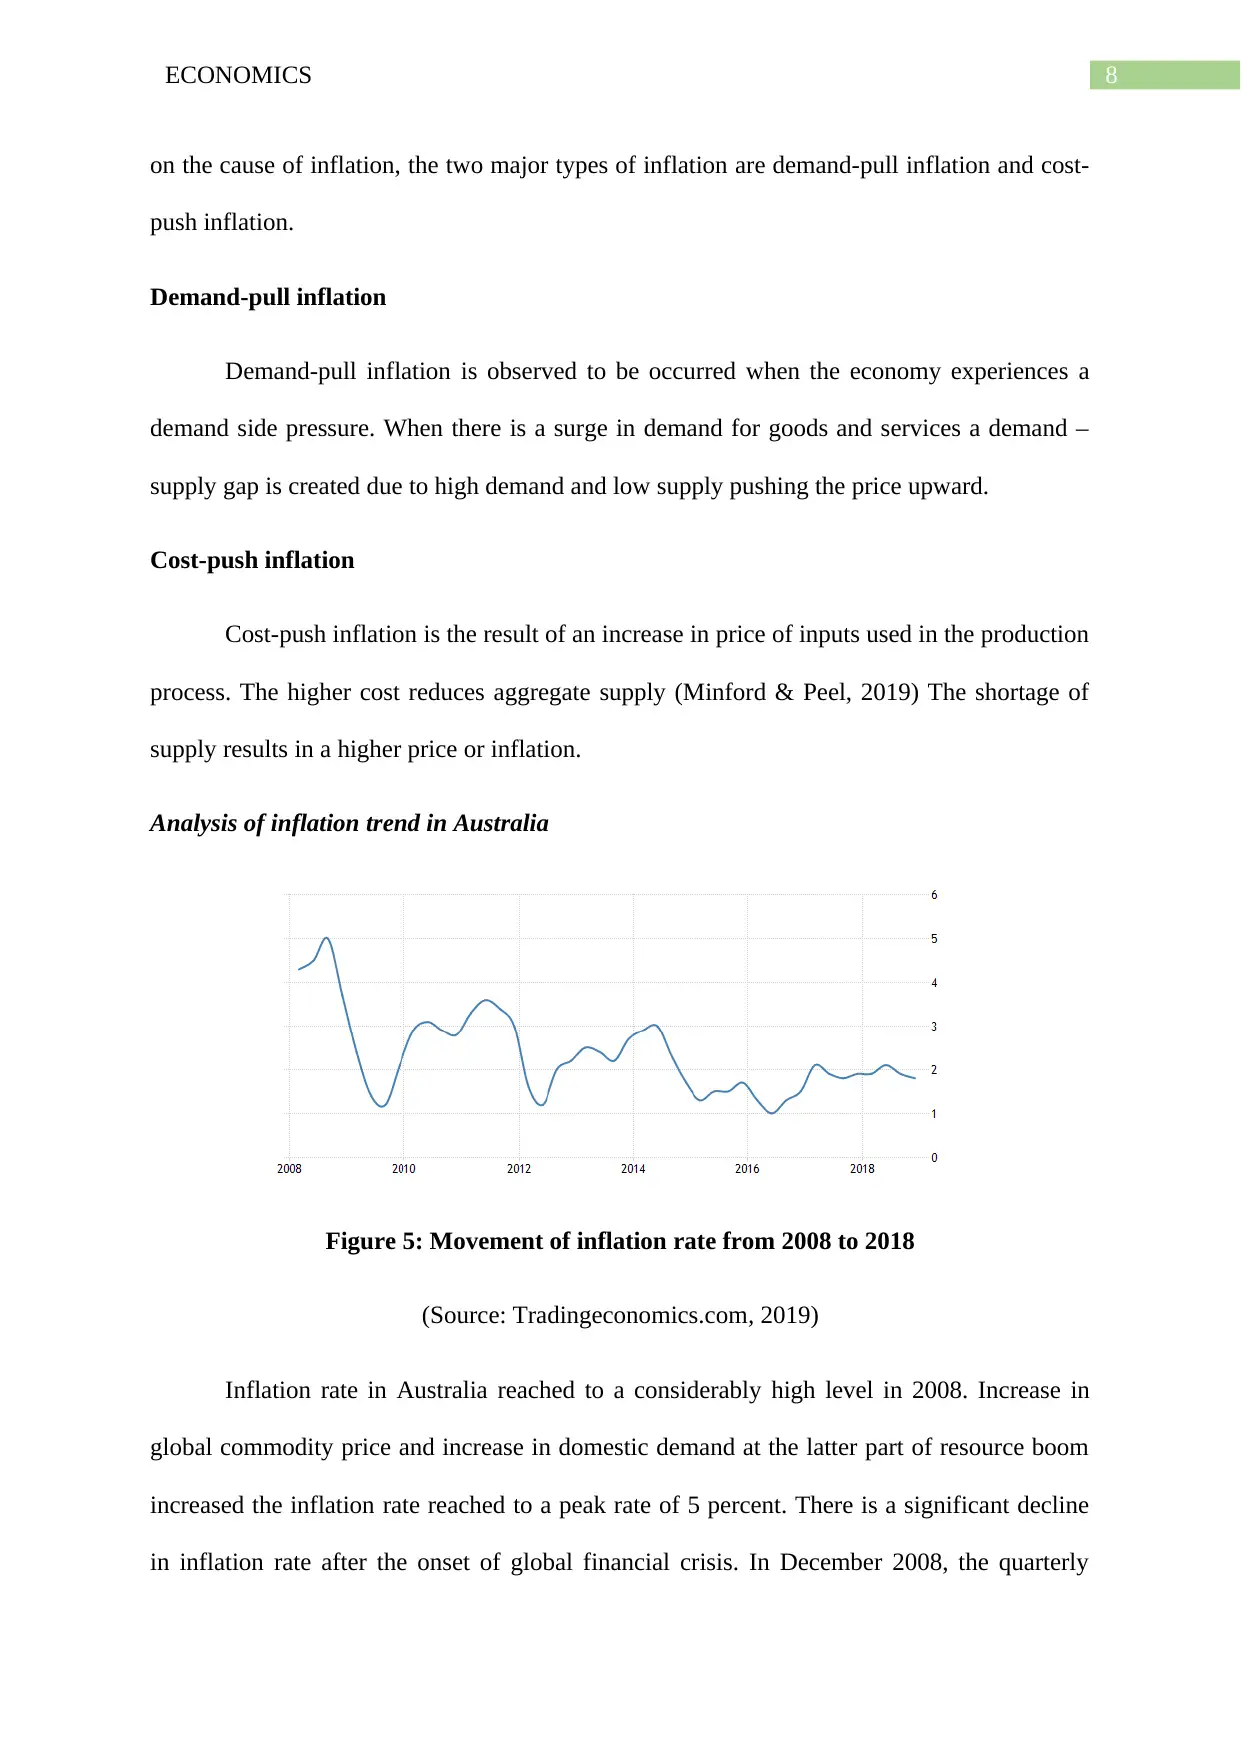
Figure 5: Movement of inflation rate from 2008 to 2018
(Source: Tradingeconomics.com, 2019)
Inflation rate in Australia reached to a considerably high level in 2008. Increase in
global commodity price and increase in domestic demand at the latter part of resource boom
increased the inflation rate reached to a peak rate of 5 percent. There is a significant decline
in inflation rate after the onset of global financial crisis. In December 2008, the quarterly
on the cause of inflation, the two major types of inflation are demand-pull inflation and cost-
push inflation.
Demand-pull inflation
Demand-pull inflation is observed to be occurred when the economy experiences a
demand side pressure. When there is a surge in demand for goods and services a demand –
supply gap is created due to high demand and low supply pushing the price upward.
Cost-push inflation
Cost-push inflation is the result of an increase in price of inputs used in the production
process. The higher cost reduces aggregate supply (Minford & Peel, 2019) The shortage of
supply results in a higher price or inflation.
Analysis of inflation trend in Australia
Figure 5: Movement of inflation rate from 2008 to 2018
(Source: Tradingeconomics.com, 2019)
Inflation rate in Australia reached to a considerably high level in 2008. Increase in
global commodity price and increase in domestic demand at the latter part of resource boom
increased the inflation rate reached to a peak rate of 5 percent. There is a significant decline
in inflation rate after the onset of global financial crisis. In December 2008, the quarterly
⊘ This is a preview!⊘
Do you want full access?
Subscribe today to unlock all pages.
Trusted by 1+ million students worldwide
9ECONOMICS
deflation recorded to be -0.3 percent. By September 2009, rate of inflation reached to the
lowest level of 1.2 percent. With beginning of economic recovery, price level recovered
between 2010 and 2011 (abs.gov.au., 2019). From 2014 to 2018, inflation started to decline
and remained within 2 percent because of factors such as high value of Australian dollar,
weak growth of wages and strong competition in retail market.
Causes of inflation in Australia
In Australia, there is no single cause behind the rate of inflation. Causes of inflation in
Australia vary from tangible factors such as higher demand or increase in wage rate to
intangible factors such as expectation of people about future price and the impact of inflation
occurred globally on these expectations (Nevile, 2016). One factor resulting in cost-push
inflation in Australia is the increase in wage rate. Higher wage has two links with inflation.
First higher wage means higher earnings leading to a higher demand and hence, a higher
price level. Second, higher wage means higher production cost leading to a fall in aggregate
supply and a high price.
Government measure to achieve stable price in Australia
The Reserve Bank of Australia designs effective monetary policy to retain a stability
in the price level. The policy targets to maintain an average inflation rate between 2 and 3
percent. Assessment of current and expected inflation rate as against targeted inflation helps
RBA to make monetary policy decision. Cash rate is the main instrument for controlling
inflation rate (Rba.gov.au., 2019) When inflation overshoots the target contractionary
monetary is taken through an increase in cash rate. In contrast, RBA reduces cash rate when
inflation rate is below the targeted rate.
Paraphrase This Document
Need a fresh take? Get an instant paraphrase of this document with our AI Paraphraser
10ECONOMICS
Conclusion
The study of Australian economy from 2008 to 2018 indicates that overall the
economy constitutes a satisfactory performance. There is a steady increase in both real GDP
and per capita real GDP of Australia. For real GDP growth rate, there has been observed a
variability in the growth trend. Since the latter half of 2018 the economy experienced a down
fall in growth compared to previous period. The labor market of Australia remained relatively
steady with a sharp decline in unemployment supported by the dominance of part time
employment. For price level, there is a declining trend. Followed by inflation targeting policy
of RBA, inflation rate fluctuates around 2 to 3 percent.
11ECONOMICS
References
abs.gov.au (2019) ABS Chief Economist - 70 Years of Inflation in Australia.. Abs.gov.au.
Retrieved 25 September 2019, from
https://www.abs.gov.au/websitedbs/D3310114.nsf/home/ABS+Chief+Economist+-
+70+Years+of+Inflation+in+Australia
Aph.gov.au (2019) Youth employment measures – Parliament of Australia . Aph.gov.au.
Retrieved 25 September 2019, from
https://www.aph.gov.au/About_Parliament/Parliamentary_Departments/
Parliamentary_Library/pubs/rp/BudgetReview201617/Youthemployment
Ellem, B., & Tonts, M. (2018). The global commodities boom and the reshaping of regional
economies: the Australian experience. Australian Geographer, 49(3), 383-395.
Goodwin, N., Harris, J. M., Nelson, J. A., Roach, B., & Torras, M. (2015). Macroeconomics
in context. Routledge.
Heijdra, B. J. (2017). Foundations of modern macroeconomics. Oxford university press.
Minford, P., & Peel, D. (2019). Advanced macroeconomics: a primer. Edward Elgar
Publishing.
Murtin, F., & Robin, J. M. (2018). Labor market reforms and unemployment
dynamics. Labour Economics, 50, 3-19.
Nevile, J. W. (2016). Inflation in Australia: Causes and Cures. In Post-Keynesian Essays
from Down Under Volume II: Essays on Policy and Applied Economics (pp. 232-
242). Palgrave Macmillan, London.
⊘ This is a preview!⊘
Do you want full access?
Subscribe today to unlock all pages.
Trusted by 1+ million students worldwide
1 out of 14
Related Documents


Your All-in-One AI-Powered Toolkit for Academic Success.
+13062052269
info@desklib.com
Available 24*7 on WhatsApp / Email
![[object Object]](/_next/static/media/star-bottom.7253800d.svg)
Unlock your academic potential
Copyright © 2020–2026 A2Z Services. All Rights Reserved. Developed and managed by ZUCOL.