Confirmatory Factor Analysis of AUTOS Data: Smoking & Control Loss

Verified

Added on  2023/06/11

|6
|1048
|210
Report
AI Summary
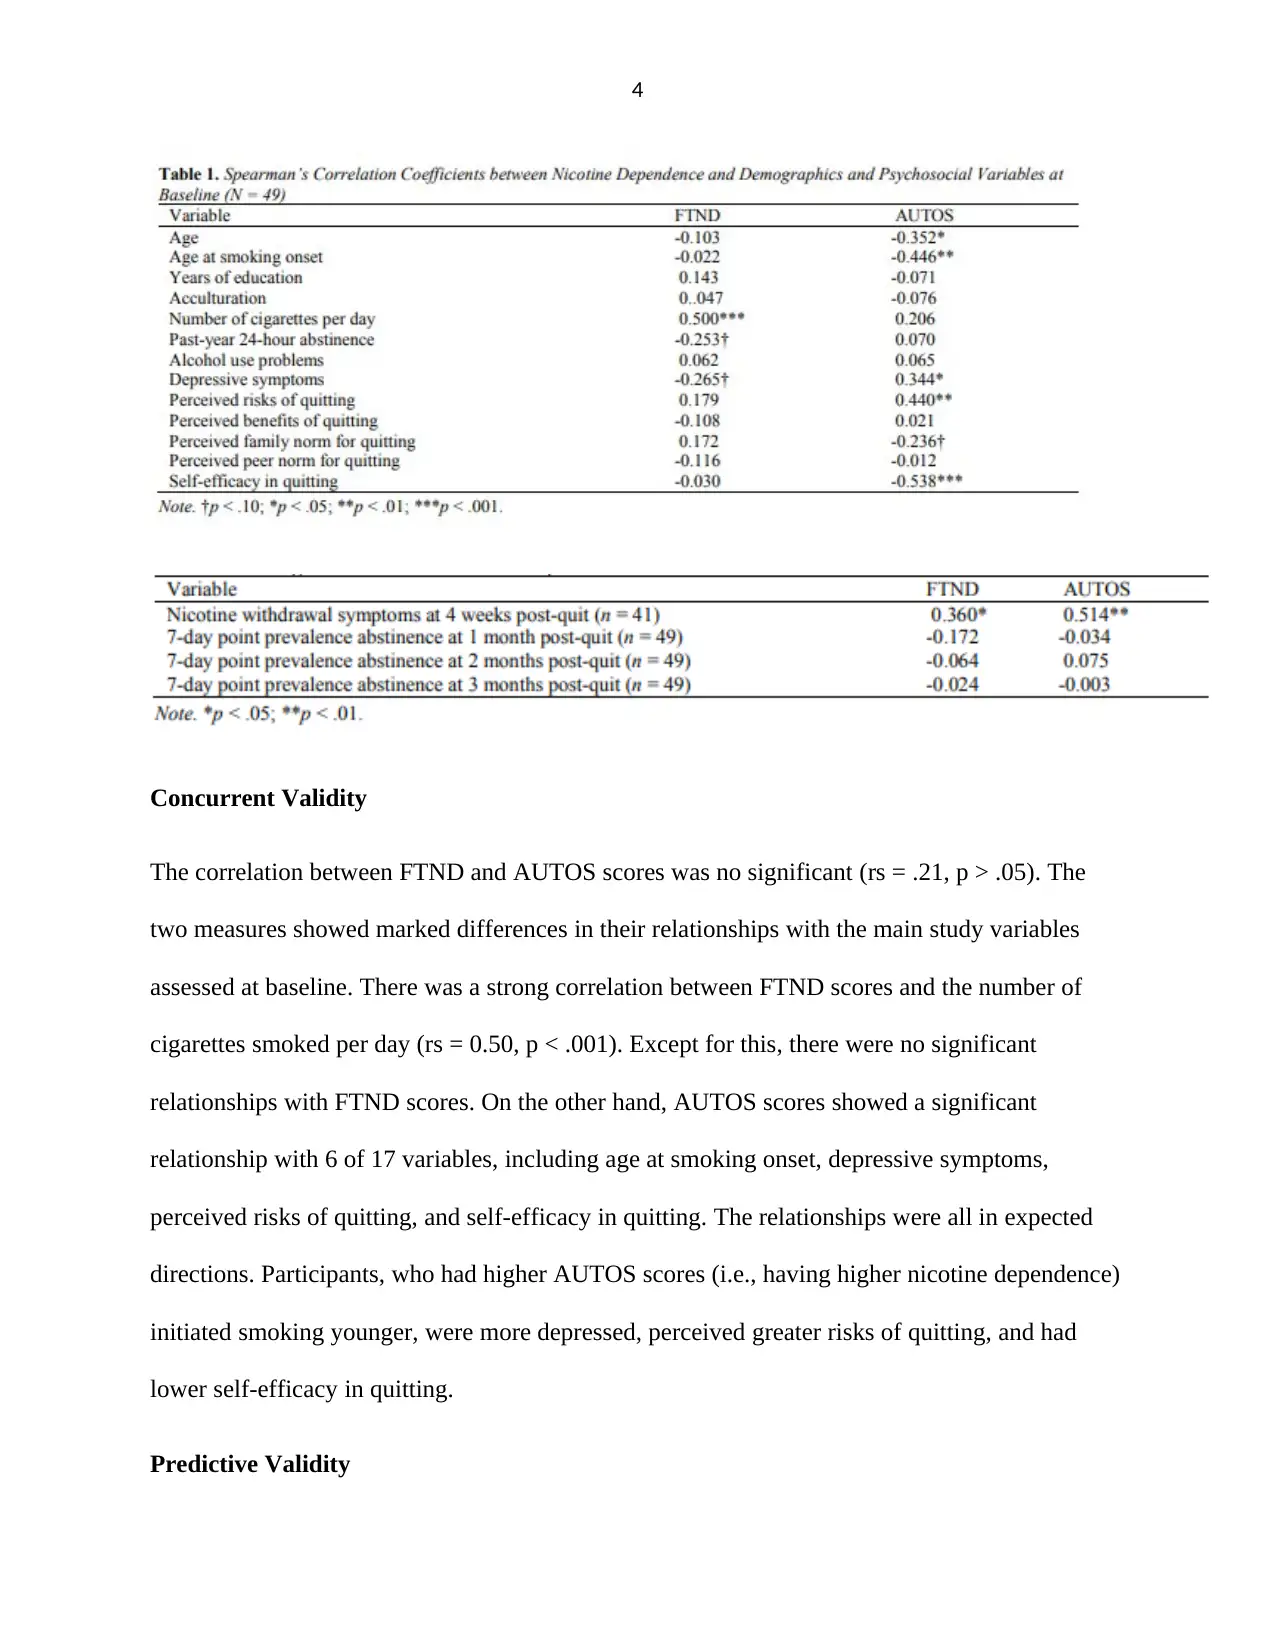
This report presents a data analysis of smoking habits using the Autonomy Over Smoking Scale (AUTOS) and AMOS software. The analysis aims to compare a three-factor model (Withdrawal symptoms, Psychological Dependence, and Cue-induced craving) and a one-factor model to determine which best fits the data from a sample of 344 New Zealand smokers. The report includes descriptive statistics, reliability analysis (Cronbach's alpha), and concurrent validity assessments using Spearman's rank correlation coefficients. The study examines the relationship between FTND and AUTOS scores and their predictive validity concerning nicotine withdrawal symptoms and abstinence. The results, including t-tests, are discussed in the context of understanding how smokers experience a loss of control over their smoking habit. The report concludes by identifying the model that best represents the data and its implications for understanding smoking behavior.
Document Page
1
Running Had: DATA ANALYSIS
Data Analysis
Student Name
Institution
Date
tabler-icon-diamond-filled.svg

Paraphrase This Document

Need a fresh take? Get an instant paraphrase of this document with our AI Paraphraser
Document Page
2
Introduction
Data analyses are executed using AMOS data analysis software. The data analysis is
overpowered to identify the actual treatment impact due to the bigger sample. But, 344 subjects
are proposed to produce a close-precise estimation of satisfactory scope for experimental
analysis (Lenz, 1997). Descriptive statistics are employed to categorize features of contributors
in terms of smoking-linked variables, psychosocial and speculative variables, end results and
demographics. Cronbach’s alpha is computed to evaluate the reliability of AUTOS as well as
FTND. Spearman’s rank correlation coefficients are assessed to estimate the simultaneous and
analytical rationalities of the processes (BECKER, 2000).
Variables
This analysis counts with one dependent, and one independent variable. The dependent
variable is the growth experienced by smokers, and the independent variable is the type of
smoking type; divided into two categories: FIND and AUTOS. The dependent variable will be
measured using the smoker’s growth rate for the last three years. The data will be retrieved
directly from the psychology report.
Hypotheses
The null hypothesis for this study is: smokers increase rate for the last three years using
an AUTOS method. The alternate hypothesis for this study is: smokers’ growth rate for the last
three years using an FIND method.
Ho:μOnline=μBrick and mortar
Ha:μOnline>μBrick and mortar
Document Page
3
Data Analysis Technique
The proposed study will follow a quantitative research model, as all the variables are
going to be quantified. The purpose of the study is to explain the relationship between the
variables, and how the samples differ from each other. To address the research question, a
descriptive method could be used to look at the numbers, and understand how the independent
variable is affecting the dependent variable (Azumi and Shirakawa, 1988).
The mean smokers is analyzed to determine if there are differences in the AUTOS method when
compared with brick and mortar. The mean for smokers will be compared using a two-sample t-
test. The level of significance will be 0.05. The null hypothesis Ho:μOnline=μBrick and mortar ,
will be examined.
Statistics t-test enhances answering the research question through the application of t-test statistic
in finding out the ap-value which shows the probability of the results by chance and if the null
hypothesis are actual (Ho:μOnline=μBrick and mortar) (Chen and Giles, 2008). If there is less
than 5% (p-value is less than 0.05) chance of getting the observed difference
(Ha:μOnline>μBrick and mortar), the null hypothesis is rejected, and it can be concluded that
there is statistically significant difference between the two groups. If there is more than 5% (p-
value is greater than 0.05) chance of getting the observed difference, the study would conclude
that there is not enough evidence to reject the null hypothesis, and it would fail to reject it.
Results
FTND scores oscillated from 2 to 9 with a mean of 5.80 (SD = 1.70). AUTOS scores ranged
from 9 to 36 with a mean of 22.40 (SD = 7.55). Item-to-total score correlation coefficients varied
from .21 to 0.63 for the FTND (α = .32) and from 0.51 to 0.76 for the AUTOS (α = 0.87).
Document Page
4
Concurrent Validity
The correlation between FTND and AUTOS scores was no significant (rs = .21, p > .05). The
two measures showed marked differences in their relationships with the main study variables
assessed at baseline. There was a strong correlation between FTND scores and the number of
cigarettes smoked per day (rs = 0.50, p < .001). Except for this, there were no significant
relationships with FTND scores. On the other hand, AUTOS scores showed a significant
relationship with 6 of 17 variables, including age at smoking onset, depressive symptoms,
perceived risks of quitting, and self-efficacy in quitting. The relationships were all in expected
directions. Participants, who had higher AUTOS scores (i.e., having higher nicotine dependence)
initiated smoking younger, were more depressed, perceived greater risks of quitting, and had
lower self-efficacy in quitting.
Predictive Validity
tabler-icon-diamond-filled.svg

Paraphrase This Document

Need a fresh take? Get an instant paraphrase of this document with our AI Paraphraser
Document Page
5
Both FTND and AUTOS scores were significantly correlated with nicotine withdrawal
symptoms at four weeks post-quit. However, the relationship was stronger for the AUTOS than
for the FTND (Table 2). A total of 28 participants (57.1%) self-reported 7-day point prevalence
abstinence at one-month follow-up and 27 participants (55.1%) at two months follow-up. The
rates declined to 20 participants (40.8%) at three months follow-up, of whom 15 (30.6%)
verified the abstinence with a salivary cotinine test. Participants (n = 3) who reported smoking
but refused to perform the test, or yielded a cotinine level higher than 0 (0- 10ng/ml) were all
treated as smokers. Both FTND and AUTOS scores failed to predict abstinence in a binary
logistic regression analysis.
Document Page
6
References
Lenz, H. (1997). A handbook of statistical analyses using SAS. Computational Statistics & Data
Analysis, 24(4), p.504.
BECKER, G. (2000). CREATING COMPARABILITY AMONG RELIABILITY
COEFFICIENTS: THE CASE OF CRONBACH ALPHA AND COHEN KAPPA. Psychological
Reports, 87(7), p.1171.
Chen, Q. and Giles, D. (2008). General Saddlepoint Approximations: Application to the
Anderson-Darling Test Statistic. Communications in Statistics - Simulation and Computation,
37(4), pp.789-804.
Azumi, K. and Shirakawa, S. (1988). Proposed quantitative spindle-delta wave sleep diagram for
sleep study. Neuroscience Research Supplements, 7, p.S191.
chevron_up_icon
1 out of 6
circle_padding
hide_on_mobile
zoom_out_icon
[object Object]