BB108 Business Statistics: Applying Statistical Tools and Techniques
VerifiedAdded on 2023/06/12
|12
|1160
|241
Homework Assignment
AI Summary
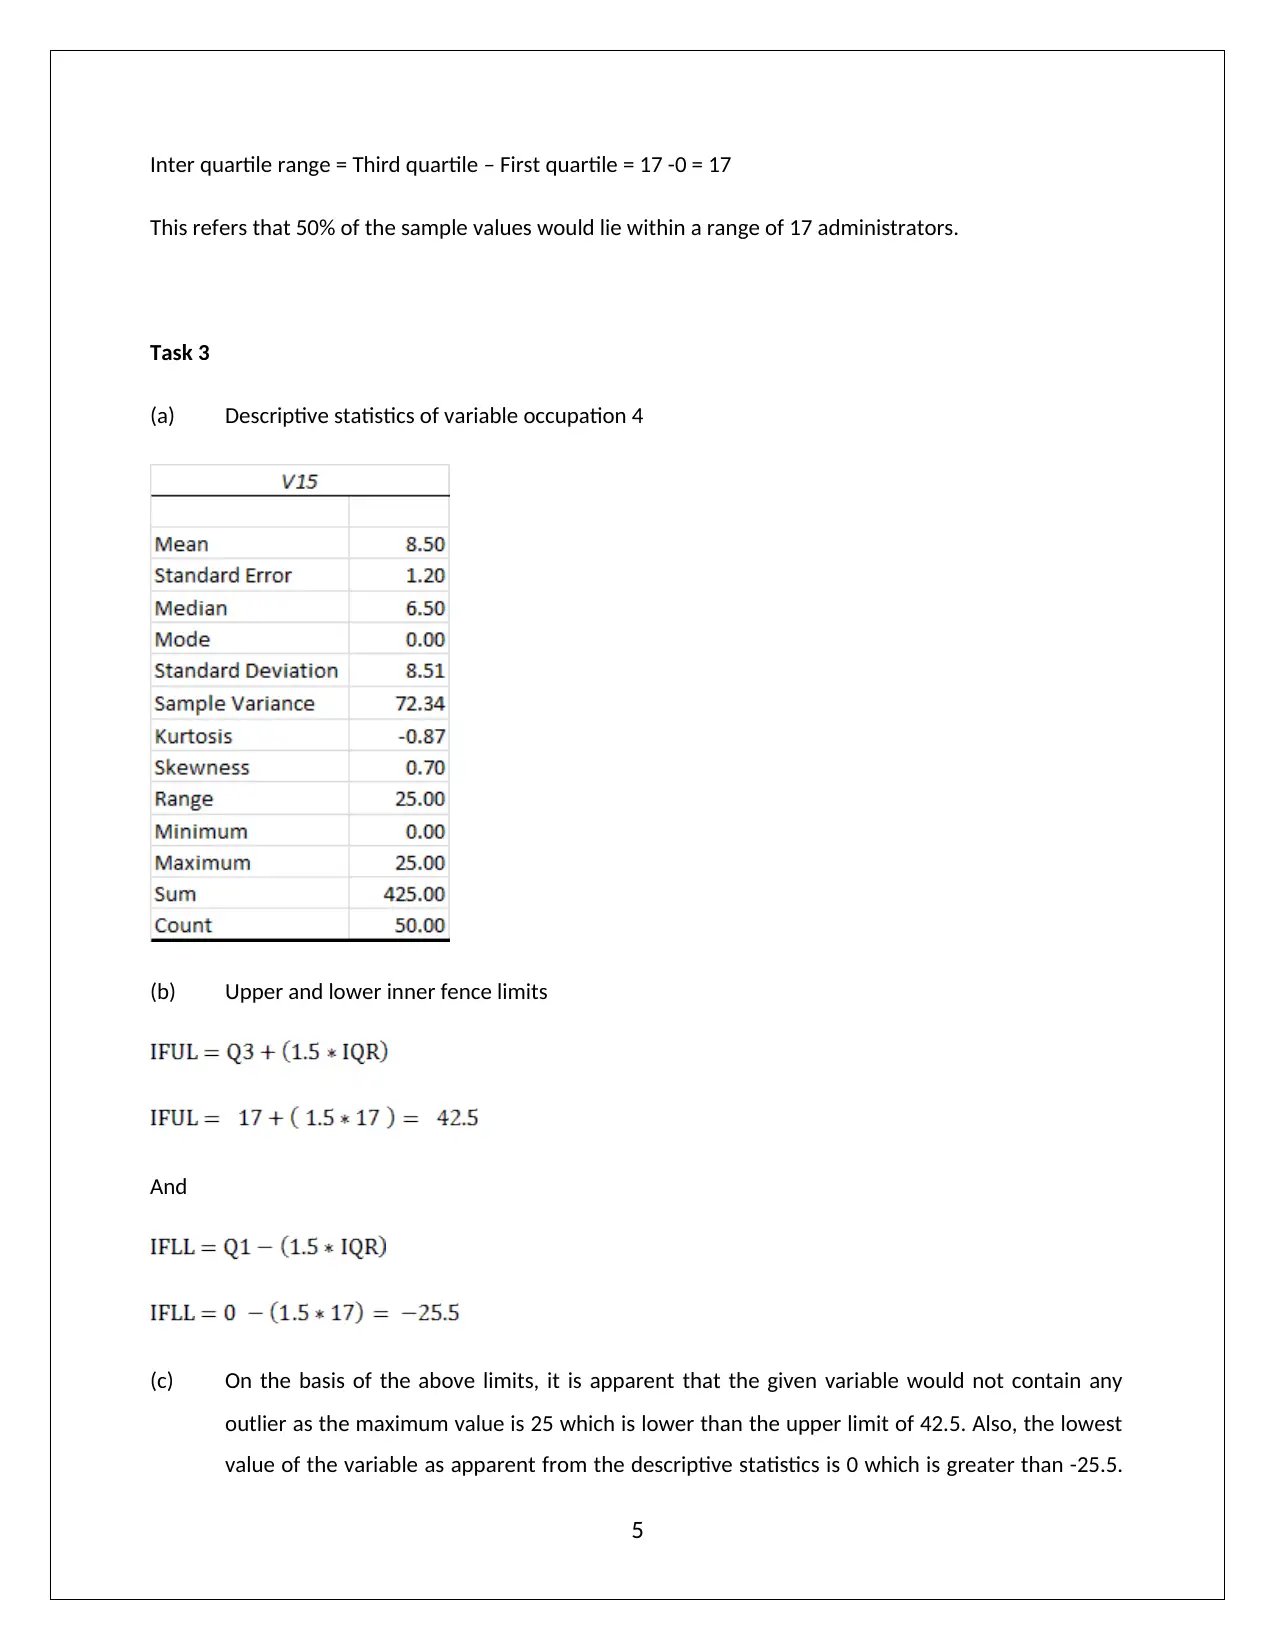
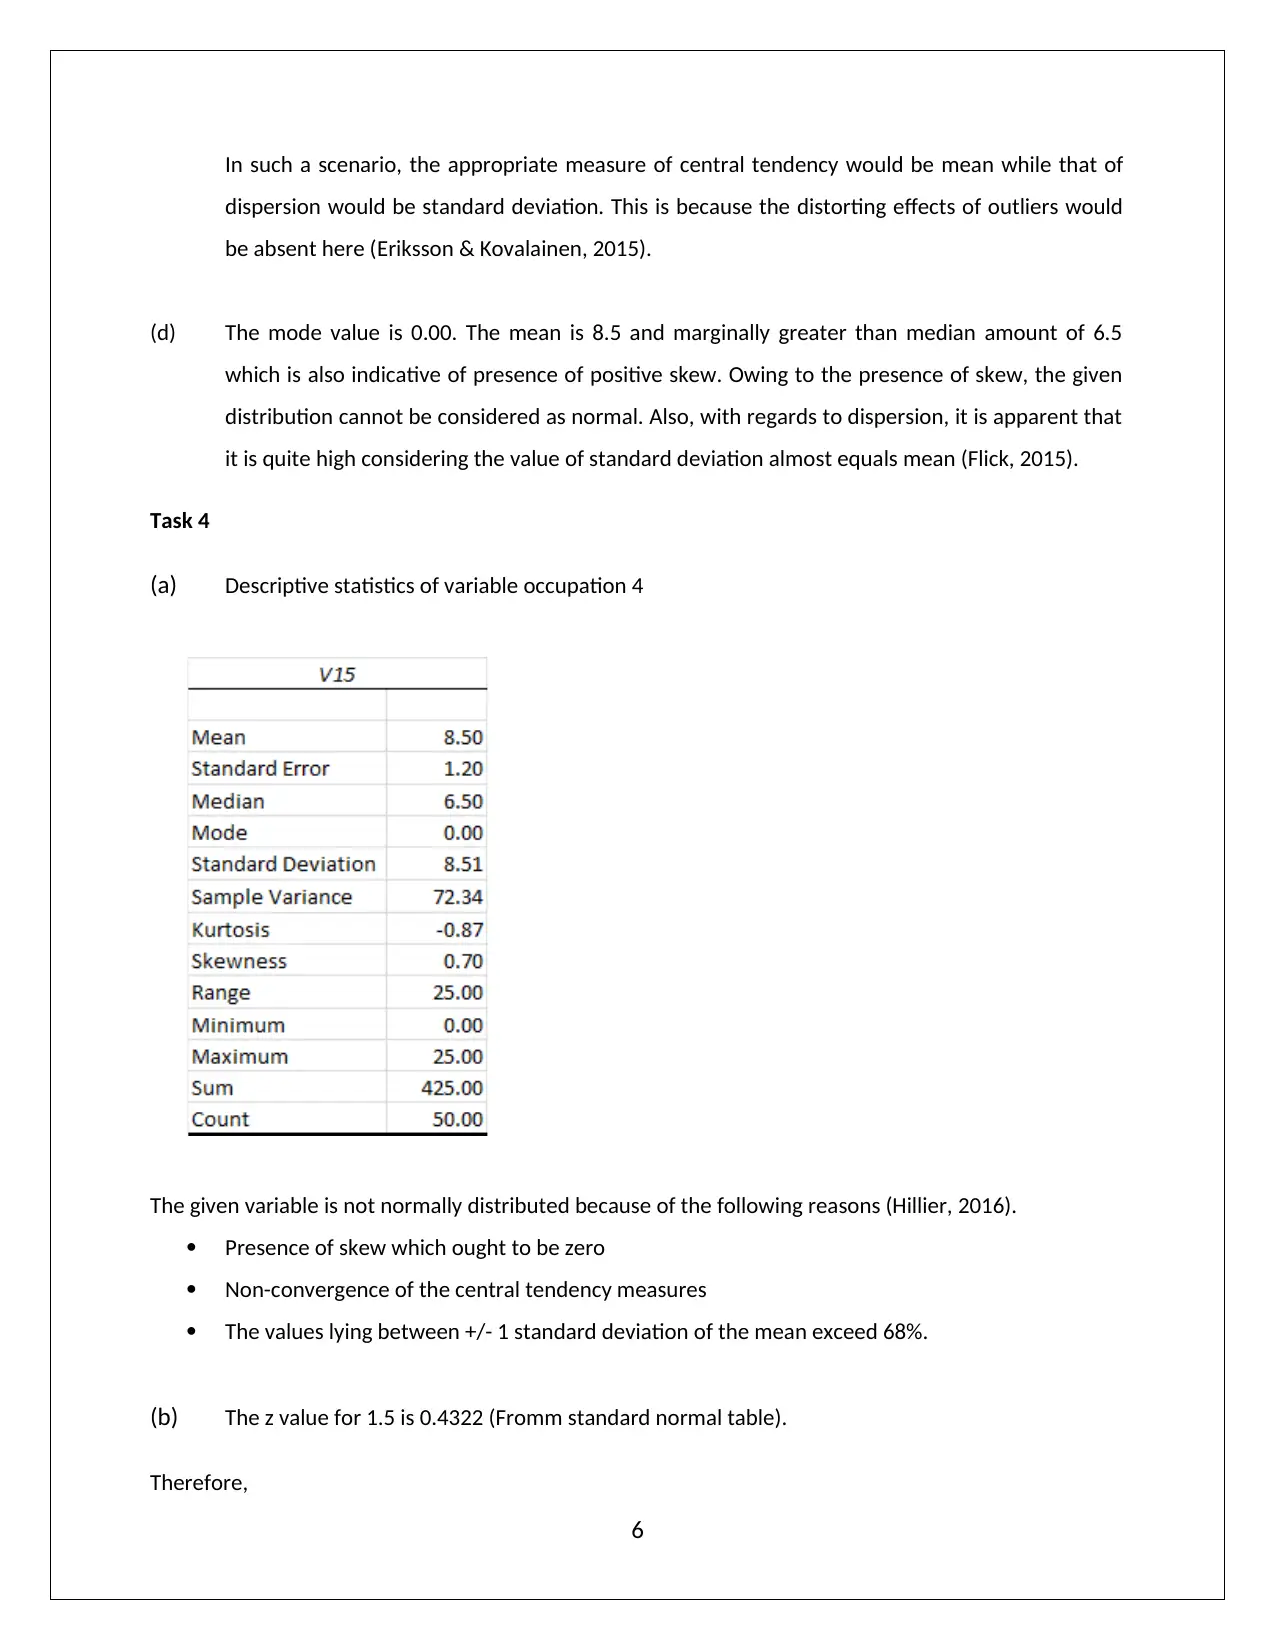
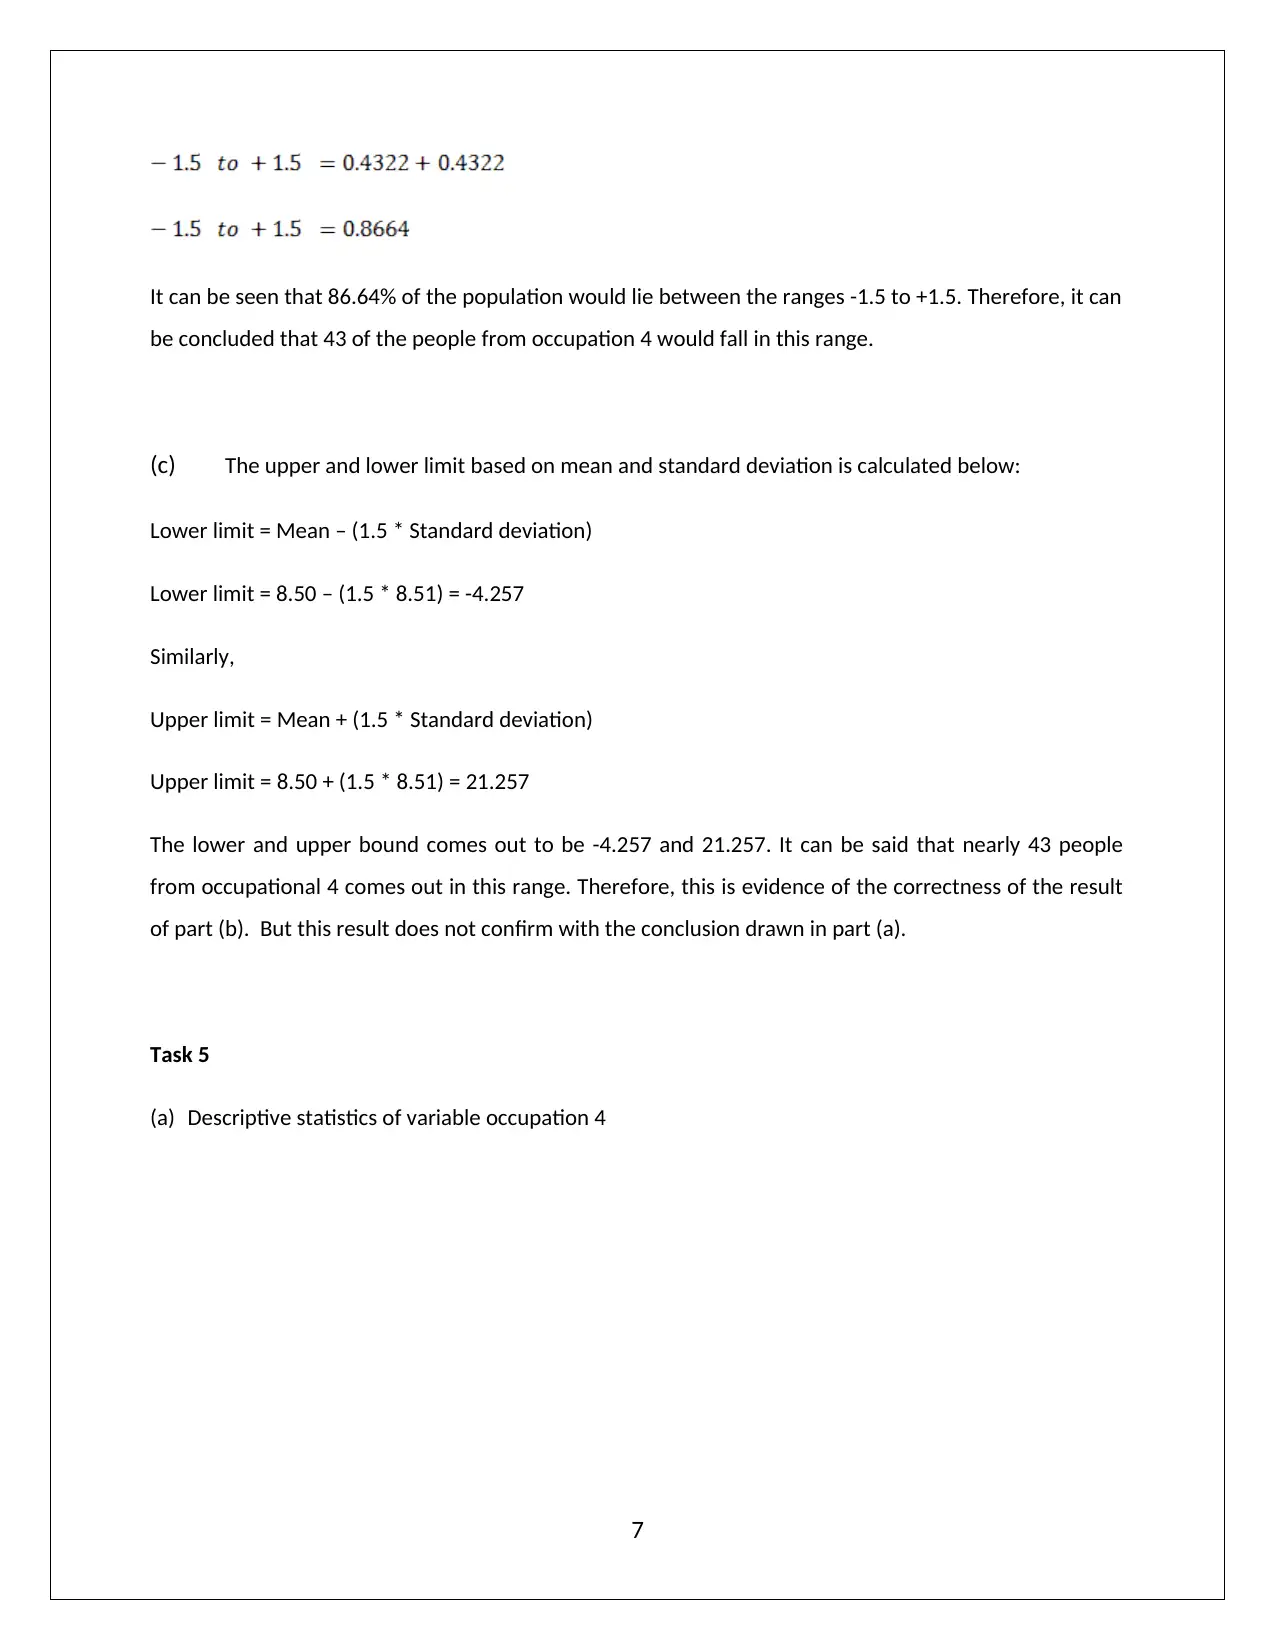
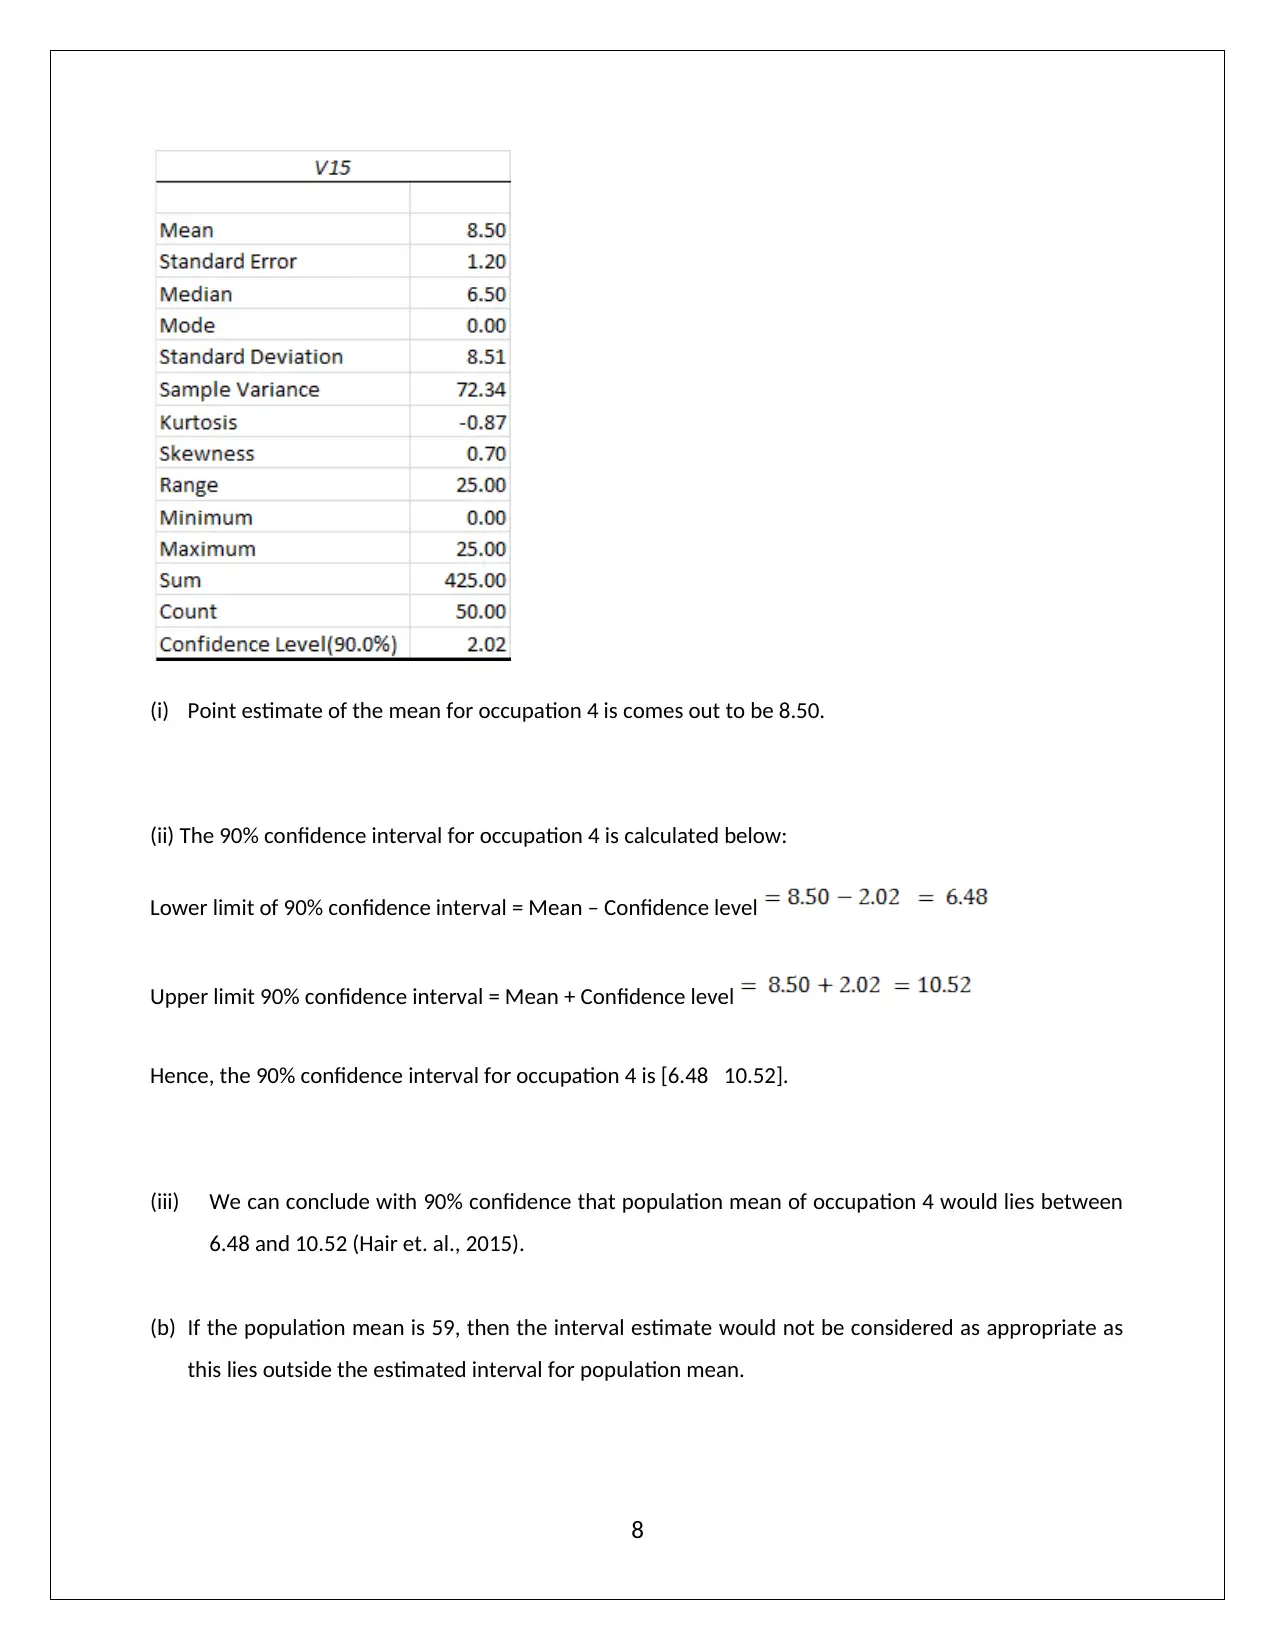
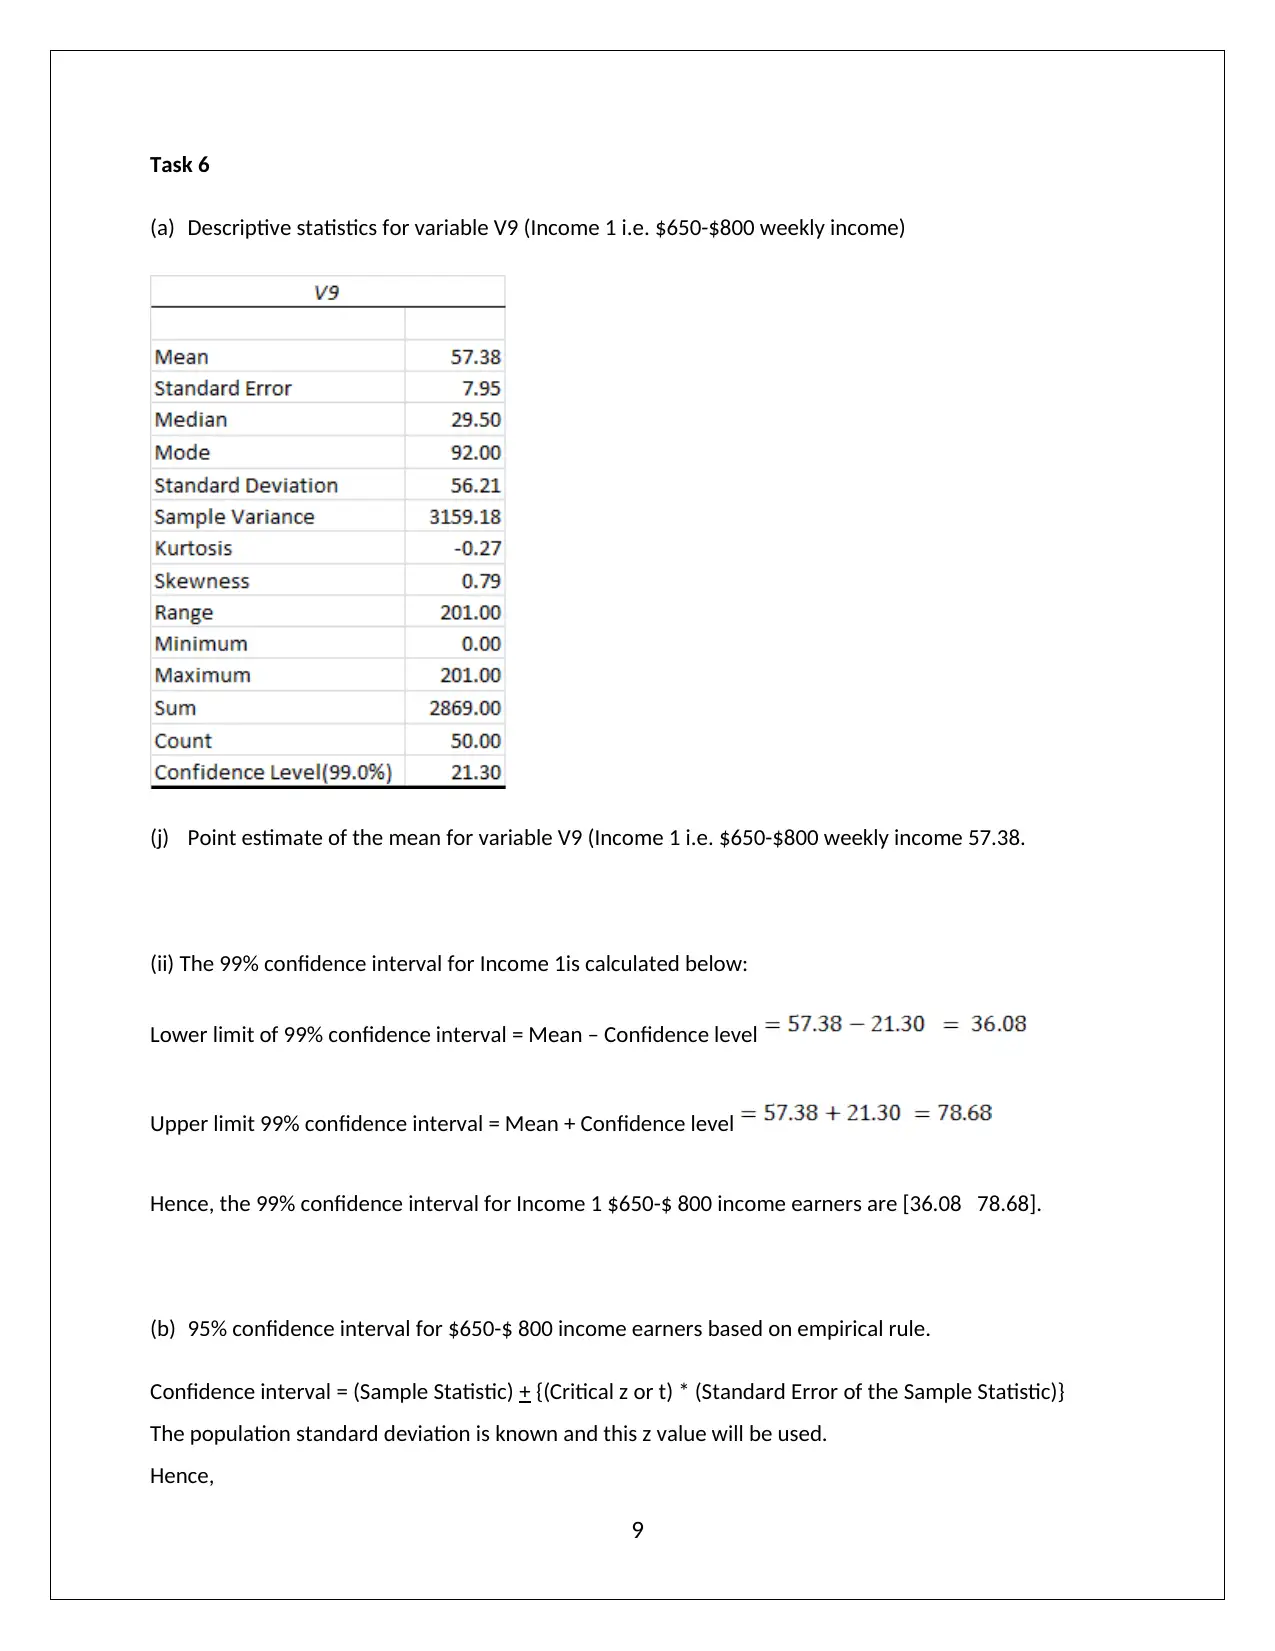
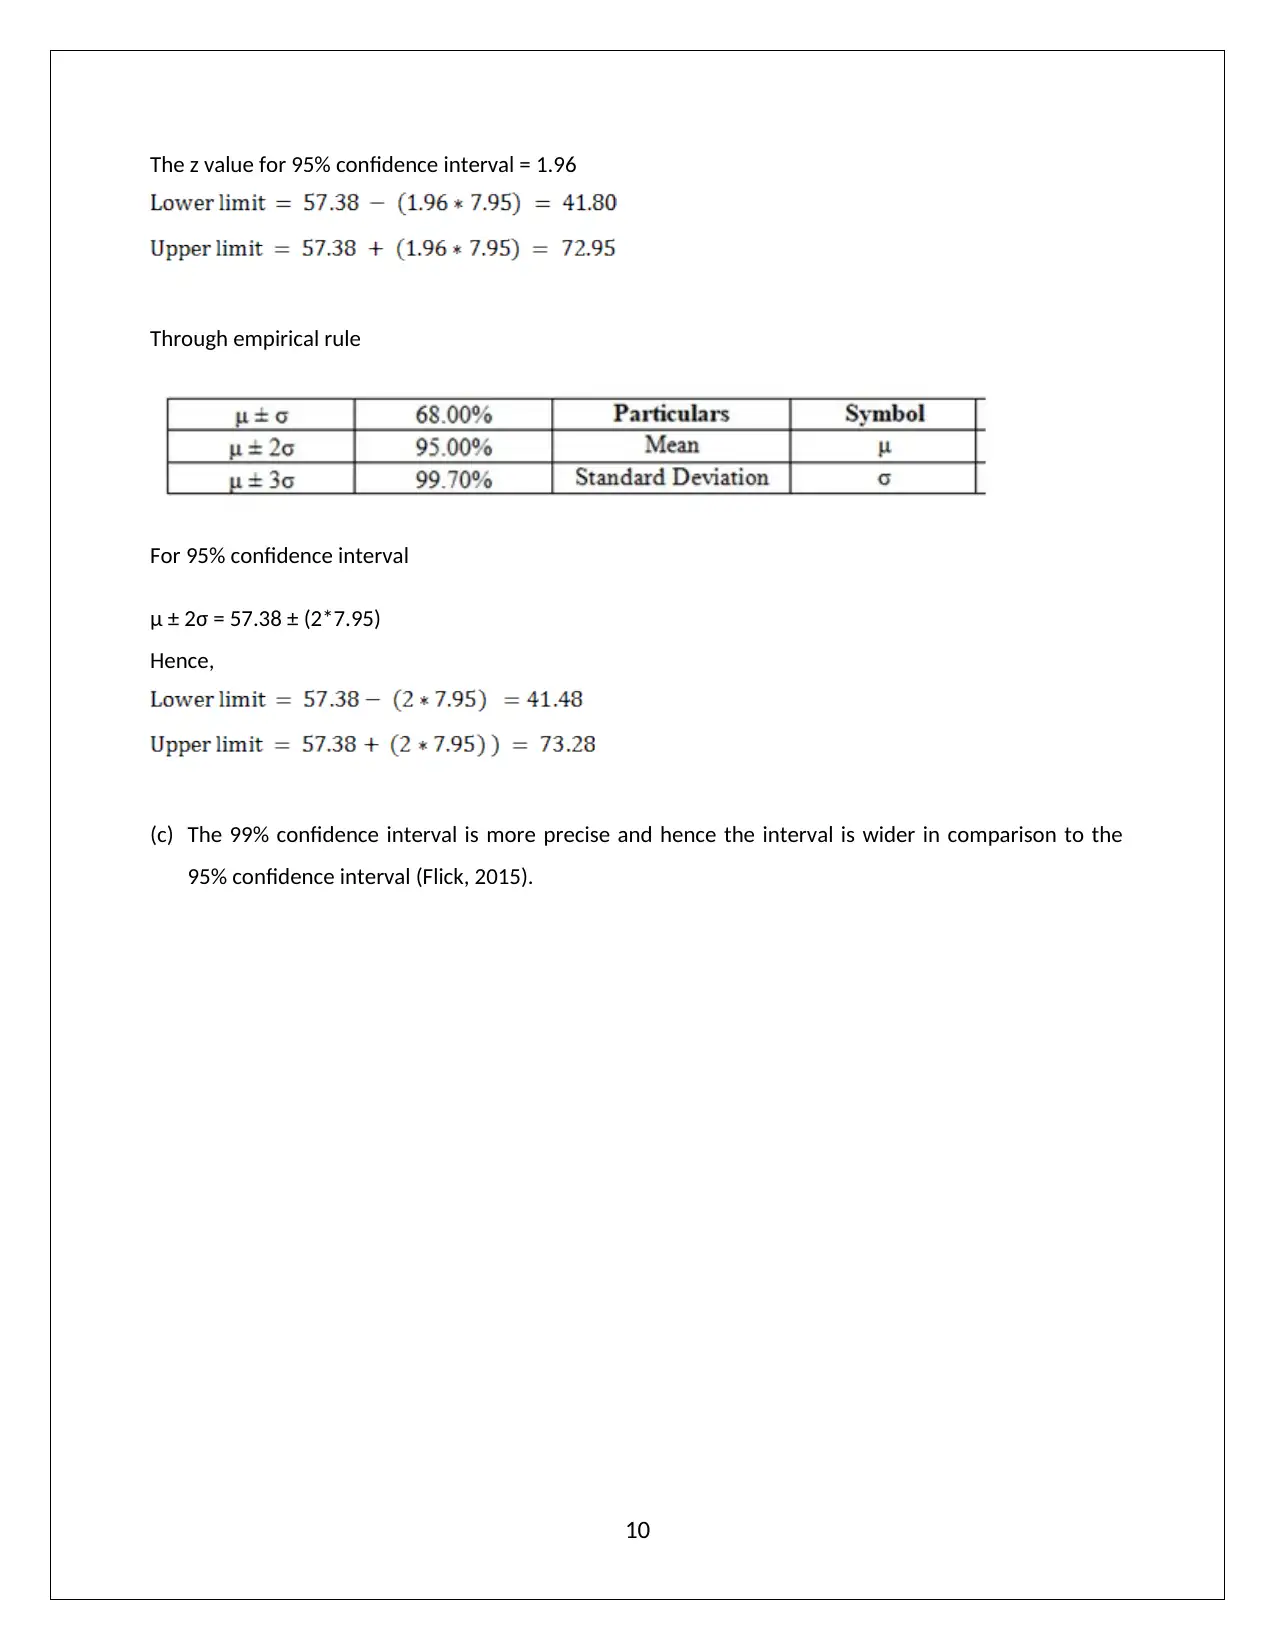
This document provides a comprehensive solution to a Business Statistics BB108 assignment, covering various statistical concepts and their application. The solution includes frequency column charts and pie charts for data representation, descriptive statistics, percentile calculations, and confidence interval estimations. It analyzes data related to age groups, occupations, and income levels, providing interpretations based on statistical measures such as mean, median, standard deviation, and interquartile range. The assignment also addresses the normality of data distributions and outlier detection. Additionally, the document calculates and interprets confidence intervals for population means, offering insights into the precision and appropriateness of these estimates. The analysis utilizes both manual calculations and references to statistical literature to support the findings. Desklib offers a wide array of study resources, including past papers and solved assignments to aid students in their academic endeavors.

1 out of 12
Related Documents


Your All-in-One AI-Powered Toolkit for Academic Success.
+13062052269
info@desklib.com
Available 24*7 on WhatsApp / Email
![[object Object]](/_next/static/media/star-bottom.7253800d.svg)
Copyright © 2020–2026 A2Z Services. All Rights Reserved. Developed and managed by ZUCOL.