FINA 600: Capital Structure and Dividend Policy of Bendigo Bank
VerifiedAdded on 2024/05/29
|15
|3451
|337
Report
AI Summary
This finance assignment provides a detailed analysis of Bendigo Bank's capital structure and dividend policy. It examines the bank's debt and equity components, calculates the cost of common and preferred equity, identifies sources of debt, and determines before-tax and after-tax costs of debt, along with the weighted average cost of capital. Furthermore, the report analyzes Bendigo Bank's dividend payments over the past three years, calculates dividend payout ratios and dividend yields, identifies the company's dividend payout policy, assesses the market signal provided by dividend payments, and evaluates the dividend policy in relation to industry practices. The analysis utilizes data from Bendigo Bank's annual reports to provide a comprehensive overview of its financial strategies.

FINA 600 – Managing Finance
1
1
Paraphrase This Document
Need a fresh take? Get an instant paraphrase of this document with our AI Paraphraser

Contents
Introduction:....................................................................................................................................3
Capital Structure:.............................................................................................................................4
Capital structure...........................................................................................................................4
Cost of common equity and (if any) preferred equity:................................................................5
Sources of debt:...........................................................................................................................7
Before-tax and after-tax cost of debt:..........................................................................................9
Weighted average cost of capital.................................................................................................9
Dividend Policy:............................................................................................................................10
1. Report the dividend payments over the last three years........................................................10
2. Calculate the dividend pay-out and dividend yield...............................................................10
3. Identify a dividend pay-out policy that the company follows...............................................11
4. Comment whether the dividend payment of the company is providing a signal to the market.
...................................................................................................................................................11
5. Evaluate the dividend policy of this company in terms of the industry practice...................12
Conclusion:....................................................................................................................................13
References:....................................................................................................................................14
2

Introduction:
The finance assignment has been prepared in order to gives users a thorough understanding about
the various capital structures maintained in the company. The first part of the report will include
a description about the debt and equity amount concerned with the capital structure by
recognizing the annual reports of the company. The information about each of the elements and
cost of common equity and the preferred stock if maintained in the company will be calculated in
this report. The various sources of debt which have been utilized to raise this capital along with
the before tax and after tax cost of capital and the weighted average cost of capital will; be
calculated. The second part of the report will be concerned with dividend policy of the company.
The dividend policy of the company along with the dividend payout ratio will be calculated and
the dividend payment and policy will be compared and analysed in context of the industrial
policy and the competitor in the industry.
3
⊘ This is a preview!⊘
Do you want full access?
Subscribe today to unlock all pages.
Trusted by 1+ million students worldwide

Capital Structure:
Capital structure
The capital structure of the company is created by two basic words which include capital that is
the funds which have been invested in the business of company and structure which means the
arrangement of various components in a proper proportion that will constitute the finances for
company. The company can raise its capital form different sources of funds which can be in the
form of owned capital or the borrowed one (Allen, et. al., 2015). The decision about the capital
structure of the company represents the proportion of owned capital to be raised in the company.
The capital structure in respect for Bendigo limited is provided below:
Particulars Book Value
2017 (in dollar
million)
2016 (in dollar
million)
2015 (in dollar
million)
Debt 63770.7 61400.5 58856.6
Borrowings 63580.9 61172 58633.9
Provisions 130.8 116.7 114.7
Deferred income 0 0 0
Derivatives 59 111.8 108
Equity 5425.6 5115.3 4941.7
Contributed equity 4,448.70 4,288.20 4,223.60
Retained earnings 864.6 739.2 623.1
Reserves 112.3 87.9 95
4
Paraphrase This Document
Need a fresh take? Get an instant paraphrase of this document with our AI Paraphraser
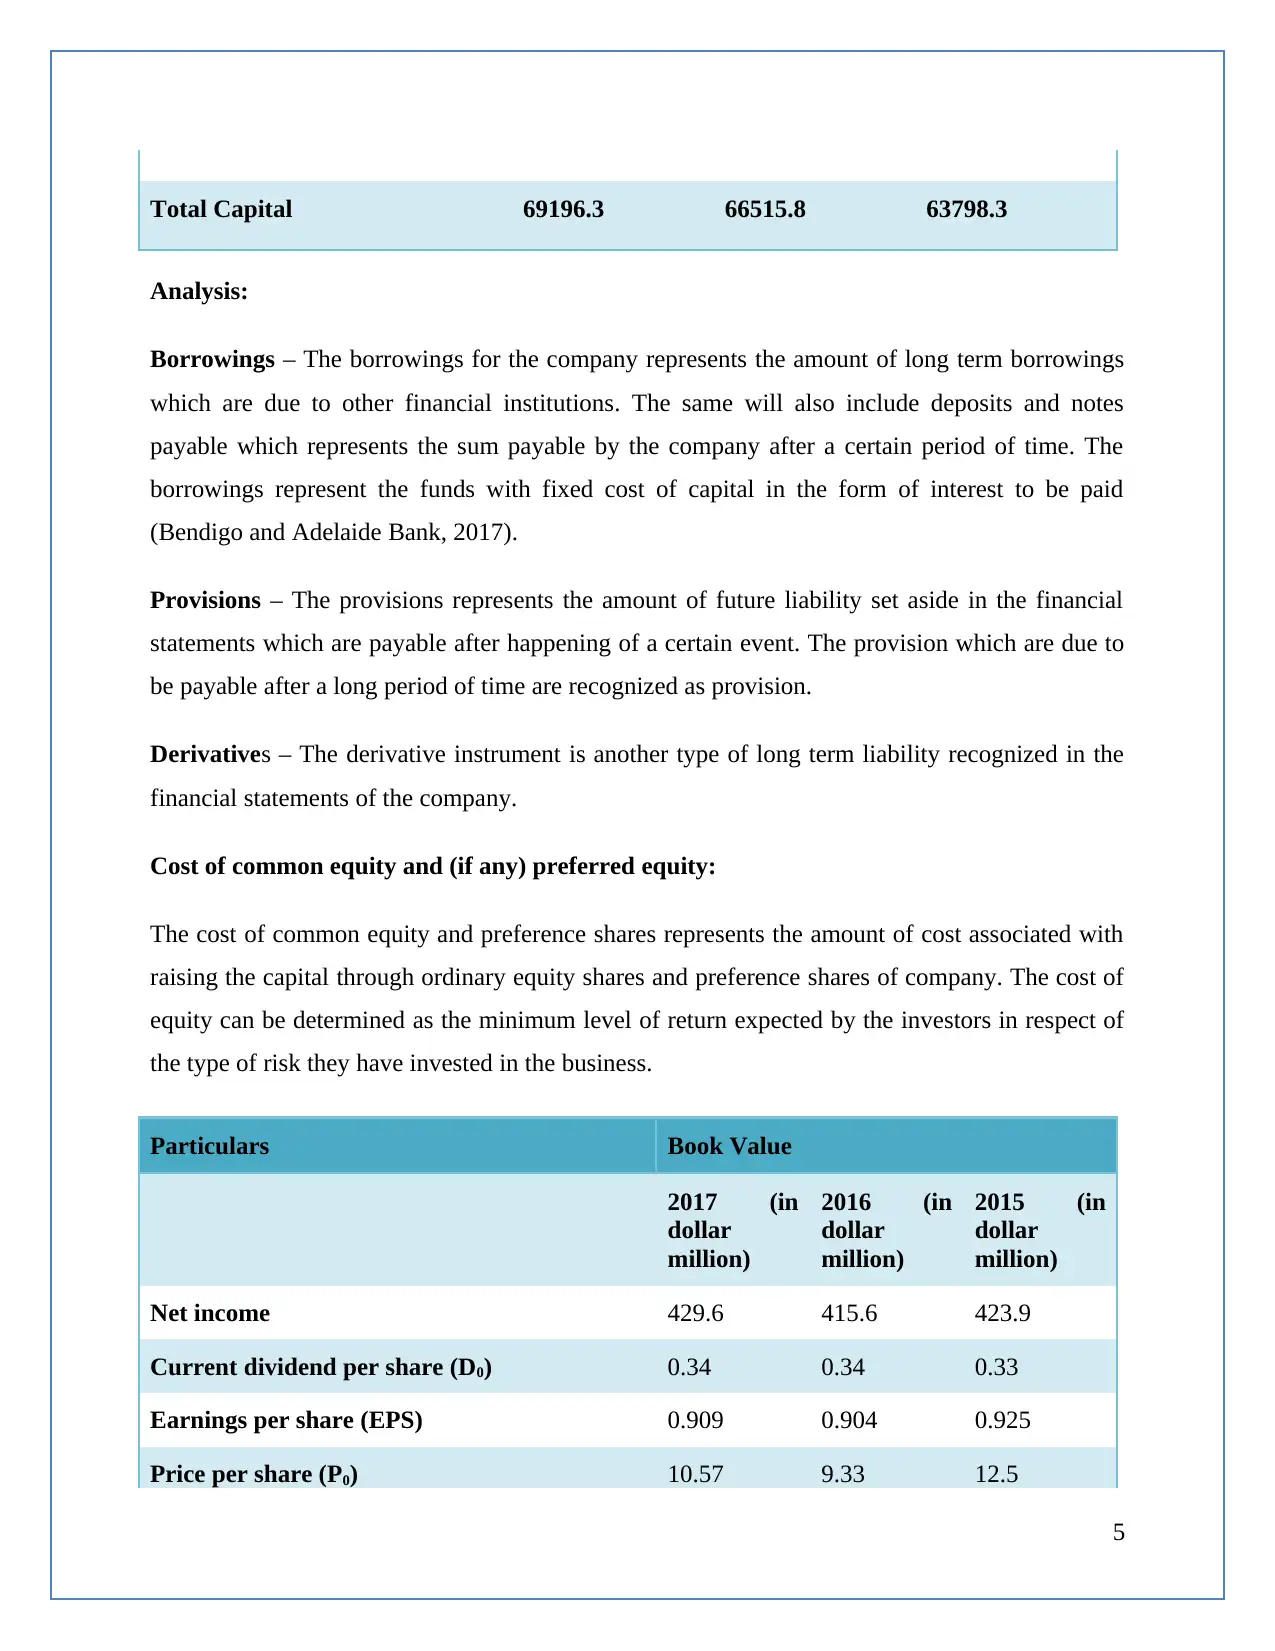
Total Capital 69196.3 66515.8 63798.3
Analysis:
Borrowings – The borrowings for the company represents the amount of long term borrowings
which are due to other financial institutions. The same will also include deposits and notes
payable which represents the sum payable by the company after a certain period of time. The
borrowings represent the funds with fixed cost of capital in the form of interest to be paid
(Bendigo and Adelaide Bank, 2017).
Provisions – The provisions represents the amount of future liability set aside in the financial
statements which are payable after happening of a certain event. The provision which are due to
be payable after a long period of time are recognized as provision.
Derivatives – The derivative instrument is another type of long term liability recognized in the
financial statements of the company.
Cost of common equity and (if any) preferred equity:
The cost of common equity and preference shares represents the amount of cost associated with
raising the capital through ordinary equity shares and preference shares of company. The cost of
equity can be determined as the minimum level of return expected by the investors in respect of
the type of risk they have invested in the business.
Particulars Book Value
2017 (in
dollar
million)
2016 (in
dollar
million)
2015 (in
dollar
million)
Net income 429.6 415.6 423.9
Current dividend per share (D0) 0.34 0.34 0.33
Earnings per share (EPS) 0.909 0.904 0.925
Price per share (P0) 10.57 9.33 12.5
5
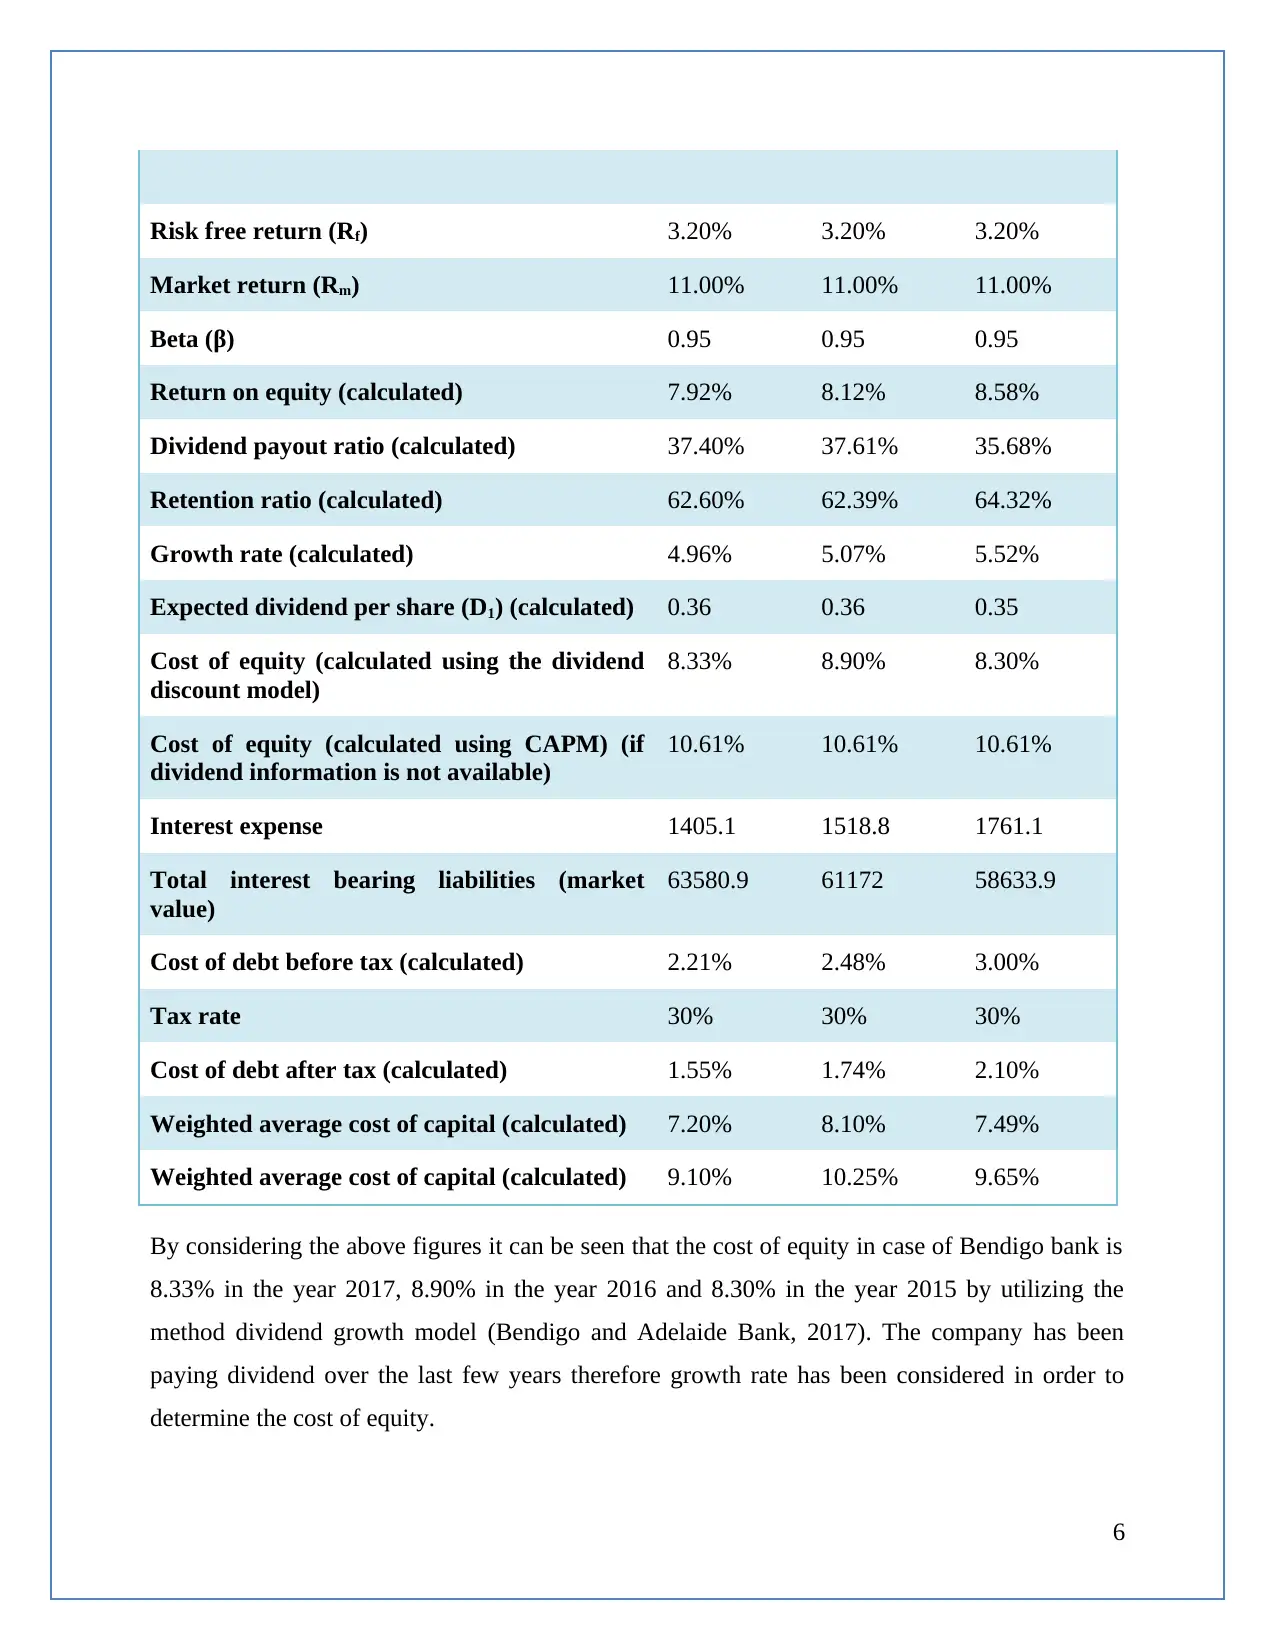
Risk free return (Rf) 3.20% 3.20% 3.20%
Market return (Rm) 11.00% 11.00% 11.00%
Beta (β) 0.95 0.95 0.95
Return on equity (calculated) 7.92% 8.12% 8.58%
Dividend payout ratio (calculated) 37.40% 37.61% 35.68%
Retention ratio (calculated) 62.60% 62.39% 64.32%
Growth rate (calculated) 4.96% 5.07% 5.52%
Expected dividend per share (D1) (calculated) 0.36 0.36 0.35
Cost of equity (calculated using the dividend
discount model)
8.33% 8.90% 8.30%
Cost of equity (calculated using CAPM) (if
dividend information is not available)
10.61% 10.61% 10.61%
Interest expense 1405.1 1518.8 1761.1
Total interest bearing liabilities (market
value)
63580.9 61172 58633.9
Cost of debt before tax (calculated) 2.21% 2.48% 3.00%
Tax rate 30% 30% 30%
Cost of debt after tax (calculated) 1.55% 1.74% 2.10%
Weighted average cost of capital (calculated) 7.20% 8.10% 7.49%
Weighted average cost of capital (calculated) 9.10% 10.25% 9.65%
By considering the above figures it can be seen that the cost of equity in case of Bendigo bank is
8.33% in the year 2017, 8.90% in the year 2016 and 8.30% in the year 2015 by utilizing the
method dividend growth model (Bendigo and Adelaide Bank, 2017). The company has been
paying dividend over the last few years therefore growth rate has been considered in order to
determine the cost of equity.
6
⊘ This is a preview!⊘
Do you want full access?
Subscribe today to unlock all pages.
Trusted by 1+ million students worldwide

Sources of debt:
Bank loan = The bank loan represents the amount of money which has been borrowed for a
certain period of time by the company with an agreed repayment schedule as determined by the
bank. The repayment of the bank loan will significantly depend on the size and duration of the
loan for which it has been taken and the rate on interest associated. The bank loans are obtained
by the company depending on their reputation among the general public and it the eyes of the
bank (Graham, et. al., 2015). There is a fixed or variable rate on interest associated with this type
of financing. It can be observed that many businesses utilize these bank loans as a part of their
capital structure. The advantages and disadvantages are as under:
Advantages Disadvantages
It provides adequate facility of funding
arrangements of the company
The basic disadvantage associated with this
type of financing is to obtain the loan form the
bank as it is a very complex process (Allen, et.
al., 2015).
The working capital requirement of the
company gets fulfilled by this type of
financing.
The costs of bank loans are generally very high
for the company.
Bonds and debentures = Binds and debentures issued by the company are the major source of
long term finance utilized by the company in order to fulfil their long tern funding requirements.
This type of financing generally carries a fixed rate of interest payments to be made periodically
by the company and the borrowed amount is repaid either in instalments or in lump sum after a
certain point of time (Faccio & Xu, 2015). This represents a more secured form of investing in
company in comparison to the equity shares of the company. There is a surety regarding the
interest payments to be made by the company timely and adequately.
7
Paraphrase This Document
Need a fresh take? Get an instant paraphrase of this document with our AI Paraphraser

Advantages Disadvantages
The source of funding is suitable for the
company as the interest payments made in this
source are deductible as a tax expense for the
company and therefore tax advantage is
received by the company.
The source of financing creates a rigid
obligation on the company to pay interest after
a regular period of time.
There is no dilution of control associated with
this source of financing in the company. The
debenture holders and bondholders regularly
receive the interest payment in consideration.
The raising of funds through debentures and
bonds enlarges the leverage ratios and this
proves to be a major loss for the company
(Véron & Wolff, 2016).
Long term debt = The long term debt can be a major source of finance for the company in
which the financial institutions and funding agencies provides long term debt with fixed interest
payments to be made. The duration of the debt can extend depending on the requirement of the
company and the adequate financing can be obtained in this behalf.
Advantages Disadvantages
The source of financing is suitable large
companies and it helps in conserving the
operational cash flows of company in order to
provide highest advantages.
The long term loans are very complex to obtain
and requites heavy regulatory requirements to
be fulfilled.
The leverage position of the company gets
optimal after preserving this type of financing
and the cost of capital is minimum.
The failure in payments of the interest
obligation can bring company towards legal
trouble (Graham, et. al., 2015).
8

Before-tax and after-tax cost of debt:
The cost of debt can be defined as the interest obligation payable by the company on the amount
of borrowings obtained. The after tax cost of debt is calculated after considering the effect of tax
rates applied by the company. The before tax cost of debt can be calculated not considering the
tax implication applicable on the company (Zeitun & Tian, 2014).
By considering the above calculation to can be observed that the corporate tax rate applicable to
the bank is 30% which is considered as the marginal taxation rate applicable on all the
companies operating in Australia. However the same tax rate can vary according to the
regulations applicable on the company. The before tax of debt for Bendigo bank comes out to be
2.21% in the year 2017, 2.48% in the year 2016 and 3% in the year 2015. However the same has
been calculated after considering the tax effect of 30% and the after tax cost of debt comes out to
be 1.55% in the year 2017, 1.74% in the year 2016 and 2.10% in the year 2015.
Weighted average cost of capital
The weighted average cost of capital represents the rate which the company is expecting to pay
in average to all the shareholders of company in order to finance its assets. The weighted average
cost of capital can also be referred s the overall cost of capital for the company. The weighted
average cost of capital is determined by the external forces and not by the internal management
of the company. The weighted average cost of capital for the year 2017 has been 7.20% for the
company (Lee, et. al., 2015). This has been calculated after considering the weights of each of
the component of equity and liabilities.
9
⊘ This is a preview!⊘
Do you want full access?
Subscribe today to unlock all pages.
Trusted by 1+ million students worldwide
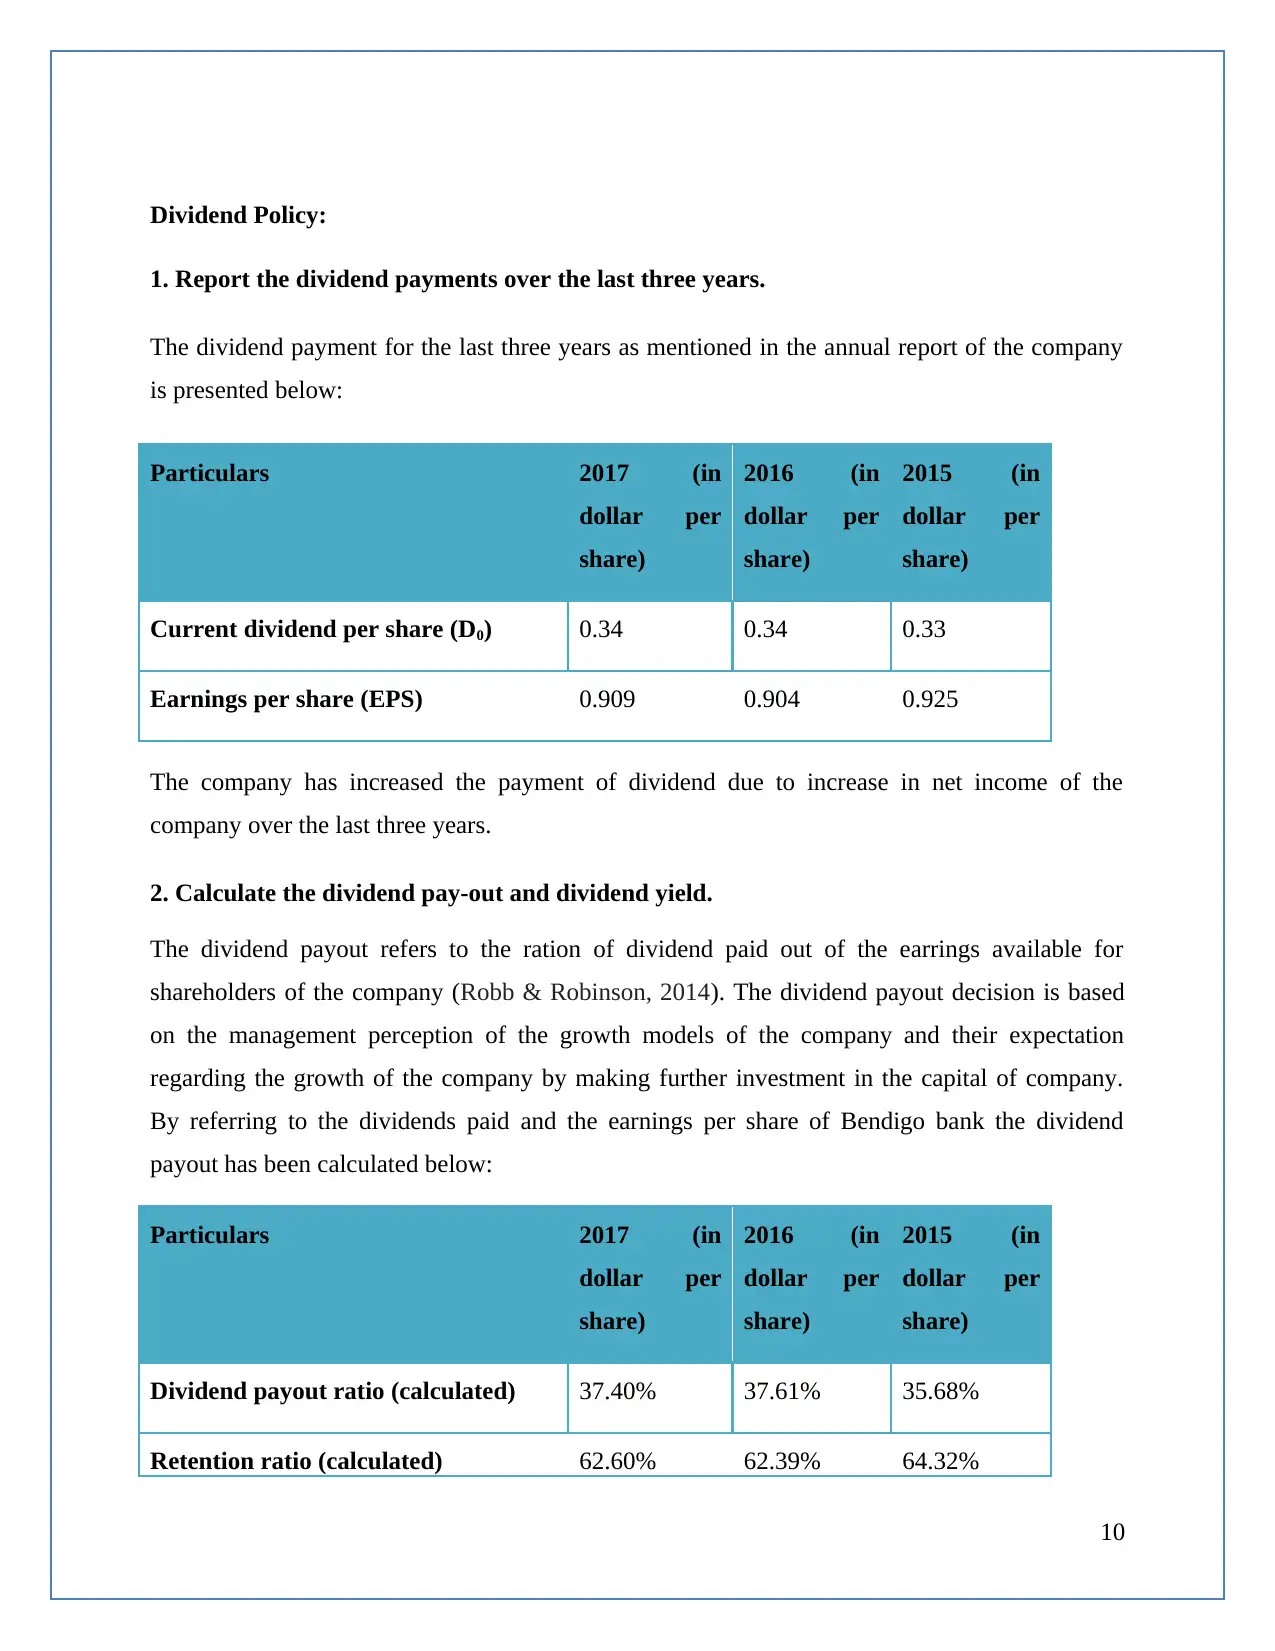
Dividend Policy:
1. Report the dividend payments over the last three years.
The dividend payment for the last three years as mentioned in the annual report of the company
is presented below:
Particulars 2017 (in
dollar per
share)
2016 (in
dollar per
share)
2015 (in
dollar per
share)
Current dividend per share (D0) 0.34 0.34 0.33
Earnings per share (EPS) 0.909 0.904 0.925
The company has increased the payment of dividend due to increase in net income of the
company over the last three years.
2. Calculate the dividend pay-out and dividend yield.
The dividend payout refers to the ration of dividend paid out of the earrings available for
shareholders of the company (Robb & Robinson, 2014). The dividend payout decision is based
on the management perception of the growth models of the company and their expectation
regarding the growth of the company by making further investment in the capital of company.
By referring to the dividends paid and the earnings per share of Bendigo bank the dividend
payout has been calculated below:
Particulars 2017 (in
dollar per
share)
2016 (in
dollar per
share)
2015 (in
dollar per
share)
Dividend payout ratio (calculated) 37.40% 37.61% 35.68%
Retention ratio (calculated) 62.60% 62.39% 64.32%
10
Paraphrase This Document
Need a fresh take? Get an instant paraphrase of this document with our AI Paraphraser

3. Identify a dividend pay-out policy that the company follows.
Constant dividend policy
The company has been following a constant and conservative dividend policy in which the
management is paying only one third of the earnings available to shareholders as a dividend. The
same policy has resulted in higher retention ratio for the company and the investment has been
made for future investments of the company (Lee, et. al., 2015). The dividend payout has been
maintained equally over the last few years.
4. Comment whether the dividend payment of the company is providing a signal to the
market.
Positive signalling responses by the shareholders
By going through the calculations in capital structure market it can be taken that the bank has
been calculating the dividend share at the rate of .95 dollar per share but due to considerate
increase in the value of contributed equity, retained earnings and reserves and also the value of
borrowings and provisions it can be said that over the period of 2015 to 2017 the value of debt
which was earlier paid at .95 dollars is now taken as .34dollars per share. This is mainly due to
the fact of dividend reinvestment plan, by which the company is giving the platform to the
shareholders to reinvest their dividend amount into new shares. By doing so the rank of new
shares are considered equal to the ordinary shares (Robb & Robinson, 2014).
This has been helping banks also to attract more customers also towards the profitable
investment schemes, so that this can be a futuristic and far sighted approach to convert potential
customer into shareholdings to the bank. In long run this can help the bank to increase the
reserves; the more investors they have the more banks can reinvest the dividends into the market.
As compared to stock investments, in these investors are not supposed to buy it from external
resources, rather dividends can be bought from same company and invested into same. Thus
there is no commission needed to be given to anyone. At the end it will just increase the value of
the investor’s portfolio.
11

5. Evaluate the dividend policy of this company in terms of the industry practice.
By taking the dividend policy of WESTPAC bank the major difference that was identified was
that the annual dividend rate here taken is .94dollars per share as compared to Bendigo which
is .95dollar per share. This decrease in the rate in Westpac is mainly because that bank is focuses
more towards retaining the maximum capital into the organization as compared to other banks in
the sector. Franking credits distribution is also considered to have maximised over the year also
bank levy cost has also been considered (Véron & Wolff, 2016). By considering the business
unit growth point of view it can be seen that capital ratio point after increasing has become
10.6% which is same as that of Bendigo thus that is a good trend being followed by Bendigo.
Dividend reinvestment plan has also being followed by this bank but the profit here considered is
more as compared to Bendigo, this is mainly due to rate of dividend taken by Bendigo is .95
while in Westpac it is .94 dollars per share, thus Westpac has 2% increase in the capital market
ratio and the dividend investment has also resulted in better results for bank as well as the
shareholders. Apart from these policies there has been considerable increase in customer
satisfaction levels. This is mainly due to keeping every demand, complaint and requirement in
mind before applying any strategy (Zeitun & Tian, 2014).
12
⊘ This is a preview!⊘
Do you want full access?
Subscribe today to unlock all pages.
Trusted by 1+ million students worldwide
1 out of 15
Related Documents


Your All-in-One AI-Powered Toolkit for Academic Success.
+13062052269
info@desklib.com
Available 24*7 on WhatsApp / Email
![[object Object]](/_next/static/media/star-bottom.7253800d.svg)
Unlock your academic potential
Copyright © 2020–2026 A2Z Services. All Rights Reserved. Developed and managed by ZUCOL.