Financial Management Report: Fortescue Metals Group Analysis

Verified

Added on  2021/05/31

|23
|2601
|23
Report
AI Summary
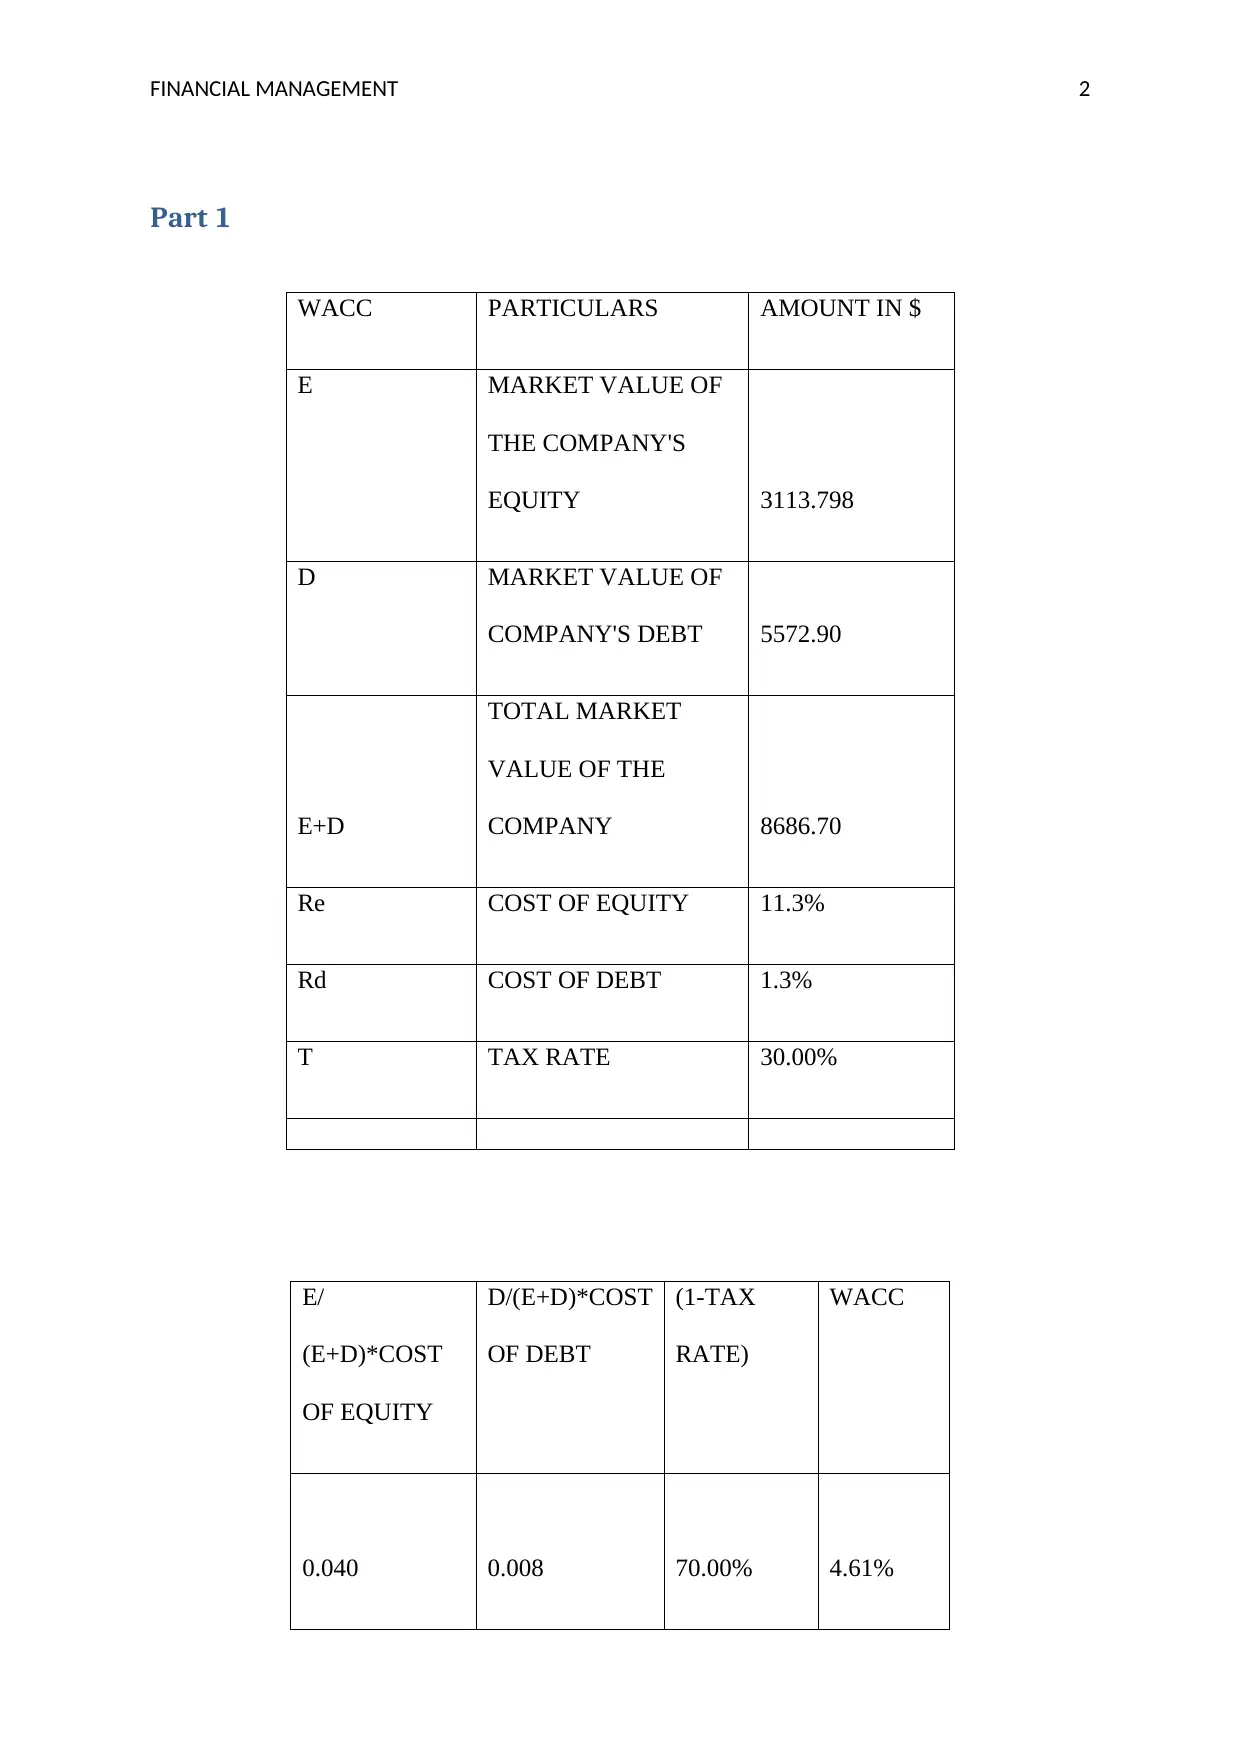
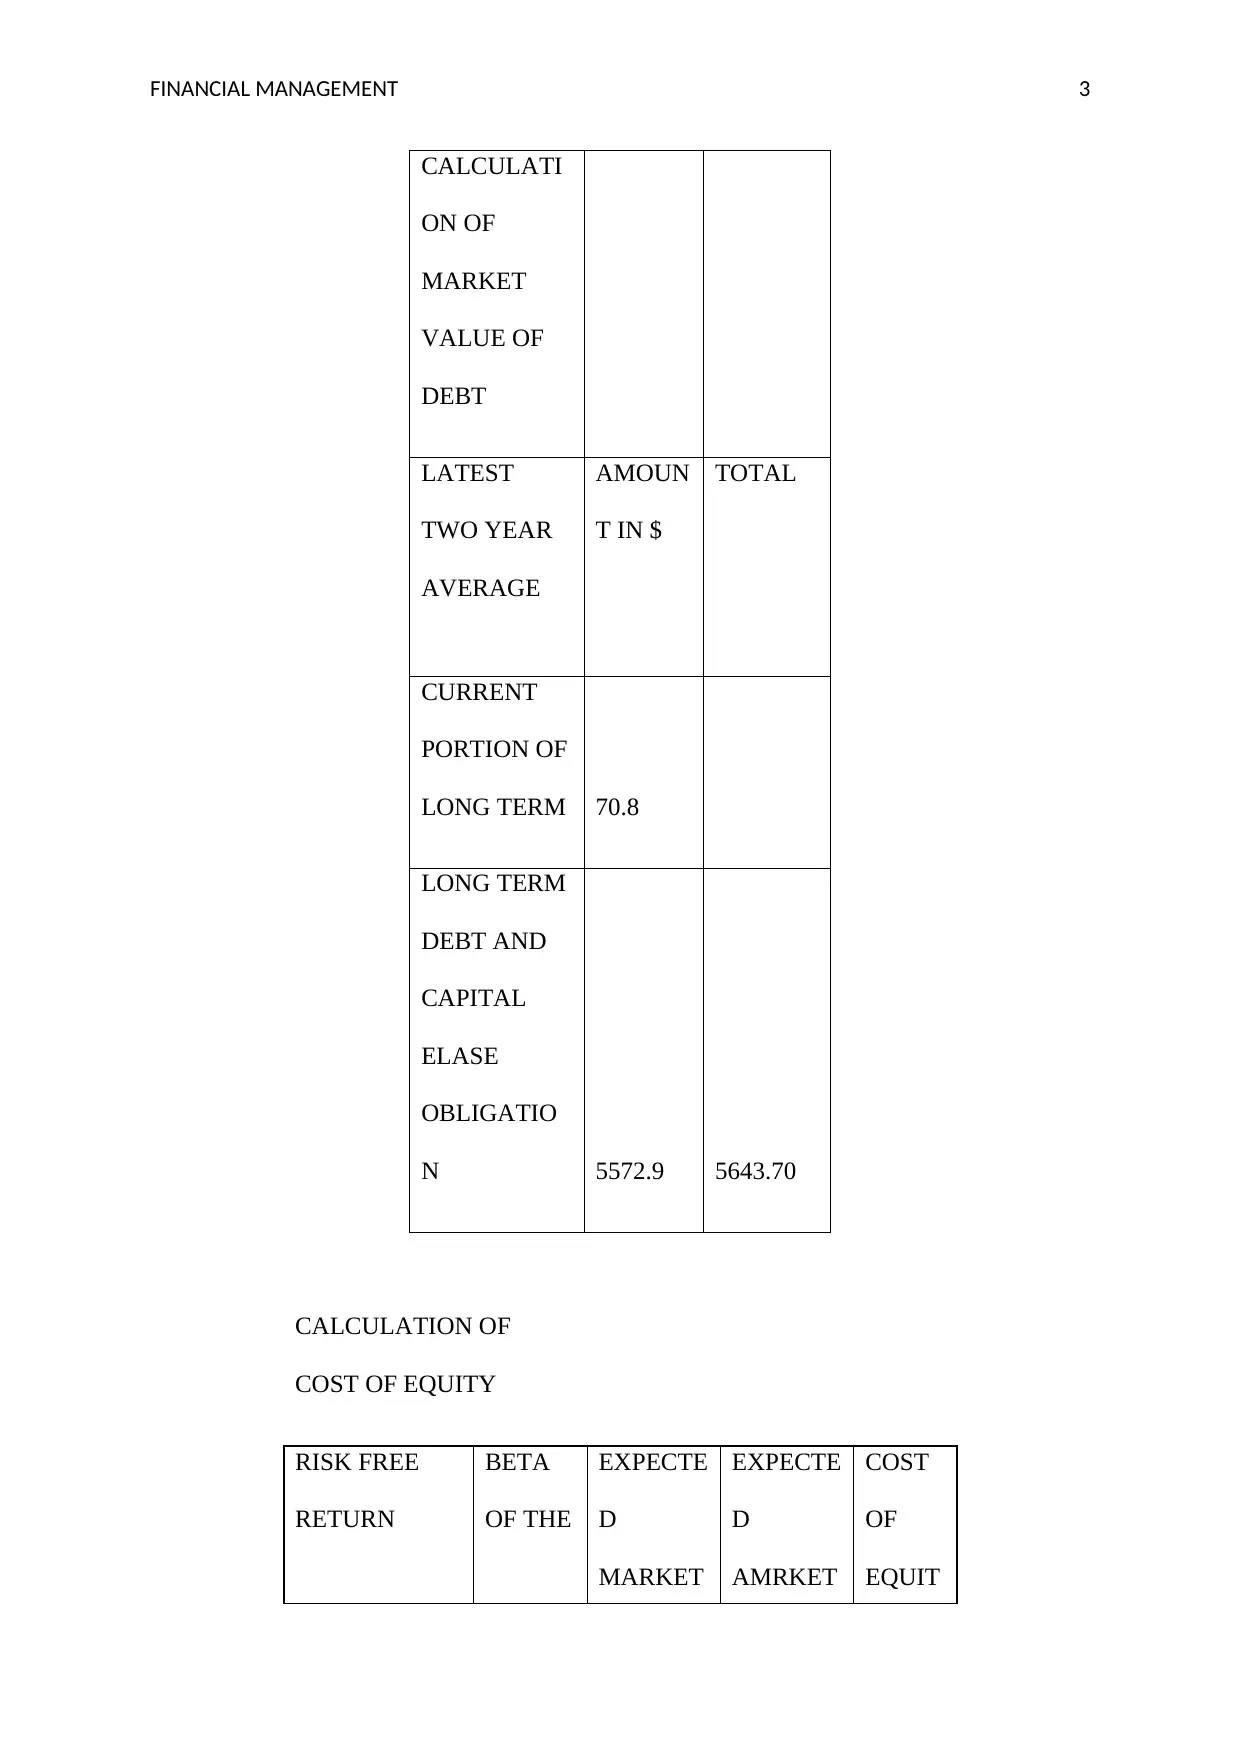
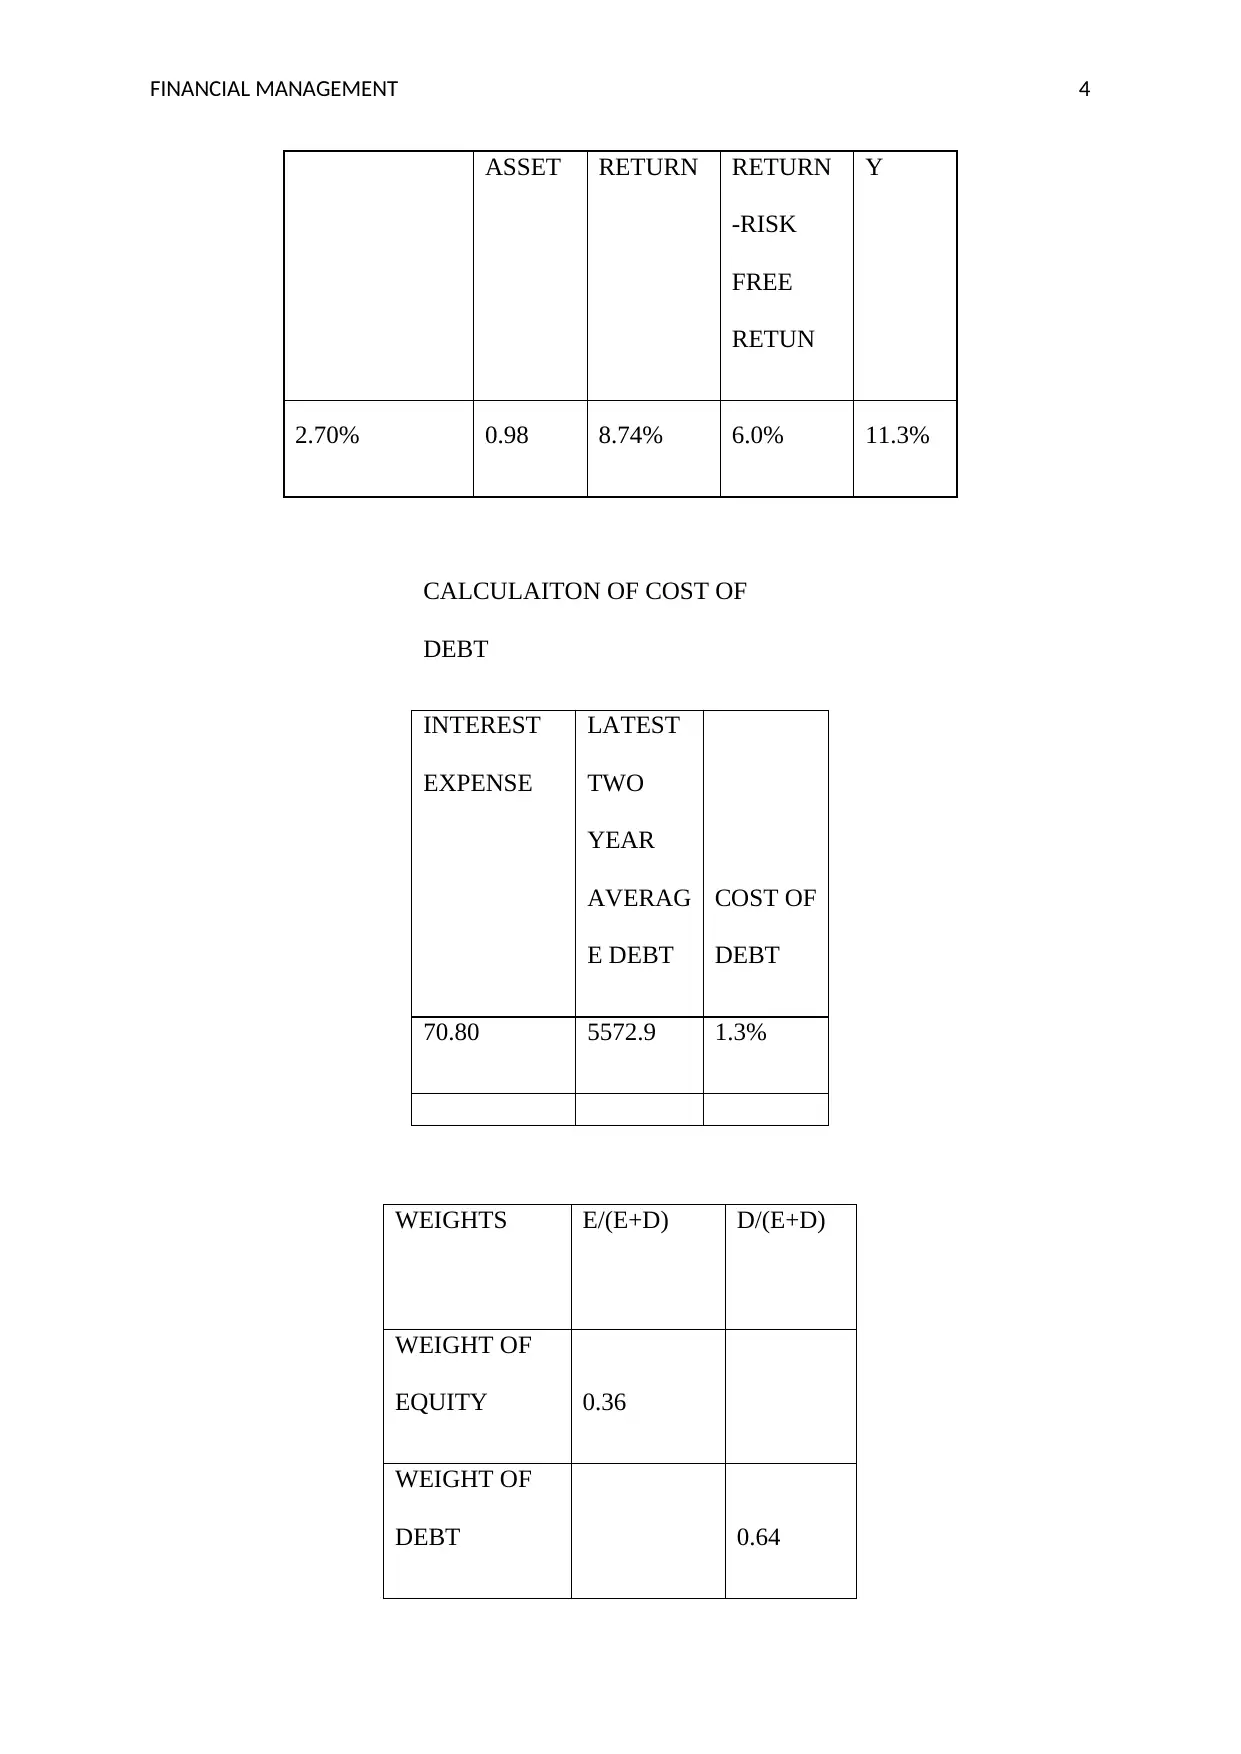
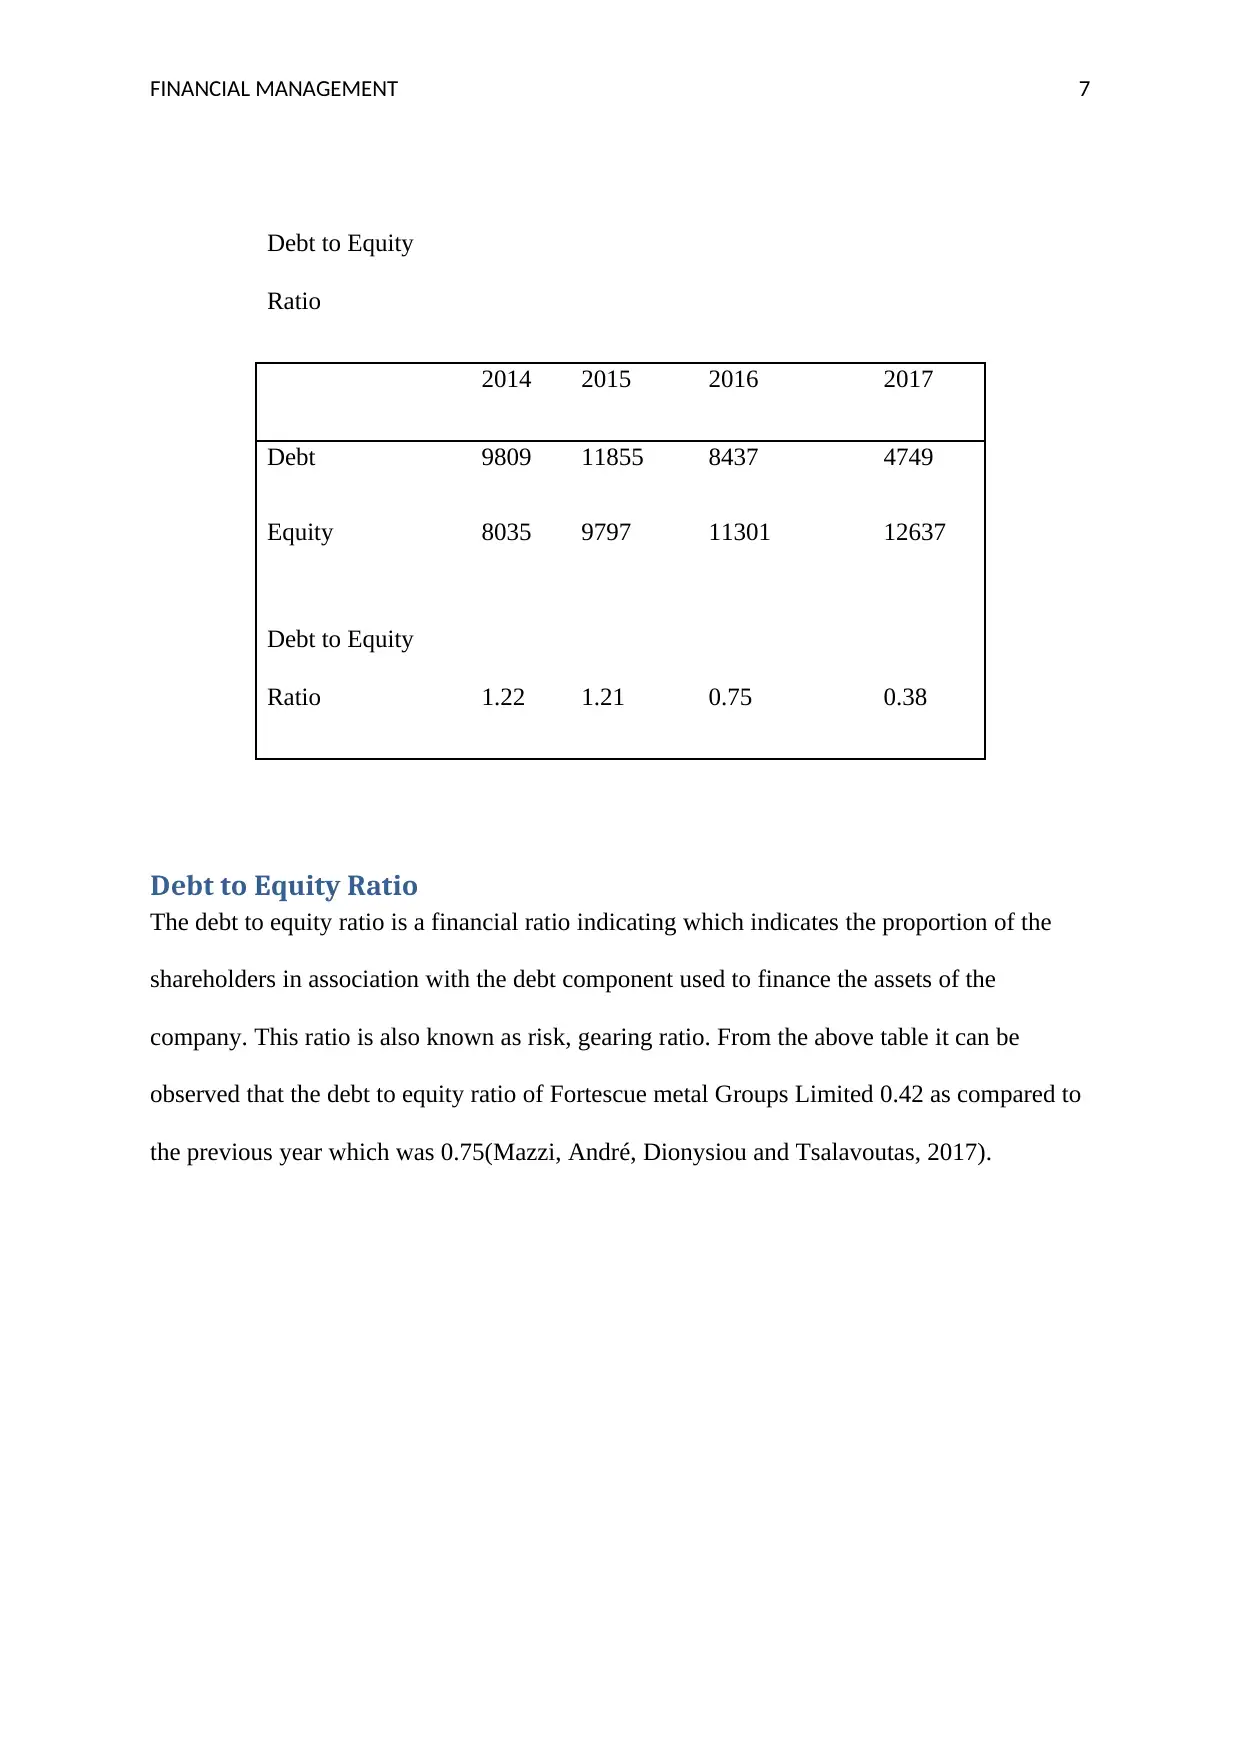
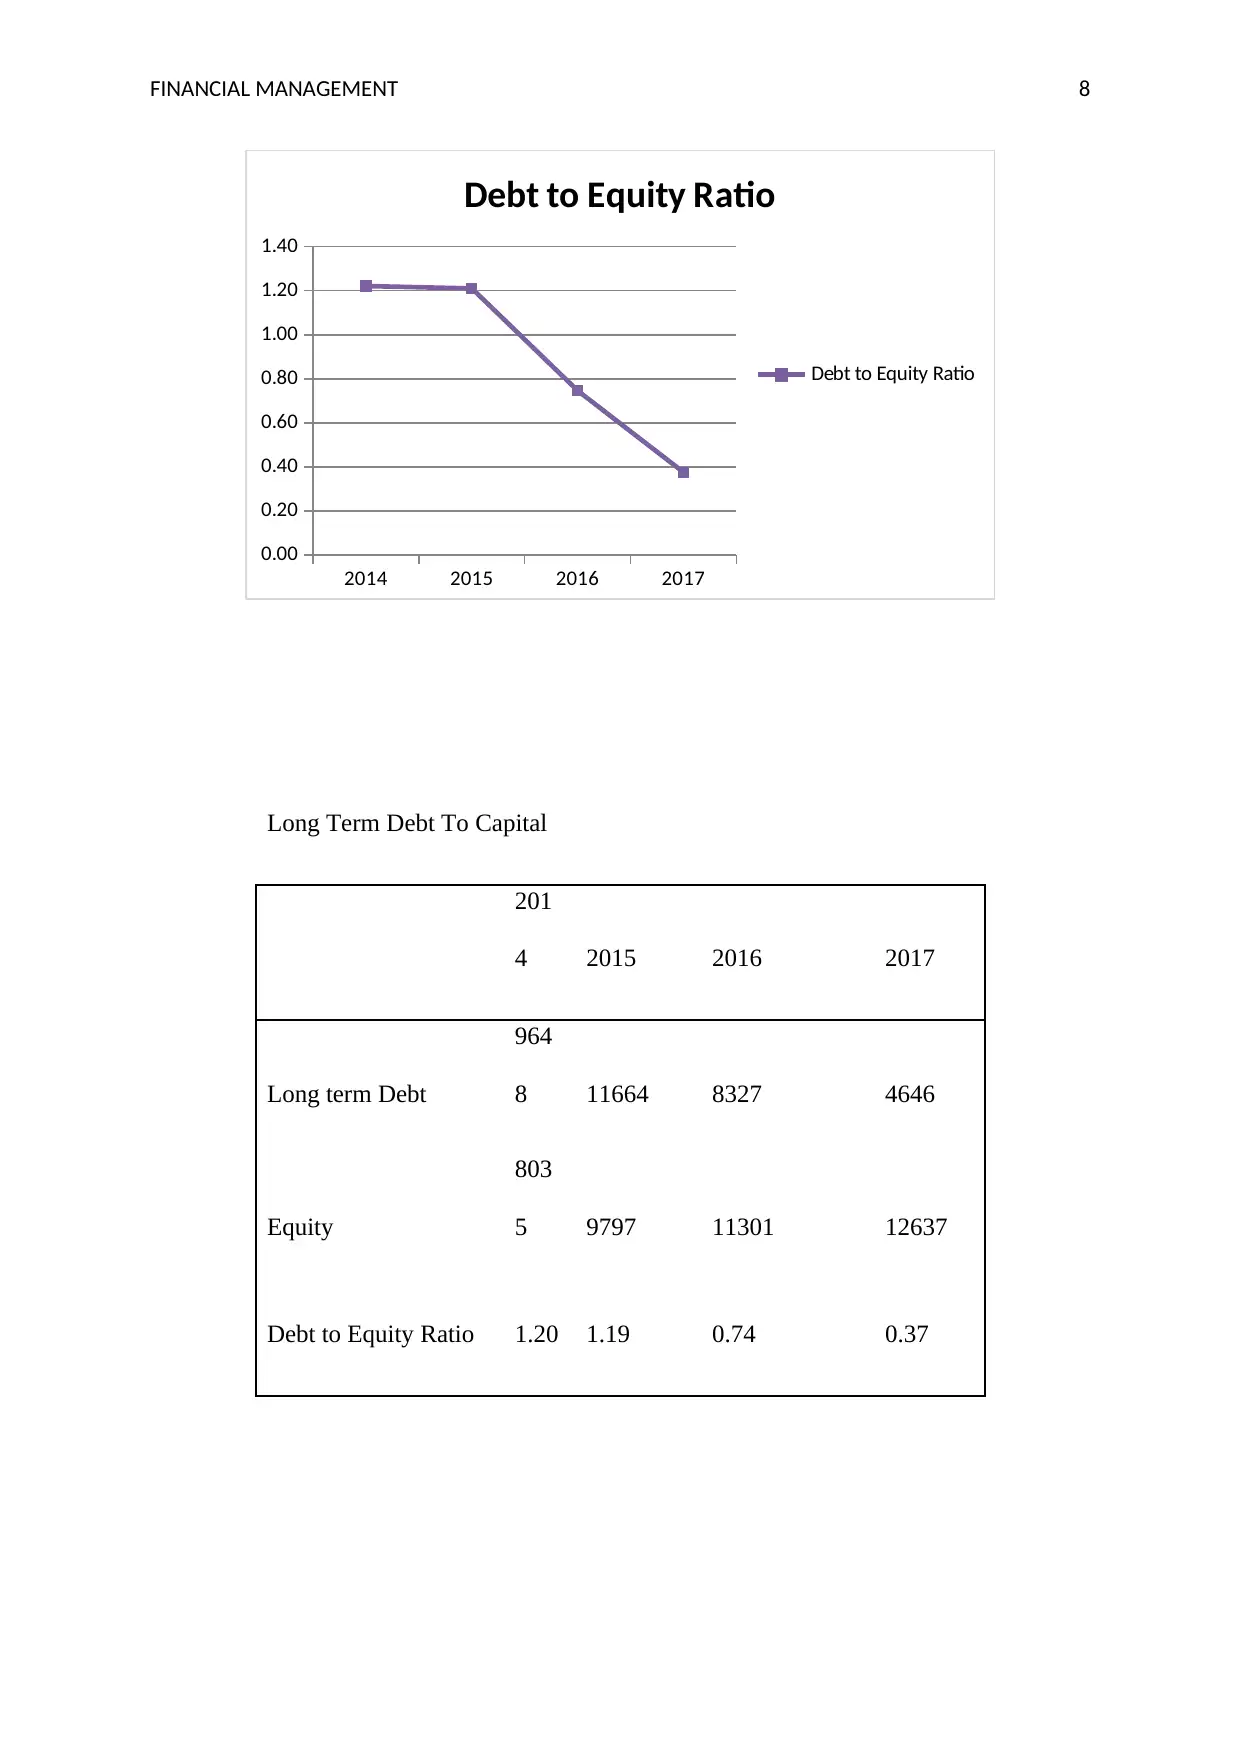
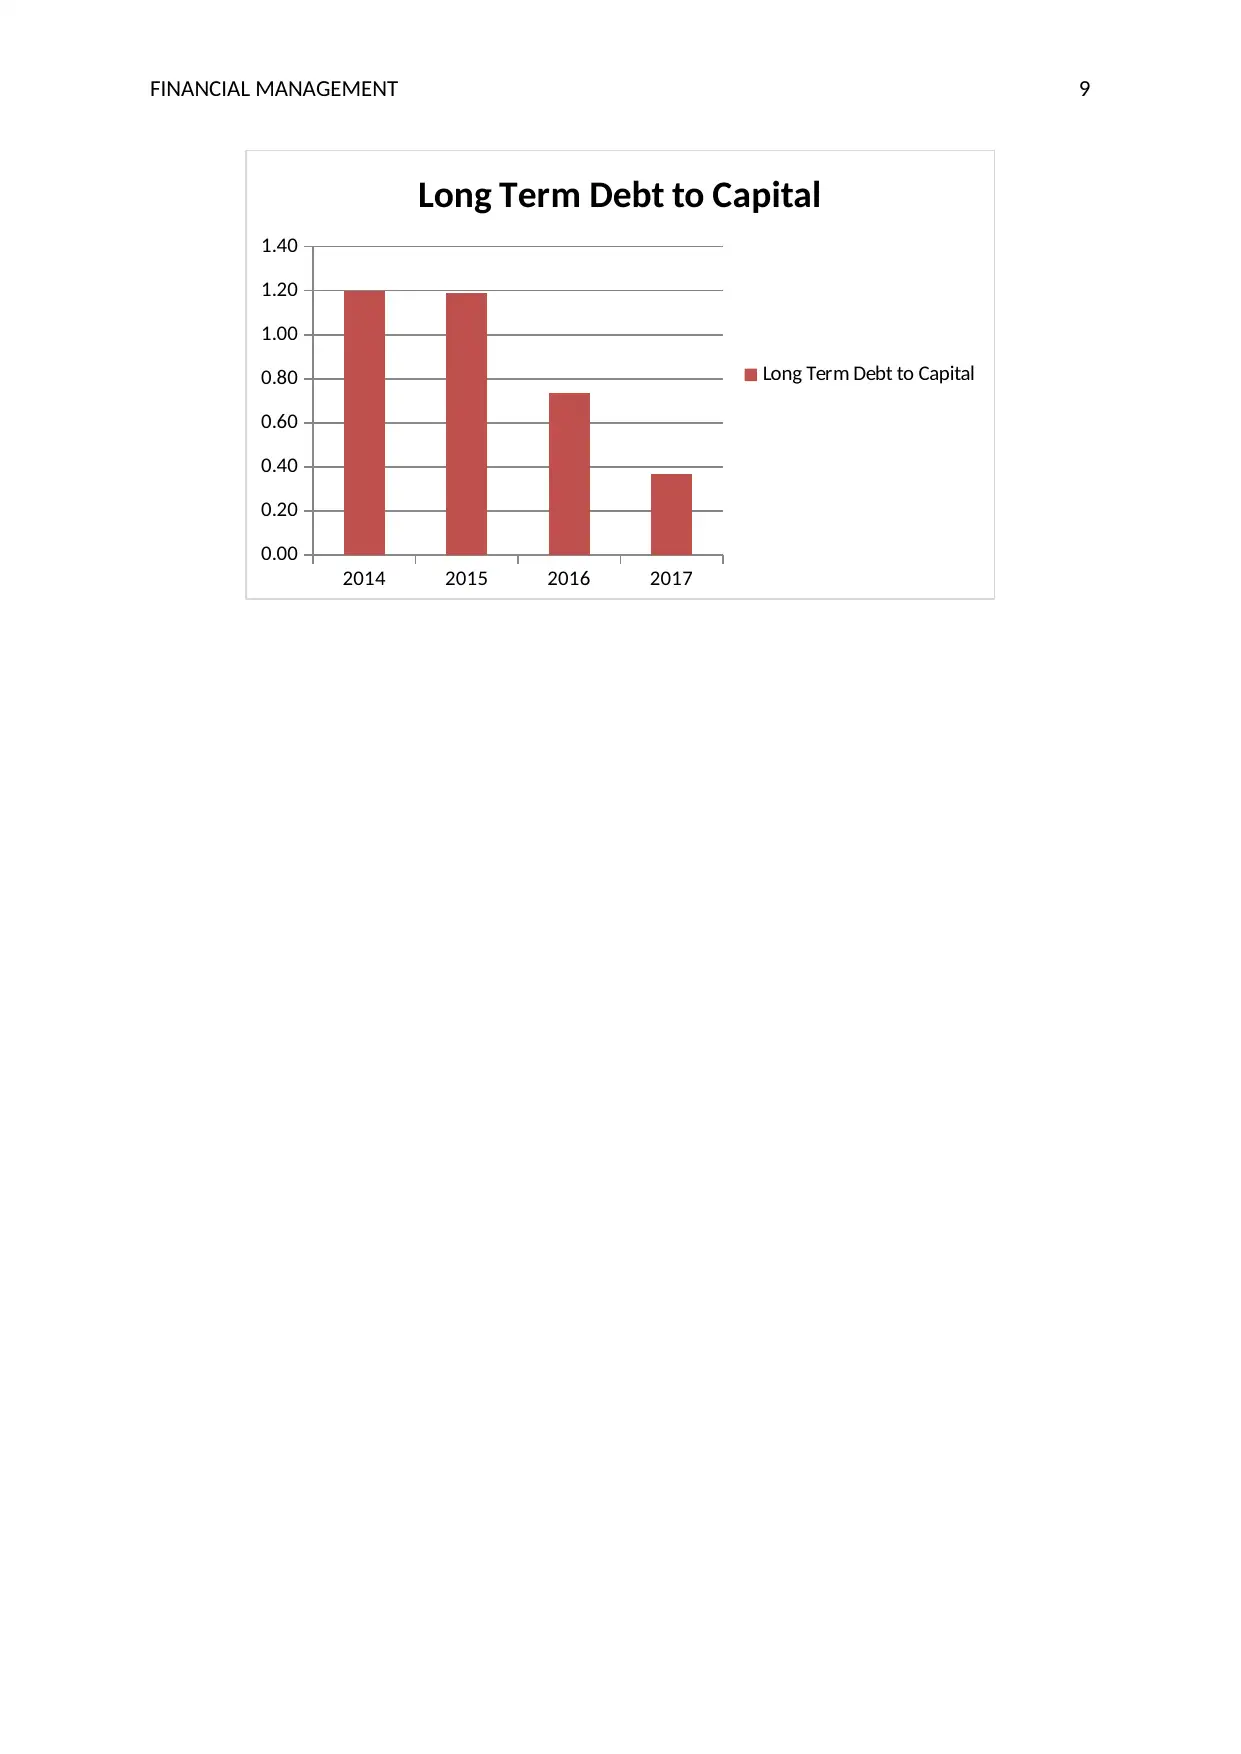
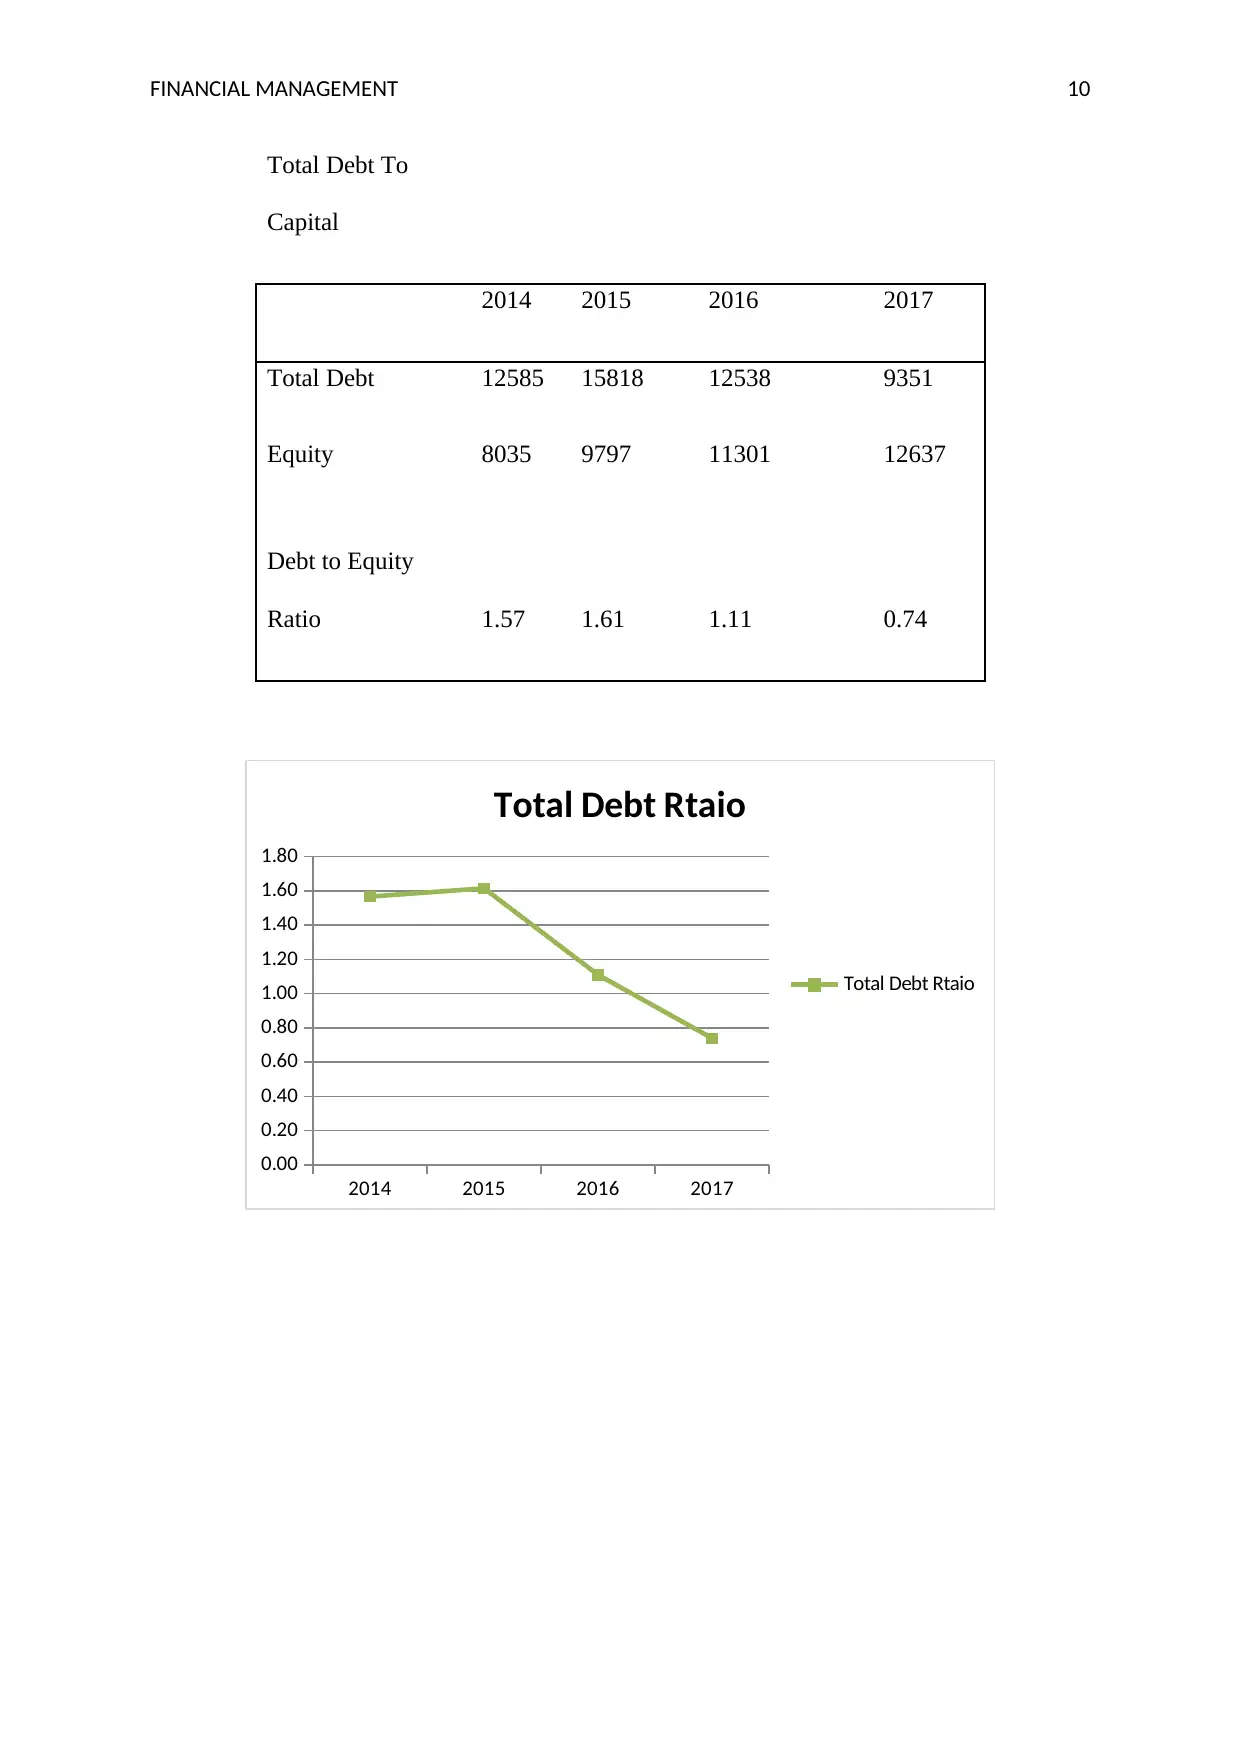
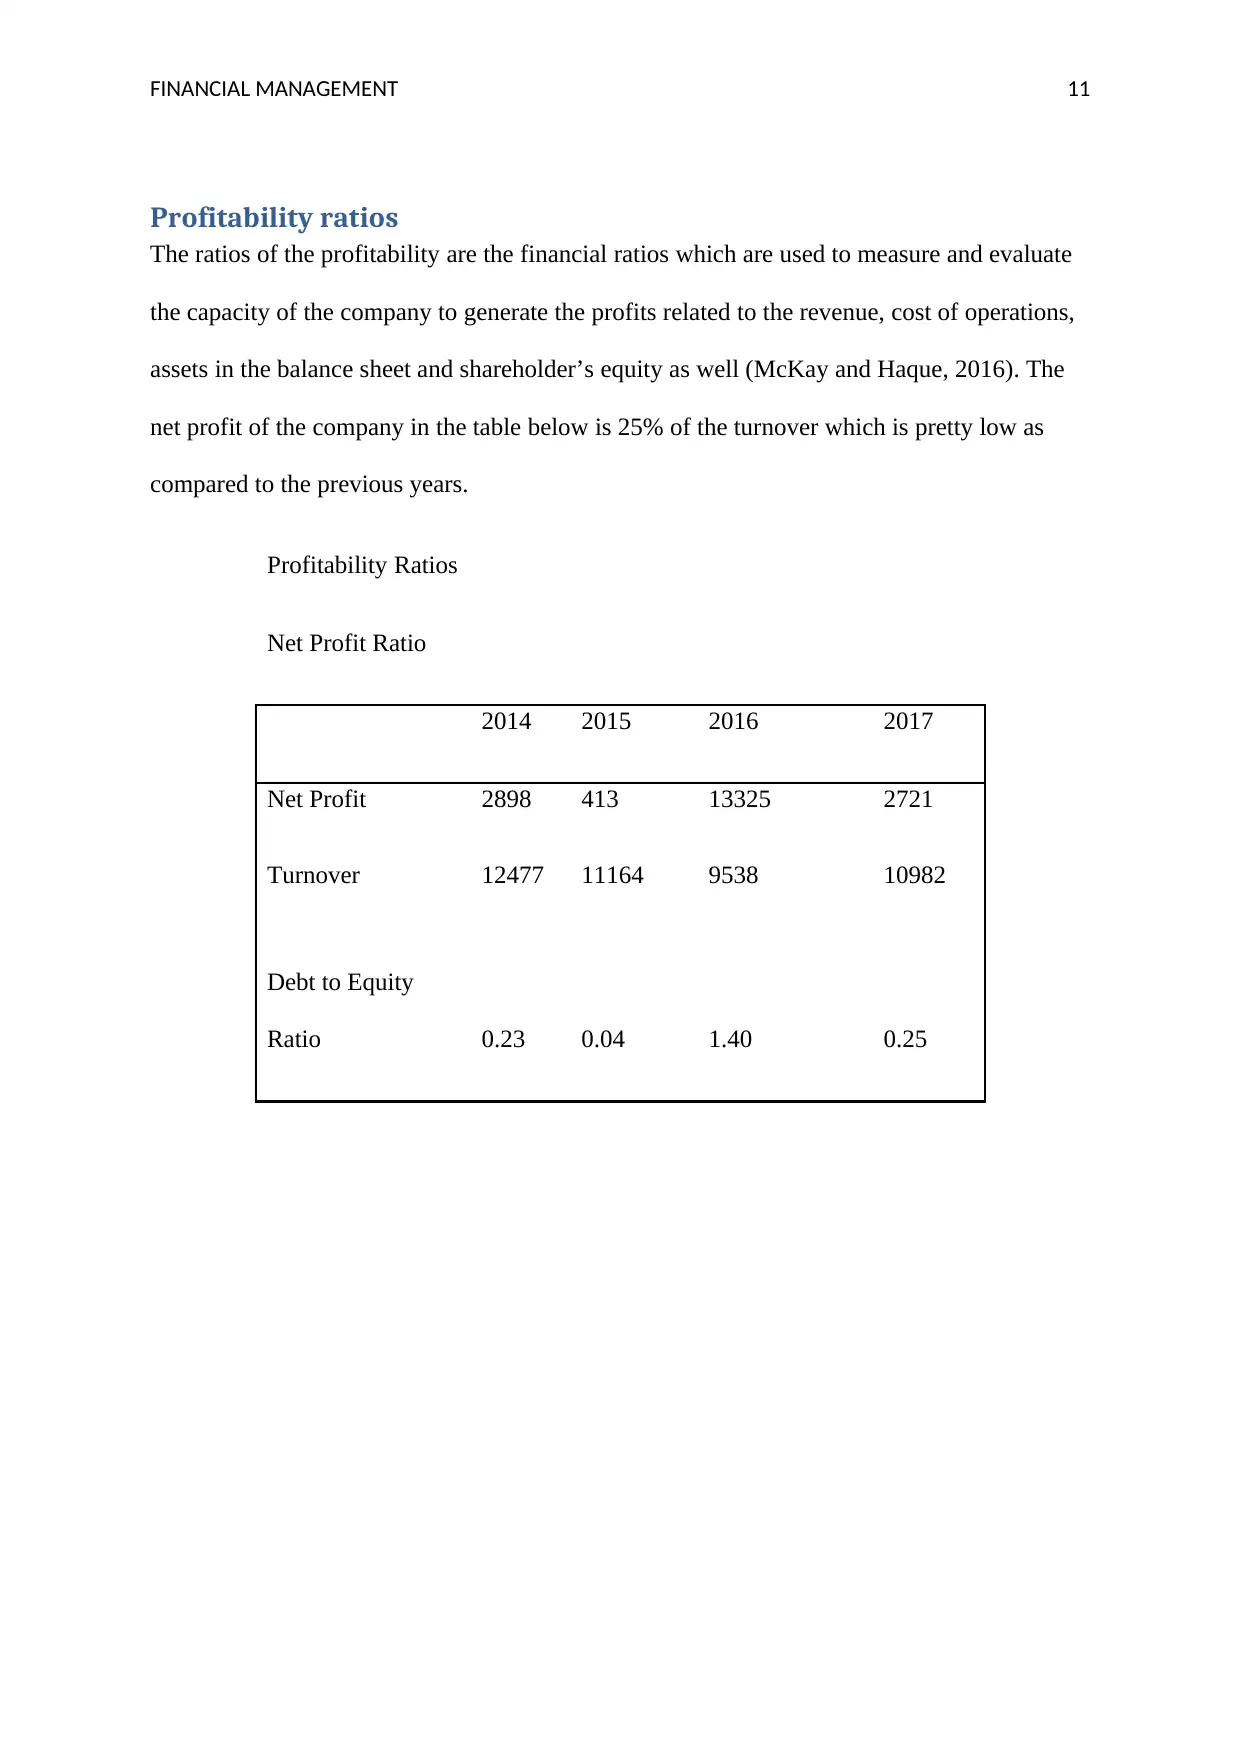
This report provides a comprehensive financial analysis of Fortescue Metals Group (FMG), covering key aspects of financial management. It begins with the calculation of the Weighted Average Cost of Capital (WACC), detailing the market value of equity and debt, cost of equity and debt, and tax rate to determine the overall WACC. The report then delves into capital structure ratios, including debt-to-equity ratios, long-term debt to capital, and total debt to capital, analyzing trends from 2014 to 2017. Working capital management policies and investment policies, particularly FMG's liberal approach, are discussed. Profitability ratios, such as net profit ratio and return on equity, are examined to assess the company's performance. The report also explores dividend distribution policies, including dividend equations, tax systems in Australia (franked and un-franked dividends), and dividend reinvestment plans. Finally, the report incorporates price-earnings ratios and provides relevant references to support the analysis.
Document Page
Running Head: FINANCIAL MANAGEMENT 0
Financial Management
tabler-icon-diamond-filled.svg

Paraphrase This Document

Need a fresh take? Get an instant paraphrase of this document with our AI Paraphraser
Document Page
FINANCIAL MANAGEMENT 1
Contents
Part 1..........................................................................................................................................3
Part 2..........................................................................................................................................6
Capital structure ratios............................................................................................................6
Working Capital Management Policies..................................................................................6
Policies of Investments...........................................................................................................6
Debt to Equity Ratio...................................................................................................................8
Profitability ratios.....................................................................................................................12
Part 3........................................................................................................................................15
Distribution Policy................................................................................................................15
Trends Dividend Share.........................................................................................................17
Dividend equation tax system in Australia...........................................................................18
Franked dividends................................................................................................................18
Un-franked dividends...........................................................................................................18
Part 4........................................................................................................................................20
Dividend Reinvestment Plan................................................................................................20
References................................................................................................................................22
Document Page
FINANCIAL MANAGEMENT 2
Part 1
WACC PARTICULARS AMOUNT IN $
E MARKET VALUE OF
THE COMPANY'S
EQUITY 3113.798
D MARKET VALUE OF
COMPANY'S DEBT 5572.90
E+D
TOTAL MARKET
VALUE OF THE
COMPANY 8686.70
Re COST OF EQUITY 11.3%
Rd COST OF DEBT 1.3%
T TAX RATE 30.00%
E/
(E+D)*COST
OF EQUITY
D/(E+D)*COST
OF DEBT
(1-TAX
RATE)
WACC
0.040 0.008 70.00% 4.61%
Document Page
FINANCIAL MANAGEMENT 3
CALCULATI
ON OF
MARKET
VALUE OF
DEBT
LATEST
TWO YEAR
AVERAGE
AMOUN
T IN $
TOTAL
CURRENT
PORTION OF
LONG TERM 70.8
LONG TERM
DEBT AND
CAPITAL
ELASE
OBLIGATIO
N 5572.9 5643.70
CALCULATION OF
COST OF EQUITY
RISK FREE
RETURN
BETA
OF THE
EXPECTE
D
MARKET
EXPECTE
D
AMRKET
COST
OF
EQUIT
tabler-icon-diamond-filled.svg

Paraphrase This Document

Need a fresh take? Get an instant paraphrase of this document with our AI Paraphraser
Document Page
FINANCIAL MANAGEMENT 4
ASSET RETURN RETURN
-RISK
FREE
RETUN
Y
2.70% 0.98 8.74% 6.0% 11.3%
CALCULAITON OF COST OF
DEBT
INTEREST
EXPENSE
LATEST
TWO
YEAR
AVERAG
E DEBT
COST OF
DEBT
70.80 5572.9 1.3%
WEIGHTS E/(E+D) D/(E+D)
WEIGHT OF
EQUITY 0.36
WEIGHT OF
DEBT 0.64
Document Page
FINANCIAL MANAGEMENT 5
Part 2
Capital structure ratios
An optimal capital structure is a financial measurement which is used by the firm to
determine the best available combination of debt and equity to use for the operations and
expansions. This structure is helpful in reducing the cost of capital so the company is not
dependent on the creditor and is able to generate finances through equity (Graham, Leary and
Roberts, 2015). The calculation of cost of equity and cost of debt is required to calculate the
WACC. Companies can raise capital with either debt or equity. Each strategy has its own
benefits and limitations. The debt is usually cheap in comparison to the cost of equity.
Working Capital Management Policies
Working capital is a financial measure which determines the availability of the operating
liquid assets for the business, organisation or any entity. The working capital is considered as
a part of the operating capital. The formula of calculating the working capital is the current
assets minus current liabilities (Gitman, Juchau and Flanagan, 2015). The relationship
between the working capital and the profitability and the liquidity is core and critical (Hope,
Thomas and Vyas, 2017). Various measures have been adopted by the managers of the
companies to make sure that proper cash is available or relevant marketable securities are
there to meet the meet the obligations of the payments when they are about to be paid. If the
working capital ratio of the company is higher it will eventually reflect the flexibility of the
finances. The liquidity is relatively higher and the risk is lower.
Policies of Investments
For some investors the company’s performance is evaluated on the basis of the assets owned
by the organisation. The profitability and the liquidity of the company will be accumulated to
a limited extent and they are not easily converted into cash. This kind of decision becomes a
Document Page
FINANCIAL MANAGEMENT 6
mark and there is a constant fear of losing out of current assets and the fear of reduced profit
margins (Magni, 2016).
Majorly there are lot of policies yet the Fortescue metal Groups Limited adopts the policy
which is kind of a liberal one. It is also known as fat cat policy. In comparison to its
competitors Fortescue metal Groups Limited is generally maintain the ample amount of
current assets for its own operational reasons. This goal can be achieved by holding ample
amount of cash, inventories, credit policy which is highly liberal also the customers and
debtors who can pay within the period of 90 days (Daraban, 2017).
tabler-icon-diamond-filled.svg

Paraphrase This Document

Need a fresh take? Get an instant paraphrase of this document with our AI Paraphraser
Document Page
FINANCIAL MANAGEMENT 7
Debt to Equity
Ratio
2014 2015 2016 2017
Debt 9809 11855 8437 4749
Equity 8035 9797 11301 12637
Debt to Equity
Ratio 1.22 1.21 0.75 0.38
Debt to Equity Ratio
The debt to equity ratio is a financial ratio indicating which indicates the proportion of the
shareholders in association with the debt component used to finance the assets of the
company. This ratio is also known as risk, gearing ratio. From the above table it can be
observed that the debt to equity ratio of Fortescue metal Groups Limited 0.42 as compared to
the previous year which was 0.75(Mazzi, André, Dionysiou and Tsalavoutas, 2017).
Document Page
FINANCIAL MANAGEMENT 8
2014 2015 2016 2017
0.00
0.20
0.40
0.60
0.80
1.00
1.20
1.40
Debt to Equity Ratio
Long Term Debt To Capital
201
4 2015 2016 2017
Long term Debt
964
8 11664 8327 4646
Equity
803
5 9797 11301 12637
Debt to Equity Ratio 1.20 1.19 0.74 0.37
Document Page
FINANCIAL MANAGEMENT 9
2014 2015 2016 2017
0.00
0.20
0.40
0.60
0.80
1.00
1.20
1.40
Long Term Debt to Capital
tabler-icon-diamond-filled.svg

Paraphrase This Document

Need a fresh take? Get an instant paraphrase of this document with our AI Paraphraser
Document Page
FINANCIAL MANAGEMENT 10
Total Debt To
Capital
2014 2015 2016 2017
Total Debt 12585 15818 12538 9351
Equity 8035 9797 11301 12637
Debt to Equity
Ratio 1.57 1.61 1.11 0.74
2014 2015 2016 2017
0.00
0.20
0.40
0.60
0.80
1.00
1.20
1.40
1.60
1.80
Total Debt Rtaio
Total Debt Rtaio
Document Page
FINANCIAL MANAGEMENT 11
Profitability ratios
The ratios of the profitability are the financial ratios which are used to measure and evaluate
the capacity of the company to generate the profits related to the revenue, cost of operations,
assets in the balance sheet and shareholder’s equity as well (McKay and Haque, 2016). The
net profit of the company in the table below is 25% of the turnover which is pretty low as
compared to the previous years.
Profitability Ratios
Net Profit Ratio
2014 2015 2016 2017
Net Profit 2898 413 13325 2721
Turnover 12477 11164 9538 10982
Debt to Equity
Ratio 0.23 0.04 1.40 0.25
chevron_up_icon
1 out of 23
circle_padding
hide_on_mobile
zoom_out_icon
[object Object]