Biostatistics 401077: Hypothesis Testing and Confidence Intervals, UWS

Verified

Added on  2023/06/12

|6
|860
|423
Homework Assignment
AI Summary
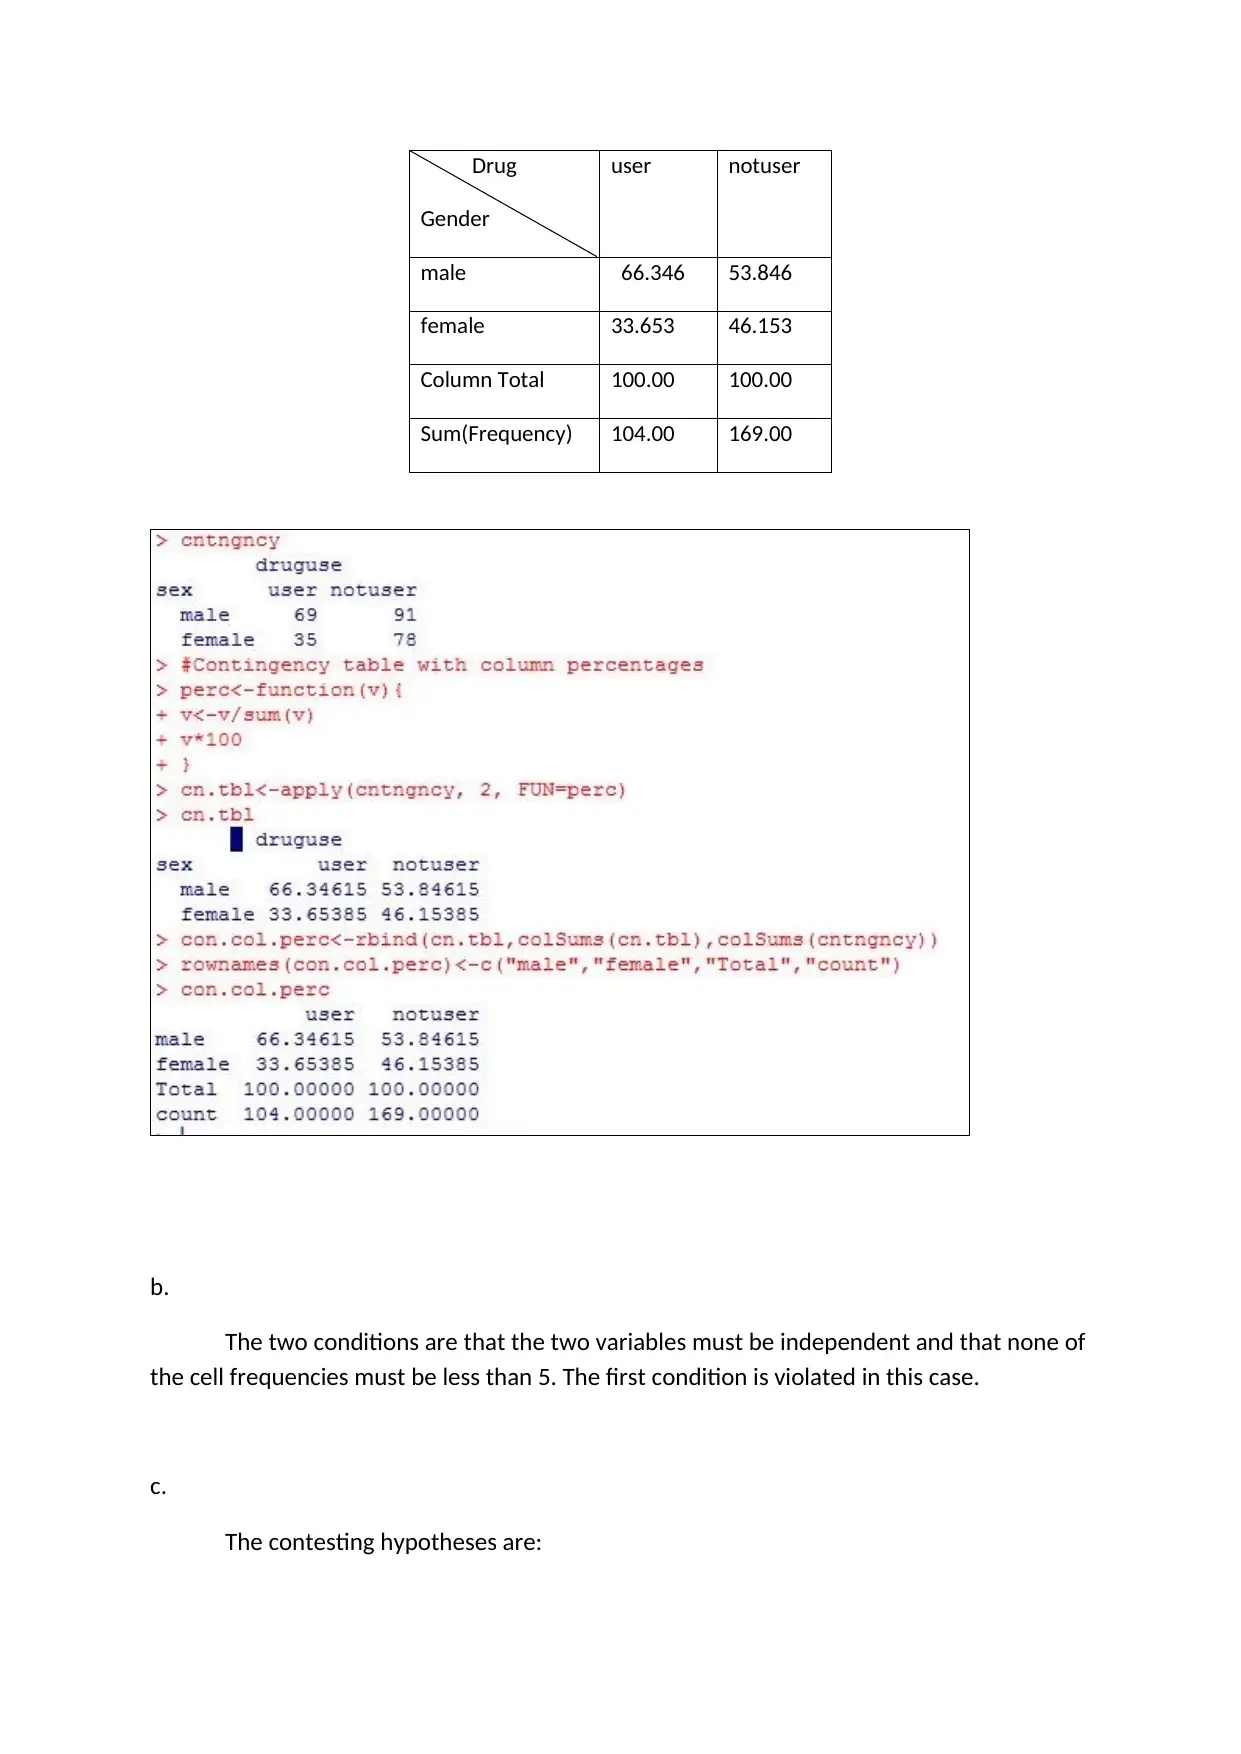
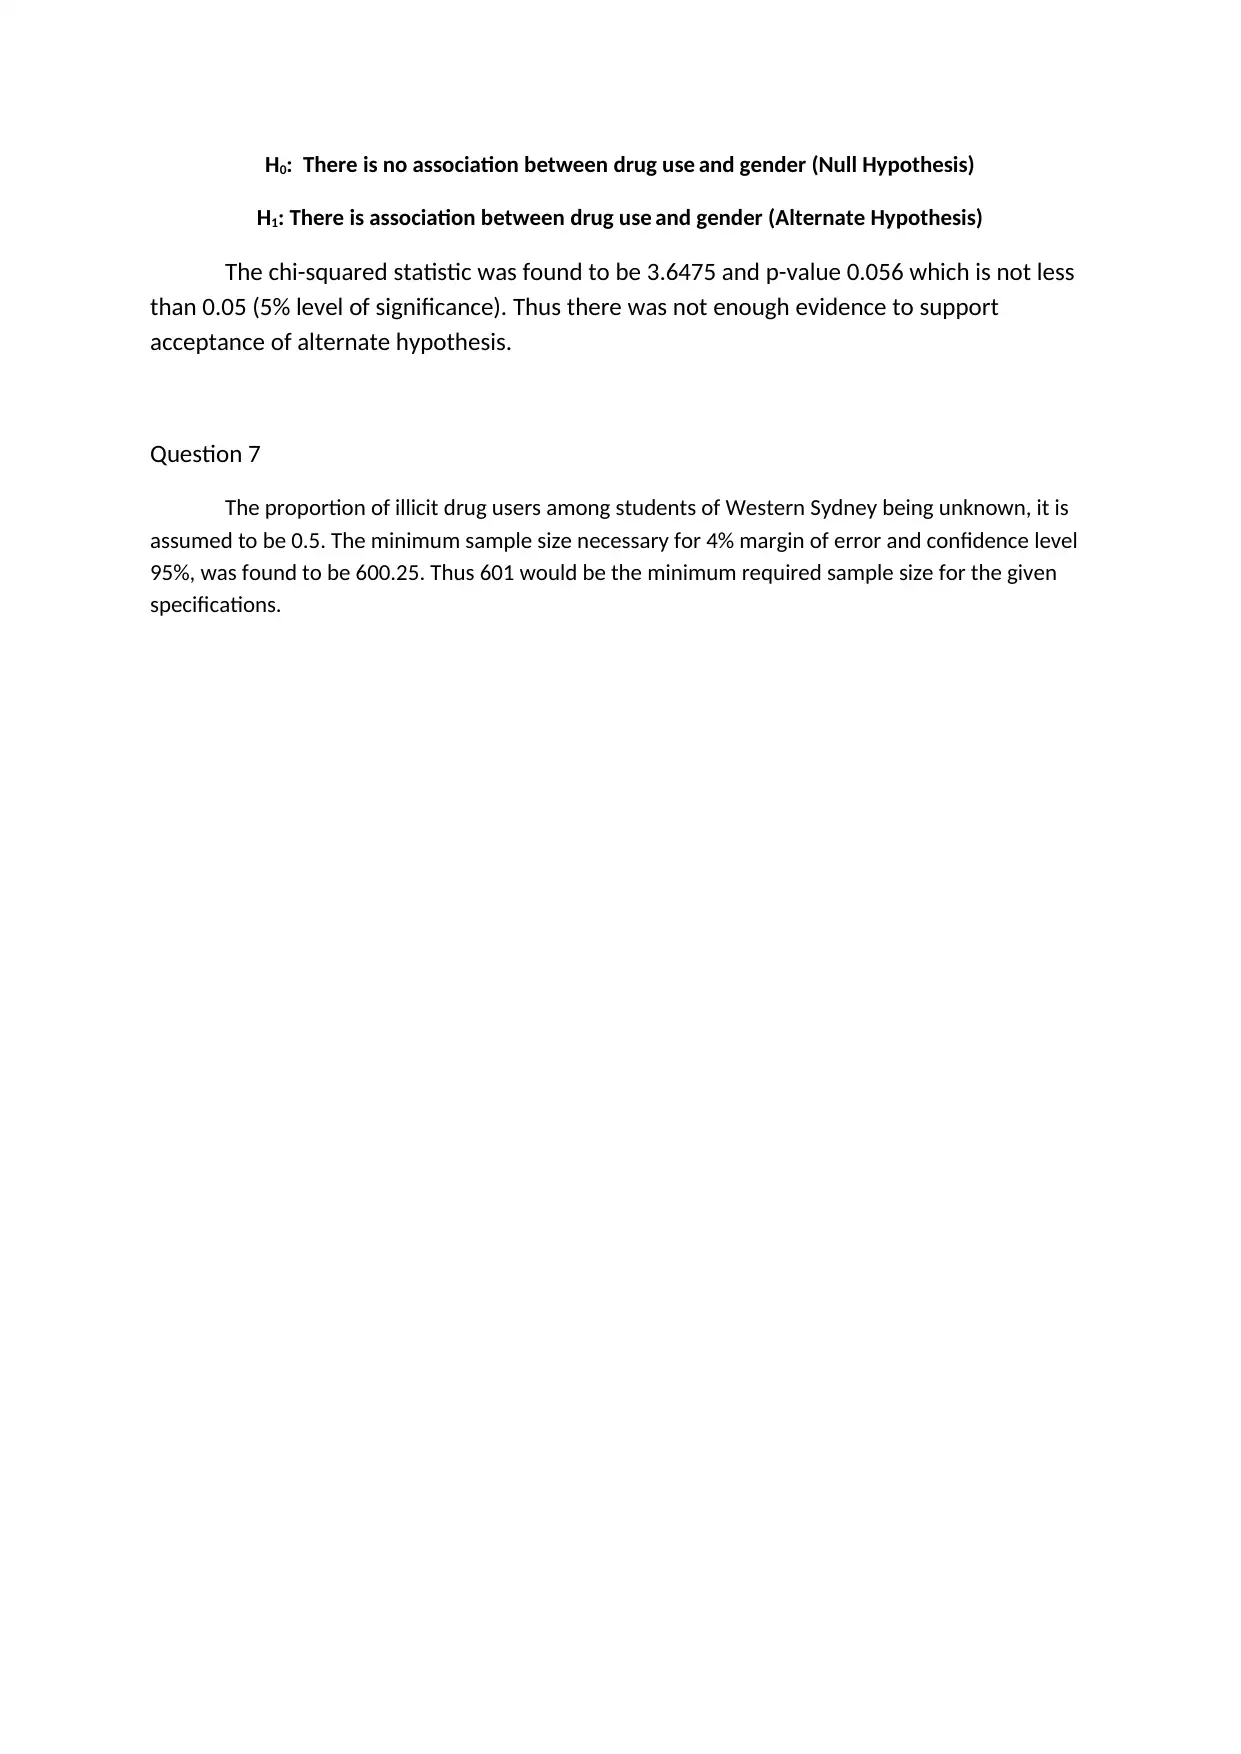
This assignment focuses on applying biostatistical methods to analyze data related to student drinking habits, well-being scores, and drug use. It involves conducting a sign test to assess changes in drinking habits, calculating and interpreting confidence intervals for well-being scores (WEMWBS), performing hypothesis tests (both t-tests and Mann-Whitney tests) to compare well-being between drug users and non-users, determining the necessary sample size for a study with specified power and error rate, and analyzing the association between drug use and gender using a chi-squared test. The solutions provided include the null and alternative hypotheses, test statistics, p-values, and conclusions based on a 5% significance level. The assignment also addresses the assumptions underlying statistical tests and the implications of violating these assumptions. Finally, the minimum sample size for the given specifications has been calculated.
Document Page
401077 Introduction to Biostatistics, Autumn 2018
Assignment 2
Due Sunday April 29, 2018
“When submitting your assignment to Turnitin you are implicitly ticking these statements:
I retain a backup file of this assignment in case the original file is lost or damaged.
I hereby certify that no part of this assignment or product has been copied from any
other student’s work or from any other source except where due
acknowledgement is made in the assignment.
I hereby certify that no part of this assignment or product has been submitted by me
in another (previous or current) assessment.
I hereby certify that no part of the assignment has been written or produced by any
person.
I hereby certify that no part of this assignment has been made available to any other
student.
I am aware that this work will be reproduced and submitted to plagiarism detection
software for the purpose of detecting possible plagiarism. This software may retain
a copy of this assignment on its database for future plagiarism detection.
I understand that failure to uphold this declaration may result in academic
proceedings in line with the UWS Student Academic Misconduct Policy.”
Your name:
Your student number:
Question 1
Step 1: The hypothesis to be tested could be reduced to:
Null: H0: p =0.5
Alternate: H1: p ≠ 0.5
Step 2: The level of significance considered in 0.05.
Step 3: The statistic of interest is X which measures count of “more”. It follows Binomial (10, p). X
was observed as 3.
Step 4: The p-value observed was 0.3438 (>0.05)
Step 5: Failed to reject null hypothesis. Thus drinking habits indicated by the data is not found
different from that at University of Eastern Sydney.
tabler-icon-diamond-filled.svg

Paraphrase This Document

Need a fresh take? Get an instant paraphrase of this document with our AI Paraphraser
Document Page
Question 2
a.
The 95% confidence interval estimate of the mean WEMWBS was computed as
(43.67495, 44.38439).
b.
There is 95% chance that the range of values between 43.674 and 44.384 contains
the population mean well-being score (WEMWBS) of the students. The point estimate for
the mean in this sample was found to be 44.029.
Question 3
a.
A one tailed hypothesis test would be more appropriate to test the given research
question, since it is enough to just check if mean WEMWBS for users is less than that for
non-users and disregard if it is greater or not.
b.
Document Page
H0: mean of WEMWBS for drug users= mean of WEMWBS for non-users (null)
H1: mean of WEMWBS for drug users< mean of WEMWBS for non-users (alternate)
c.
i. The mean WEMWBS score for users is 43.90288
ii. The mean WEMWBS score for non-users is 44.10769
iii. The p-value of the test of hypothesis is 0.3213
d. Based on the p-value, rejection of null hypothesis was not found to be favourable at
5% level of significance. Thus there is no evidence that WEMWBS for users is lesser than
non-users.
Question 4
Document Page
Testing the hypotheses as stated in the previous question, using Mann-Whitney test
(based on the median), yielded the p-value as 0.2542. Thus null could not be rejected at 5%
level of significance. Thus, no evidence was found supporting the conjecture that well-being
score of users and lesser than non-users.
Question 5
A sample of size at least 42 is required for satisfying the test parameters of 90%
power and 5% probability of type I error when testing whether population mean well-being
for the students is at least half of the standard deviation value better than the mean.
Question 6
a.
The contingency table with column percentages was computed as:
tabler-icon-diamond-filled.svg

Paraphrase This Document

Need a fresh take? Get an instant paraphrase of this document with our AI Paraphraser
Document Page
Drug
Gender
user notuser
male 66.346 53.846
female 33.653 46.153
Column Total 100.00 100.00
Sum(Frequency) 104.00 169.00
b.
The two conditions are that the two variables must be independent and that none of
the cell frequencies must be less than 5. The first condition is violated in this case.
c.
The contesting hypotheses are:
Document Page
H0: There is no association between drug use and gender (Null Hypothesis)
H1: There is association between drug use and gender (Alternate Hypothesis)
The chi-squared statistic was found to be 3.6475 and p-value 0.056 which is not less
than 0.05 (5% level of significance). Thus there was not enough evidence to support
acceptance of alternate hypothesis.
Question 7
The proportion of illicit drug users among students of Western Sydney being unknown, it is
assumed to be 0.5. The minimum sample size necessary for 4% margin of error and confidence level
95%, was found to be 600.25. Thus 601 would be the minimum required sample size for the given
specifications.
chevron_up_icon
1 out of 6
circle_padding
hide_on_mobile
zoom_out_icon
[object Object]