Biostatistics Study: Risk Factors for Obesity and Statistical Analysis
VerifiedAdded on  2023/03/20
|9
|1794
|53
Report
AI Summary
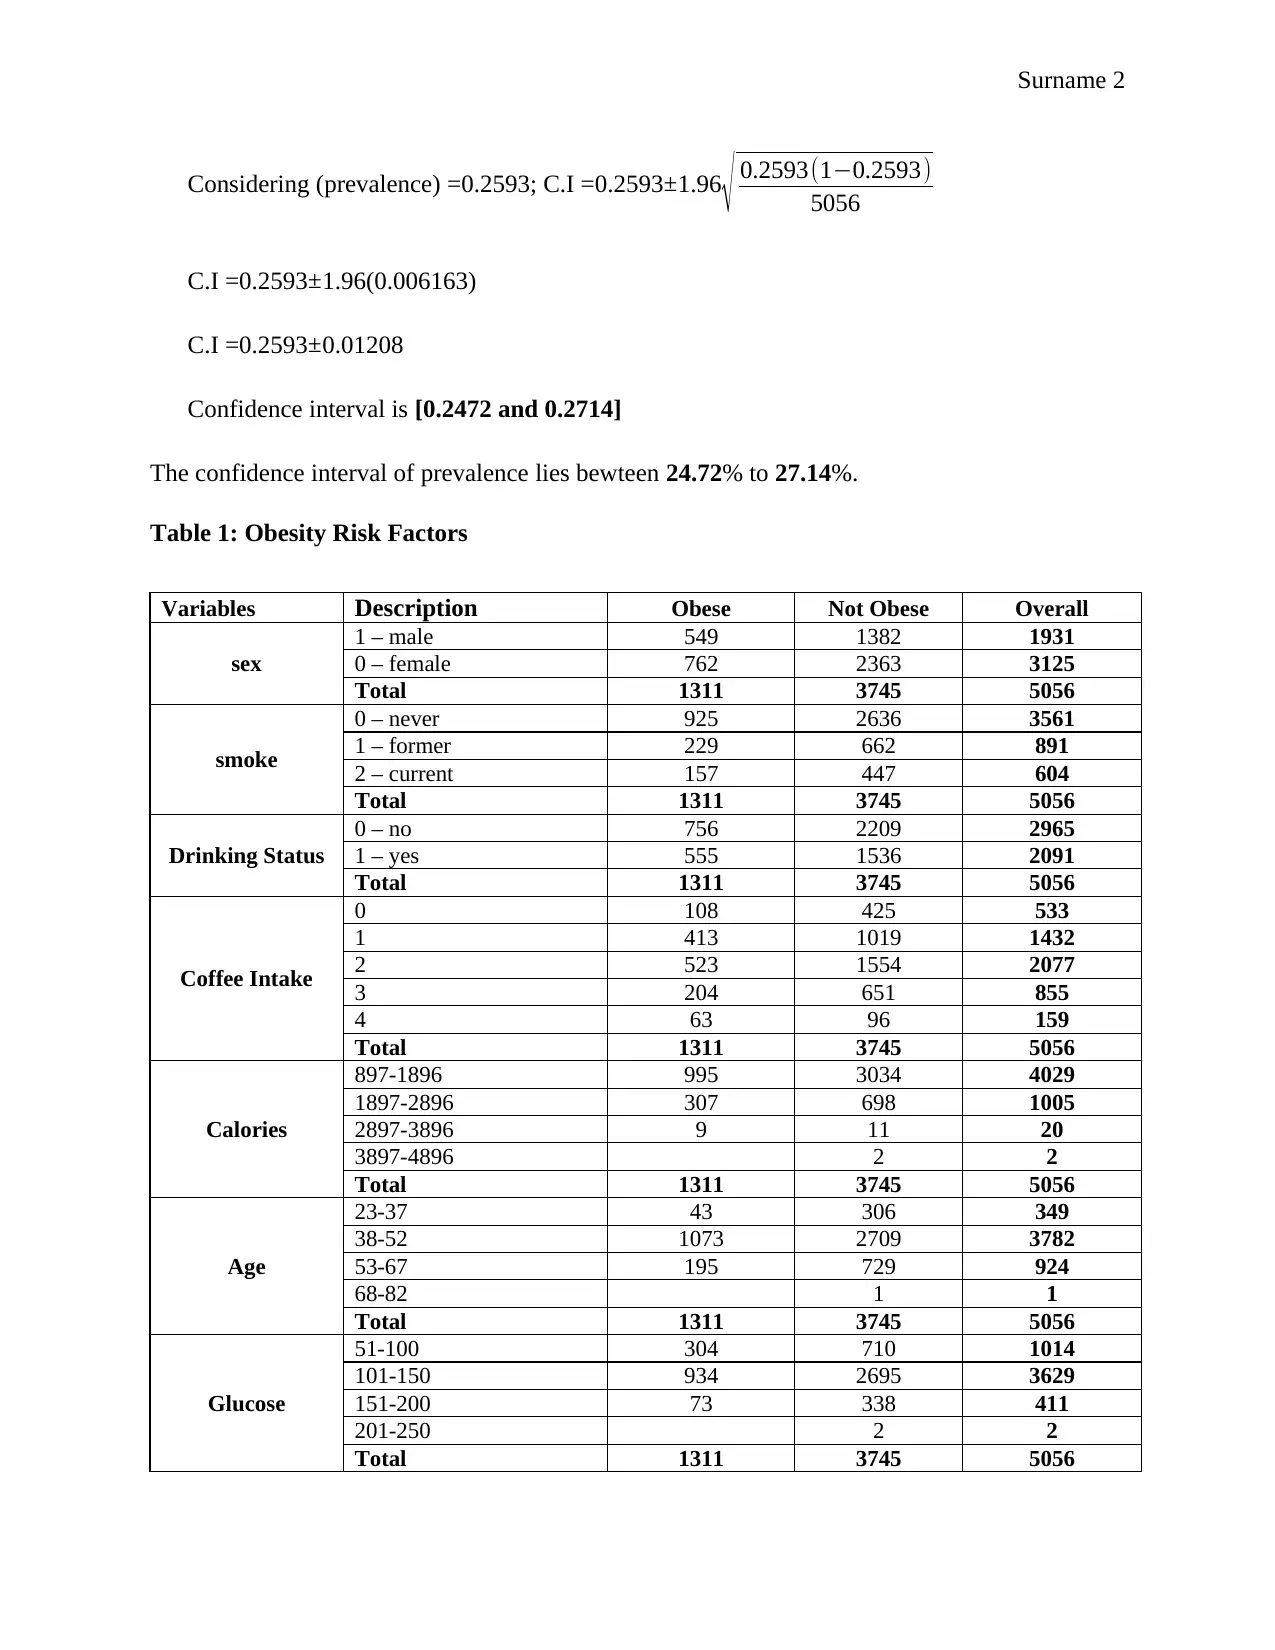
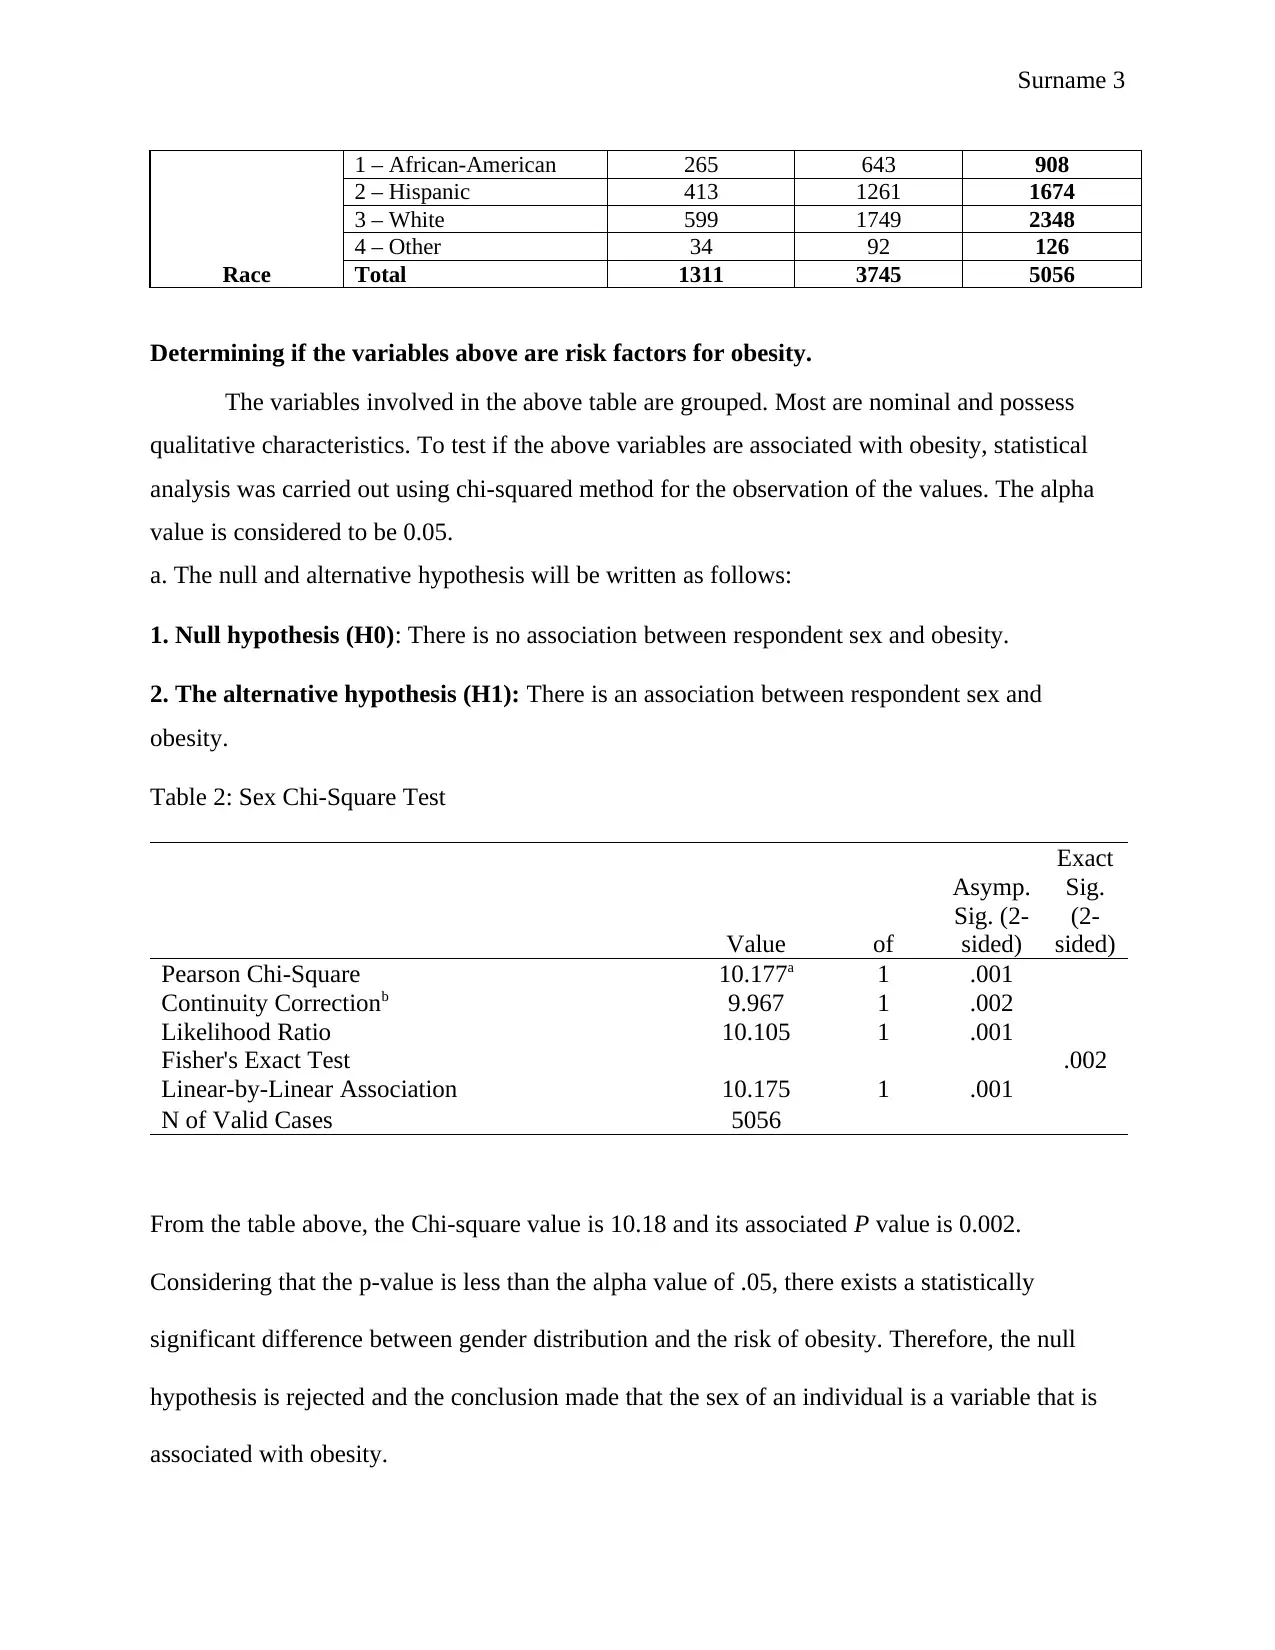
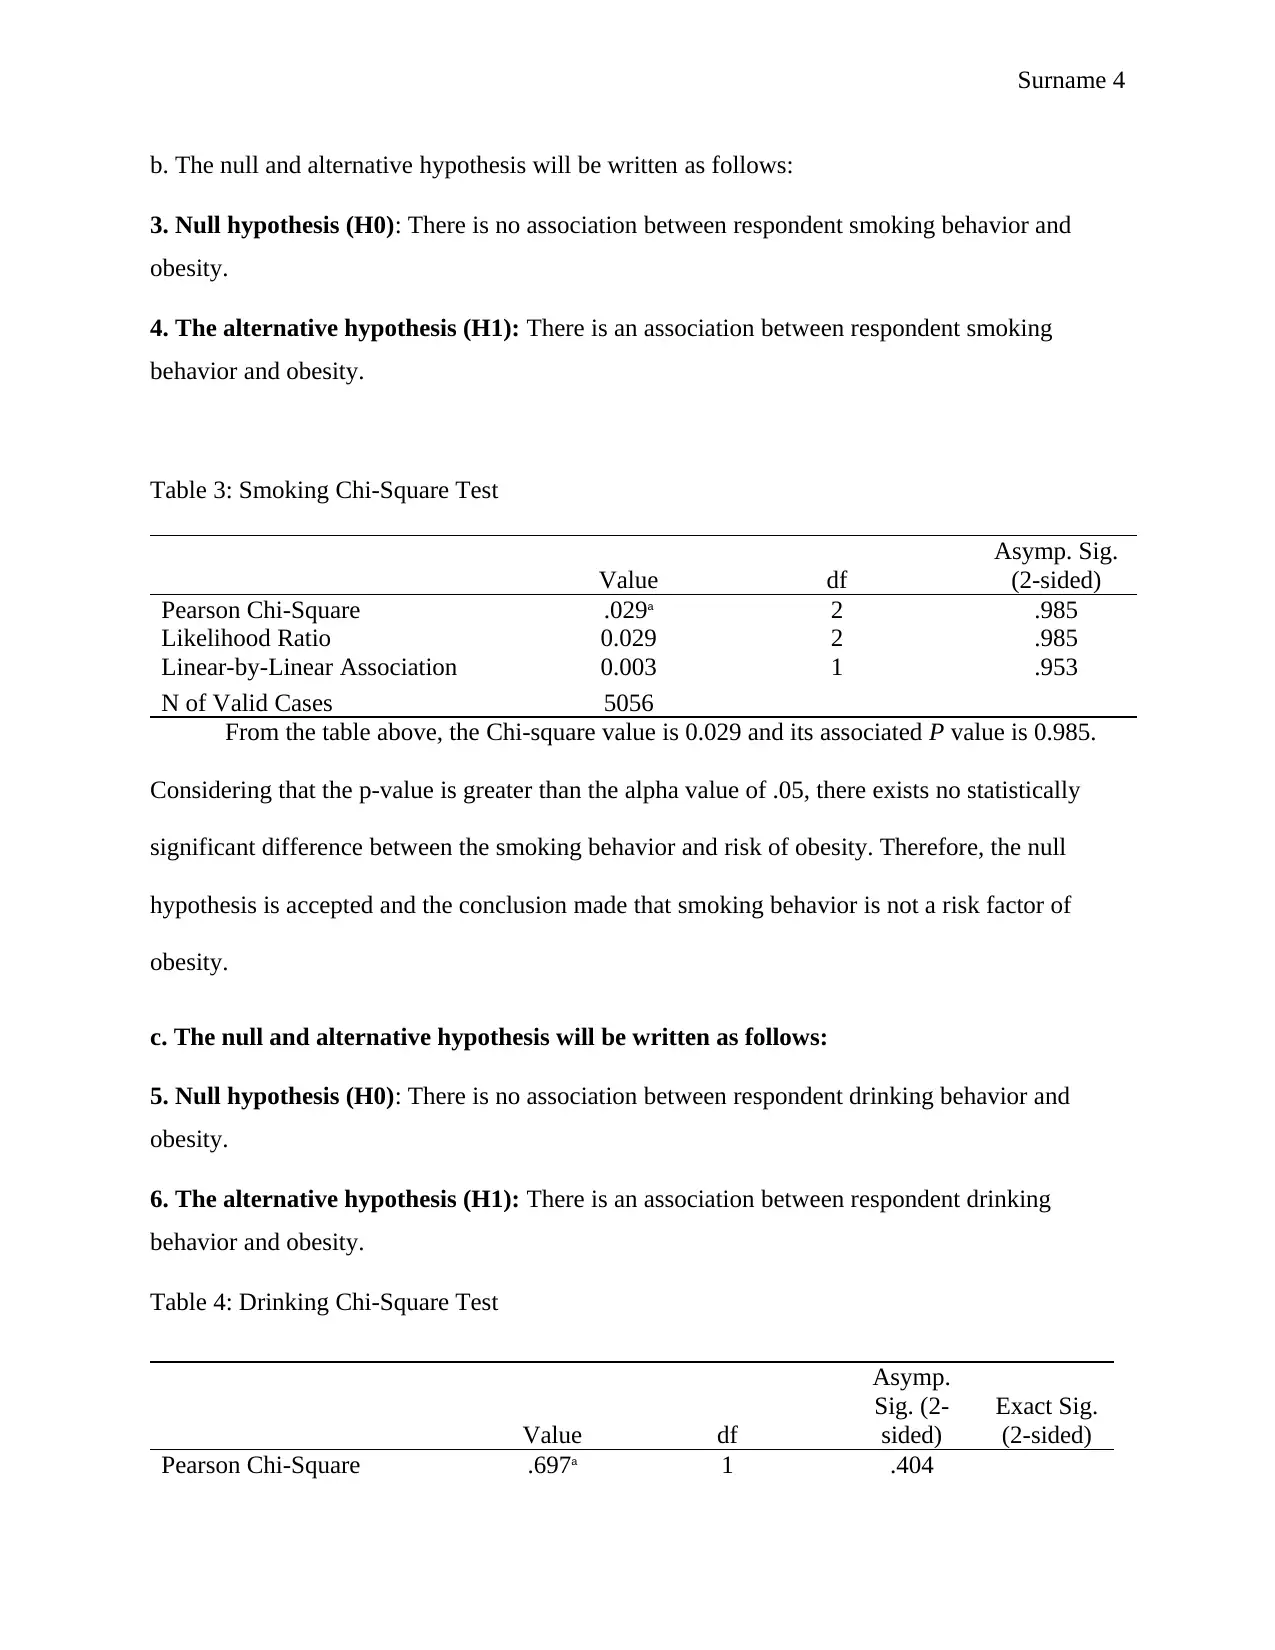
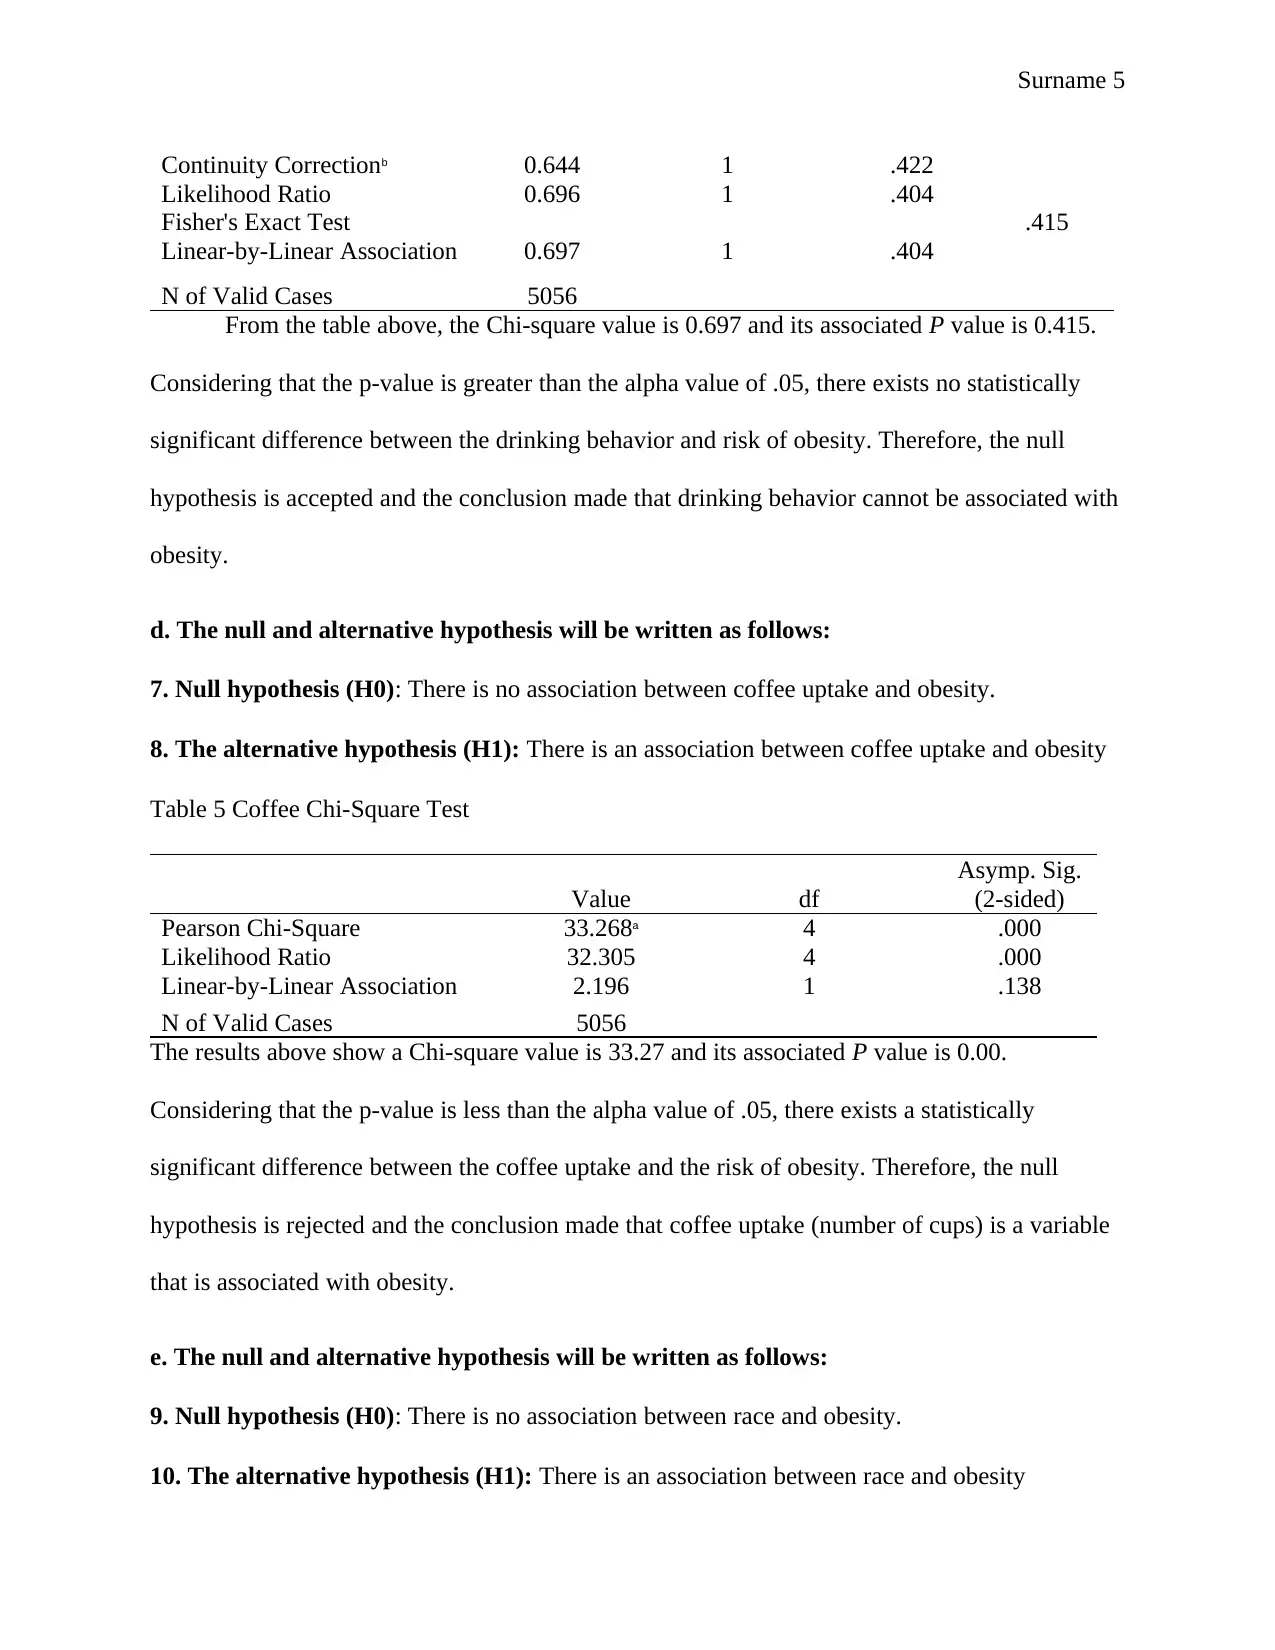
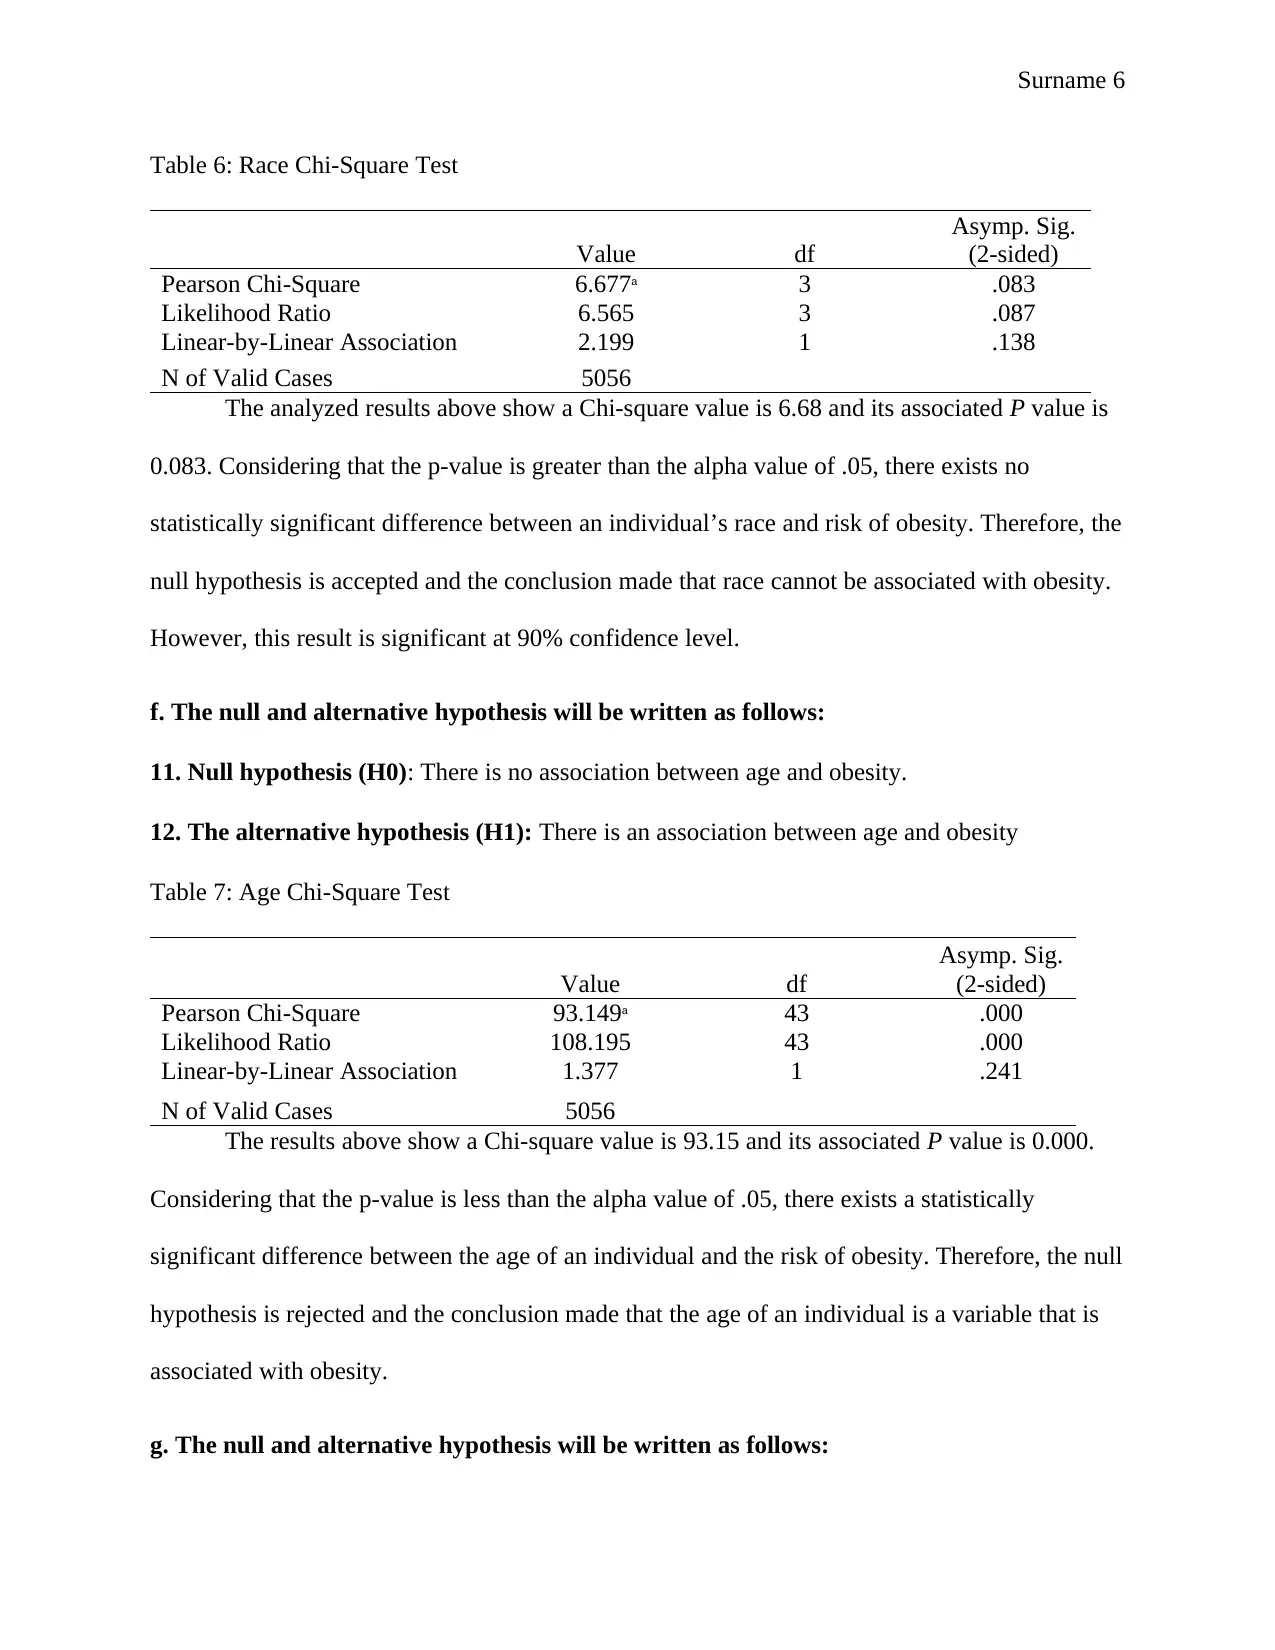
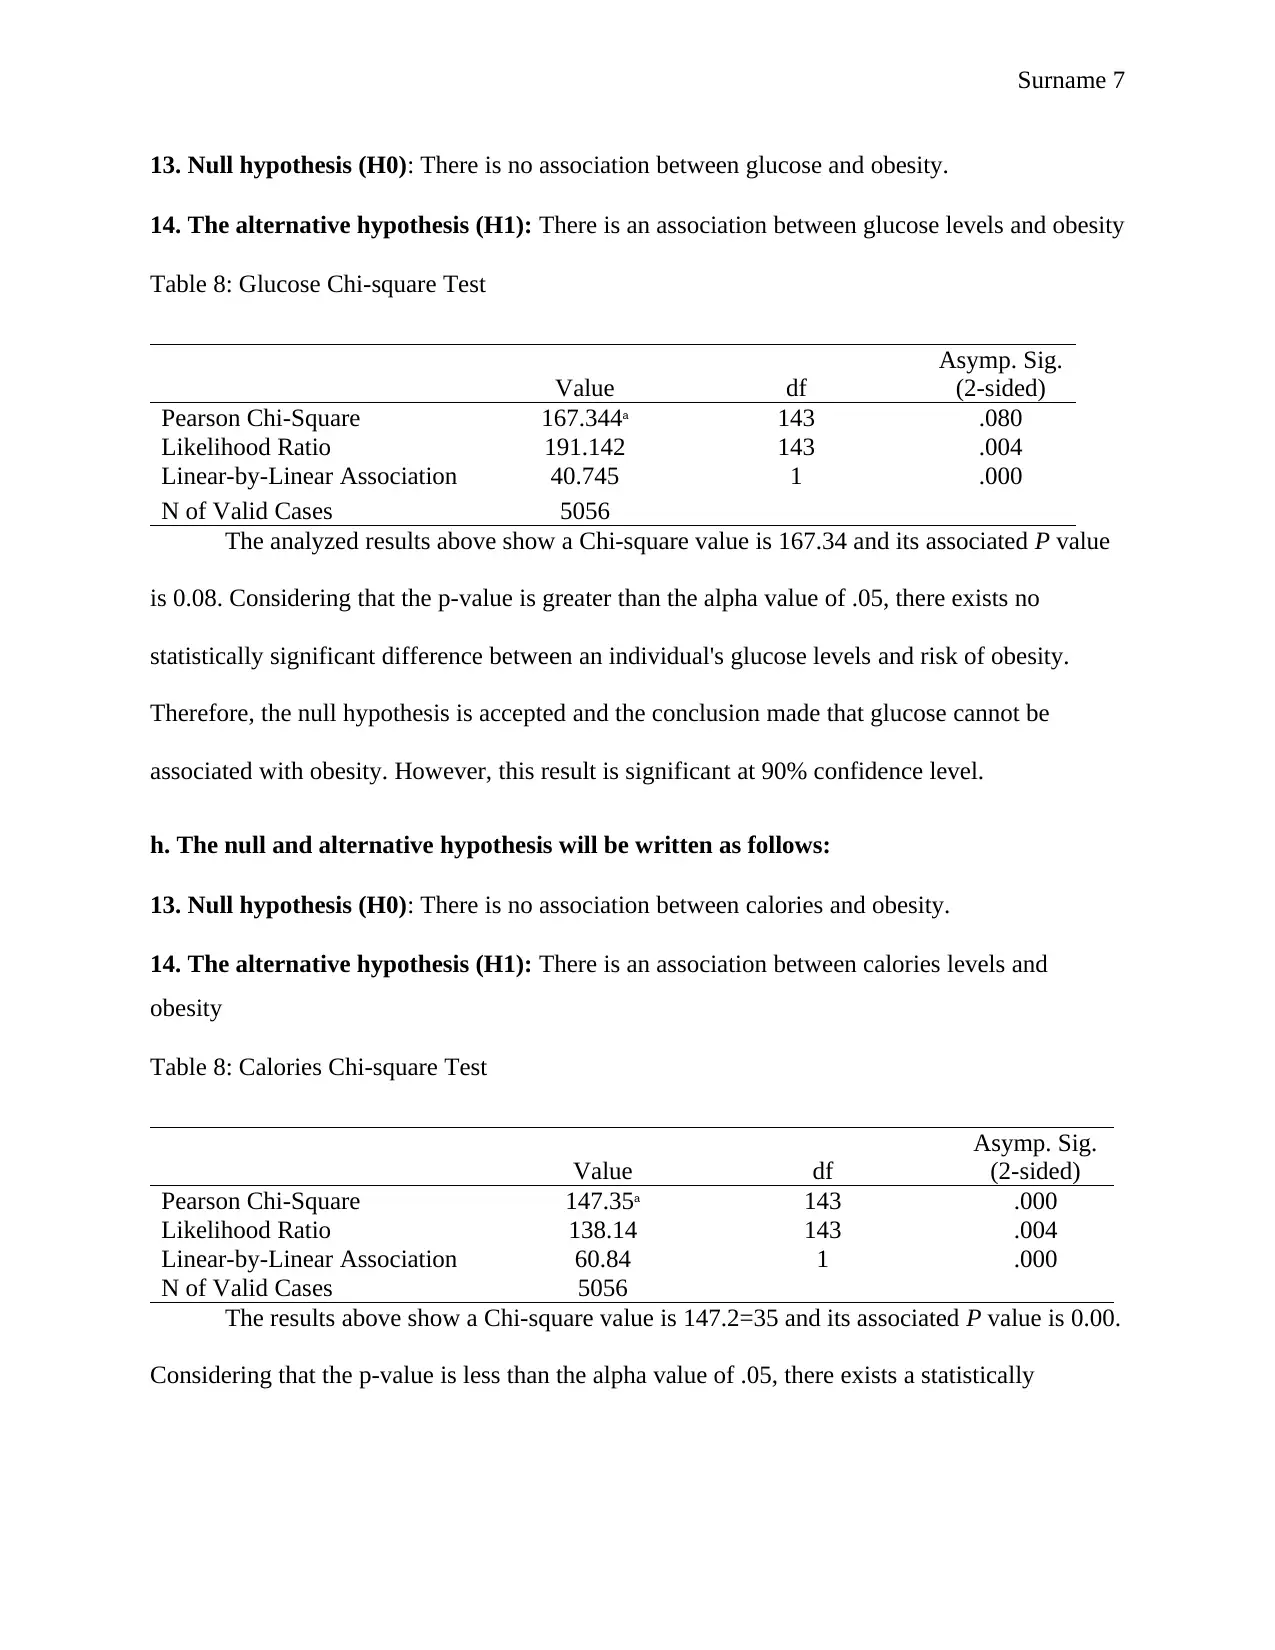
This biostatistics report presents an experimental study on obesity, employing a randomized control trial design and analyzing data from a sample of 5056 subjects. The study investigates the prevalence of obesity, calculated at 25.93%, and determines a 95% confidence interval. The report examines various risk factors including sex, smoking habits, drinking behavior, coffee intake, race, age, glucose levels, and calorie consumption. Statistical analysis, primarily using the chi-squared method, reveals significant associations between obesity and sex, coffee intake, age, and calorie levels. The study concludes that these factors are significantly associated with obesity, while smoking, drinking, race, and glucose levels do not show a statistically significant association, though some results are significant at a 90% confidence level. The report includes detailed tables, statistical values, and hypothesis testing to support its conclusions.

Surname 1
Student’s Name
Professor’s Name
Course
Date
Biostatistics
Study Design: This is an experimental study design that involves a randomized control trial.
This is because it involves simple random sampling of subjects to study a certain trait (obesity).
Study Units are patients visiting the physician.
The outcome of Interest: Risk factors for Obesity
Can causation be determined-At face value it is difficult to determine causation for obesity.
From data analyzed from a sufficiently large sample size, this can be well determined. The
outcome of interest can be caused by different factors that vary from one individual to the other.
Prevalence of Obesity
According to Rosner (2015),Prevalence of Obesity=number of cases/population
*100=1311/5056=0.2593:
25.93% prevalence
95% Confidence level for prevalence
The confidence interval formula is;
Paraphrase This Document
Need a fresh take? Get an instant paraphrase of this document with our AI Paraphraser

Surname 2
Considering (prevalence) =0.2593; C.I =0.2593±1.96
√ 0.2593(1−0.2593)
5056
C.I =0.2593 ±1.96(0.006163)
C.I =0.2593 ±0.01208
Confidence interval is [0.2472 and 0.2714]
The confidence interval of prevalence lies bewteen 24.72% to 27.14%.
Table 1: Obesity Risk Factors
Variables Description Obese Not Obese Overall
sex
1 – male 549 1382 1931
0 – female 762 2363 3125
Total 1311 3745 5056
smoke
0 – never 925 2636 3561
1 – former 229 662 891
2 – current 157 447 604
Total 1311 3745 5056
Drinking Status
0 – no 756 2209 2965
1 – yes 555 1536 2091
Total 1311 3745 5056
Coffee Intake
0 108 425 533
1 413 1019 1432
2 523 1554 2077
3 204 651 855
4 63 96 159
Total 1311 3745 5056
Calories
897-1896 995 3034 4029
1897-2896 307 698 1005
2897-3896 9 11 20
3897-4896 2 2
Total 1311 3745 5056
Age
23-37 43 306 349
38-52 1073 2709 3782
53-67 195 729 924
68-82 1 1
Total 1311 3745 5056
Glucose
51-100 304 710 1014
101-150 934 2695 3629
151-200 73 338 411
201-250 2 2
Total 1311 3745 5056

Surname 3
Race
1 – African-American 265 643 908
2 – Hispanic 413 1261 1674
3 – White 599 1749 2348
4 – Other 34 92 126
Total 1311 3745 5056
Determining if the variables above are risk factors for obesity.
The variables involved in the above table are grouped. Most are nominal and possess
qualitative characteristics. To test if the above variables are associated with obesity, statistical
analysis was carried out using chi-squared method for the observation of the values. The alpha
value is considered to be 0.05.
a. The null and alternative hypothesis will be written as follows:
1. Null hypothesis (H0): There is no association between respondent sex and obesity.
2. The alternative hypothesis (H1): There is an association between respondent sex and
obesity.
Table 2: Sex Chi-Square Test
Value of
Asymp.
Sig. (2-
sided)
Exact
Sig.
(2-
sided)
Pearson Chi-Square 10.177a 1 .001
Continuity Correctionb 9.967 1 .002
Likelihood Ratio 10.105 1 .001
Fisher's Exact Test .002
Linear-by-Linear Association 10.175 1 .001
N of Valid Cases 5056
From the table above, the Chi-square value is 10.18 and its associated P value is 0.002.
Considering that the p-value is less than the alpha value of .05, there exists a statistically
significant difference between gender distribution and the risk of obesity. Therefore, the null
hypothesis is rejected and the conclusion made that the sex of an individual is a variable that is
associated with obesity.
You're viewing a preview
Unlock full access by subscribing today!

Surname 4
b. The null and alternative hypothesis will be written as follows:
3. Null hypothesis (H0): There is no association between respondent smoking behavior and
obesity.
4. The alternative hypothesis (H1): There is an association between respondent smoking
behavior and obesity.
Table 3: Smoking Chi-Square Test
Value df
Asymp. Sig.
(2-sided)
Pearson Chi-Square .029a 2 .985
Likelihood Ratio 0.029 2 .985
Linear-by-Linear Association 0.003 1 .953
N of Valid Cases 5056
From the table above, the Chi-square value is 0.029 and its associated P value is 0.985.
Considering that the p-value is greater than the alpha value of .05, there exists no statistically
significant difference between the smoking behavior and risk of obesity. Therefore, the null
hypothesis is accepted and the conclusion made that smoking behavior is not a risk factor of
obesity.
c. The null and alternative hypothesis will be written as follows:
5. Null hypothesis (H0): There is no association between respondent drinking behavior and
obesity.
6. The alternative hypothesis (H1): There is an association between respondent drinking
behavior and obesity.
Table 4: Drinking Chi-Square Test
Value df
Asymp.
Sig. (2-
sided)
Exact Sig.
(2-sided)
Pearson Chi-Square .697a 1 .404
Paraphrase This Document
Need a fresh take? Get an instant paraphrase of this document with our AI Paraphraser

Surname 5
Continuity Correctionb 0.644 1 .422
Likelihood Ratio 0.696 1 .404
Fisher's Exact Test .415
Linear-by-Linear Association 0.697 1 .404
N of Valid Cases 5056
From the table above, the Chi-square value is 0.697 and its associated P value is 0.415.
Considering that the p-value is greater than the alpha value of .05, there exists no statistically
significant difference between the drinking behavior and risk of obesity. Therefore, the null
hypothesis is accepted and the conclusion made that drinking behavior cannot be associated with
obesity.
d. The null and alternative hypothesis will be written as follows:
7. Null hypothesis (H0): There is no association between coffee uptake and obesity.
8. The alternative hypothesis (H1): There is an association between coffee uptake and obesity
Table 5 Coffee Chi-Square Test
Value df
Asymp. Sig.
(2-sided)
Pearson Chi-Square 33.268a 4 .000
Likelihood Ratio 32.305 4 .000
Linear-by-Linear Association 2.196 1 .138
N of Valid Cases 5056
The results above show a Chi-square value is 33.27 and its associated P value is 0.00.
Considering that the p-value is less than the alpha value of .05, there exists a statistically
significant difference between the coffee uptake and the risk of obesity. Therefore, the null
hypothesis is rejected and the conclusion made that coffee uptake (number of cups) is a variable
that is associated with obesity.
e. The null and alternative hypothesis will be written as follows:
9. Null hypothesis (H0): There is no association between race and obesity.
10. The alternative hypothesis (H1): There is an association between race and obesity

Surname 6
Table 6: Race Chi-Square Test
Value df
Asymp. Sig.
(2-sided)
Pearson Chi-Square 6.677a 3 .083
Likelihood Ratio 6.565 3 .087
Linear-by-Linear Association 2.199 1 .138
N of Valid Cases 5056
The analyzed results above show a Chi-square value is 6.68 and its associated P value is
0.083. Considering that the p-value is greater than the alpha value of .05, there exists no
statistically significant difference between an individual’s race and risk of obesity. Therefore, the
null hypothesis is accepted and the conclusion made that race cannot be associated with obesity.
However, this result is significant at 90% confidence level.
f. The null and alternative hypothesis will be written as follows:
11. Null hypothesis (H0): There is no association between age and obesity.
12. The alternative hypothesis (H1): There is an association between age and obesity
Table 7: Age Chi-Square Test
Value df
Asymp. Sig.
(2-sided)
Pearson Chi-Square 93.149a 43 .000
Likelihood Ratio 108.195 43 .000
Linear-by-Linear Association 1.377 1 .241
N of Valid Cases 5056
The results above show a Chi-square value is 93.15 and its associated P value is 0.000.
Considering that the p-value is less than the alpha value of .05, there exists a statistically
significant difference between the age of an individual and the risk of obesity. Therefore, the null
hypothesis is rejected and the conclusion made that the age of an individual is a variable that is
associated with obesity.
g. The null and alternative hypothesis will be written as follows:
You're viewing a preview
Unlock full access by subscribing today!

Surname 7
13. Null hypothesis (H0): There is no association between glucose and obesity.
14. The alternative hypothesis (H1): There is an association between glucose levels and obesity
Table 8: Glucose Chi-square Test
Value df
Asymp. Sig.
(2-sided)
Pearson Chi-Square 167.344a 143 .080
Likelihood Ratio 191.142 143 .004
Linear-by-Linear Association 40.745 1 .000
N of Valid Cases 5056
The analyzed results above show a Chi-square value is 167.34 and its associated P value
is 0.08. Considering that the p-value is greater than the alpha value of .05, there exists no
statistically significant difference between an individual's glucose levels and risk of obesity.
Therefore, the null hypothesis is accepted and the conclusion made that glucose cannot be
associated with obesity. However, this result is significant at 90% confidence level.
h. The null and alternative hypothesis will be written as follows:
13. Null hypothesis (H0): There is no association between calories and obesity.
14. The alternative hypothesis (H1): There is an association between calories levels and
obesity
Table 8: Calories Chi-square Test
Value df
Asymp. Sig.
(2-sided)
Pearson Chi-Square 147.35a 143 .000
Likelihood Ratio 138.14 143 .004
Linear-by-Linear Association 60.84 1 .000
N of Valid Cases 5056
The results above show a Chi-square value is 147.2=35 and its associated P value is 0.00.
Considering that the p-value is less than the alpha value of .05, there exists a statistically
Paraphrase This Document
Need a fresh take? Get an instant paraphrase of this document with our AI Paraphraser

Surname 8
significant difference between the calories levels and the risk of obesity. Therefore, the null
hypothesis is rejected and the conclusion made that calories levels are associated with obesity.
In conclusion, the variables sex, coffee uptake, age and calories levels were found to be highly
associated with obesity condition. Therefore, these are risk factors that require to be observed to
ensure one is not overweight.

Surname 9
References
Rosner, B., 2015. Fundamentals of biostatistics. Nelson Education.
References
Rosner, B., 2015. Fundamentals of biostatistics. Nelson Education.
You're viewing a preview
Unlock full access by subscribing today!
1 out of 9
Related Documents

Your All-in-One AI-Powered Toolkit for Academic Success.
 +13062052269
info@desklib.com
Available 24*7 on WhatsApp / Email
Unlock your academic potential
© 2024  |  Zucol Services PVT LTD  |  All rights reserved.