Business Decision Making Analysis for Blackfriars Restaurant Project
VerifiedAdded on 2020/07/23
|23
|5029
|49
Report
AI Summary
This report examines the business decision-making processes of Blackfriars Restaurant, focusing on its potential expansion. The report begins by outlining the methodology for collecting primary and secondary data, including survey design and sampling techniques. It then delves into data analysis, utilizing measures of central tendency and dispersion to interpret customer feedback and market trends. The analysis includes the creation of graphs, charts, and trend lines to aid in future estimations and presentation to management. Furthermore, the report incorporates the use of software-generated information, Gantt charts, and financial data to support strategic decision-making. The conclusion summarizes the key findings and their implications for the restaurant's expansion plans, emphasizing the importance of data-driven insights in achieving business objectives. The report provides a comprehensive overview of market analysis and decision-making process of a business.
Business Decision Making
Paraphrase This Document
Need a fresh take? Get an instant paraphrase of this document with our AI Paraphraser
Table of Contents
INTRODUCTION...........................................................................................................................1
TASK 1............................................................................................................................................1
1.1 Creation of sequence for collecting primary and secondary data.....................................1
1.2 Survey methodology and sampling frame used................................................................2
1.3 Design a questionnaire.....................................................................................................3
2.1 Creation of data for analysing the aspect.........................................................................4
2.2 Analysis of data by using measure of central tendency...................................................5
2.3 Use of measure of dispersion for business decision making............................................6
2.4 Use of quartile and correlation for taking better decision................................................7
TASK 2............................................................................................................................................8
3.1 Creation of graphs and charts for data..............................................................................8
3.2 Create trend lines for future estimation..........................................................................10
3.3 Presentation for management understanding..................................................................11
..............................................................................................................................................13
TASK 3..........................................................................................................................................15
4.1 Use of software generated information..........................................................................15
4.2 Determination of Gantt Chart and critical path system..................................................16
4.3 Use of financial information source in order to take better decision.............................18
CONCLUSION..............................................................................................................................19
REFERENCES..............................................................................................................................20

⊘ This is a preview!⊘
Do you want full access?
Subscribe today to unlock all pages.
Trusted by 1+ million students worldwide
INTRODUCTION
In current scenario, it has been examined that making judgements at right time can give
many sort of advantages to a company at marketplace. To make a business more effective in
nature superiors of firms should locate all risks and problems while making decisions in
betterment of company (Barlett, 2016). Blackfriars Restaurant has been taken in this assignment
which is looking forward to open another outlet at targeted market so that profit can be earned at
maximum level. In this context, project will put light on various decision making process of
superiors of restaurant. Along with this, it is essential for them to form out a plan and for making
a program it is necessary for them to collect detailed data of desired objective. Lastly assessment
will show, table's statistical formulation and its usage which will help understanding the market
situation in a better way. With the aid of this, information which was generated by researcher
will put positive impact decision-making process.
TASK 1
1.1 Creation of sequence for collecting primary and secondary data
While formulating a plan, it is essential for an investigator to pick up right tools and
techniques at correct moment so that desired targets can get hit in more effective and efficient
way. Away from this, researcher can utilise many sort of approaches which will help out him/her
at the time of making decisions in an appropriate manner. Blackfriars Restaurant can use many
tools for collecting relevant data which are mentioned beneath:
Primary data: This type of approach can be used by researcher in pulling out
authenticated facts and figures. Expected results can be gained by an investigator while asking
questions from targeted people. But, it is both time and cost consuming process which may delay
the process of project. Interviews, questionnaire, live chat are some of examples of this type of
data analysis approach (Beach and Lipshitz, 2017).
Secondary data: One of the main method which is mostly used by investigator in today's
world which can be used by gathering information that is related to set target. Under this, data
can be collected through various things like internet, books, magazines and etc.
In this assignment, the best suitable method which is being chosen by researcher is
primary data. With the help of this, perceptions of selected respondents can be taken which will
1
Paraphrase This Document
Need a fresh take? Get an instant paraphrase of this document with our AI Paraphraser
directly help in decision-making process. Grabbing data in an appropriate manner it is essential
to follow a structure which is mentioned beneath:
Determine the flexibility of information which is related to desired objective.
After this, a sample size needs to get fixed in an appropriate sort of manner.
Formulate a questionnaire.
Utilise best approach which can help investigator in desired outcome (Blondel and
Müller-Rommel, 2016).
1.2 Survey methodology and sampling frame used
Survey methodologies is a study of individual sample unit form whole population. This
method includes procedures and instrument that ask one and more questions which may or may
not be answered. This are associated with survey data collection techniques. Its is very important
for researcher to organise research activities in appropriate manner. There are several survey
methodology get identify in study out of which Blackfriars need to adopt appropriate one:
Questionnaire: In this method, researcher ask some relevant question to customers by
providing various alternative option. Which help them to draw valid conclusion. It is a
one of the appropriate techniques to conducting survey, so that personal opinion of
individual person are receive. It enable effective judgement so that thus help to beneficial
in interpretation.
Personal interview: Through this method, researcher analysis customer's needs and wants
and take appropriate action to full fill their demand in an effective manner. This provide
better suited aspect thus enhance effectiveness of interview method.
Social media: As per the current scenario social media network are emerging g source of
survey. It save time and money of the company.
Out of all methodologies tool social media questionnaire are the best techniques of collecting
appropriate information and data form several respondent (Drucker, 2017). This get done by
find out respondent form firms social media page and invent them to full fill questionnaire. So
that, all persons have some basic knowledge about company and their product as well as
services. Various sampling tools for Blackfriars research are as follows:
Strata sampling
Random sampling
Quota sampling
2
form all available method, random sampling are best tools to collecting appropriate response
which help to draw valid conclusion. Researcher select different individual through this sampling
method which increase accuracy of outcomes. This will support research activities in order to
determine better result (Goleman, 2017).
1.3 Design a questionnaire
Any survey or study need appropriate and specific method to organise it properly.
Questionnaire is a kind of tool for gathering information through diverse sources so that better
understanding about an individual aspect could be understand and analyse. Thus, this survey
provide and support to gain feedback directly from individuals so that better concerning things
could be done. Blackfriars restaurant need to organise this study properly so that better gaining
of responses could be done. This questionnaire includes 10 major questions and conduct on 80
respondents.
QUESTIONNAIRE
Name:
Age:
Gender:
Q1. Do you like the quality of products and services deliver by Blackfriars?
a) Good
b) Excellent
c) Bad
Q2. Are we able to fulfil needs and demands of various individual?
a) Yes
b) No
Q3. How much time you visit to restaurant in a month?
a) Twice
b) Once
c) Rarely
Q4. Do you like the products range and its price?
a) Yes
b) No
3
⊘ This is a preview!⊘
Do you want full access?
Subscribe today to unlock all pages.
Trusted by 1+ million students worldwide
Q5. Have you ever realise that beverages are not appropriate in quality standard?
a) Yes
b) No
Q6. Do you find that our staff is friendly with every user?
a) Agree
b) Strongly Disagree
Q7. Categorise the Blackfriars as per the services provided?
a) Five star
b) Three star
c) Average
Q8. Does you ever refer Murano to others?
a) Yes
b) No
Q9. Which location is convenient for Murano new chain?
a) Near to sea side
b) Rooftop
Q10. Any further and appropriate suggestion...
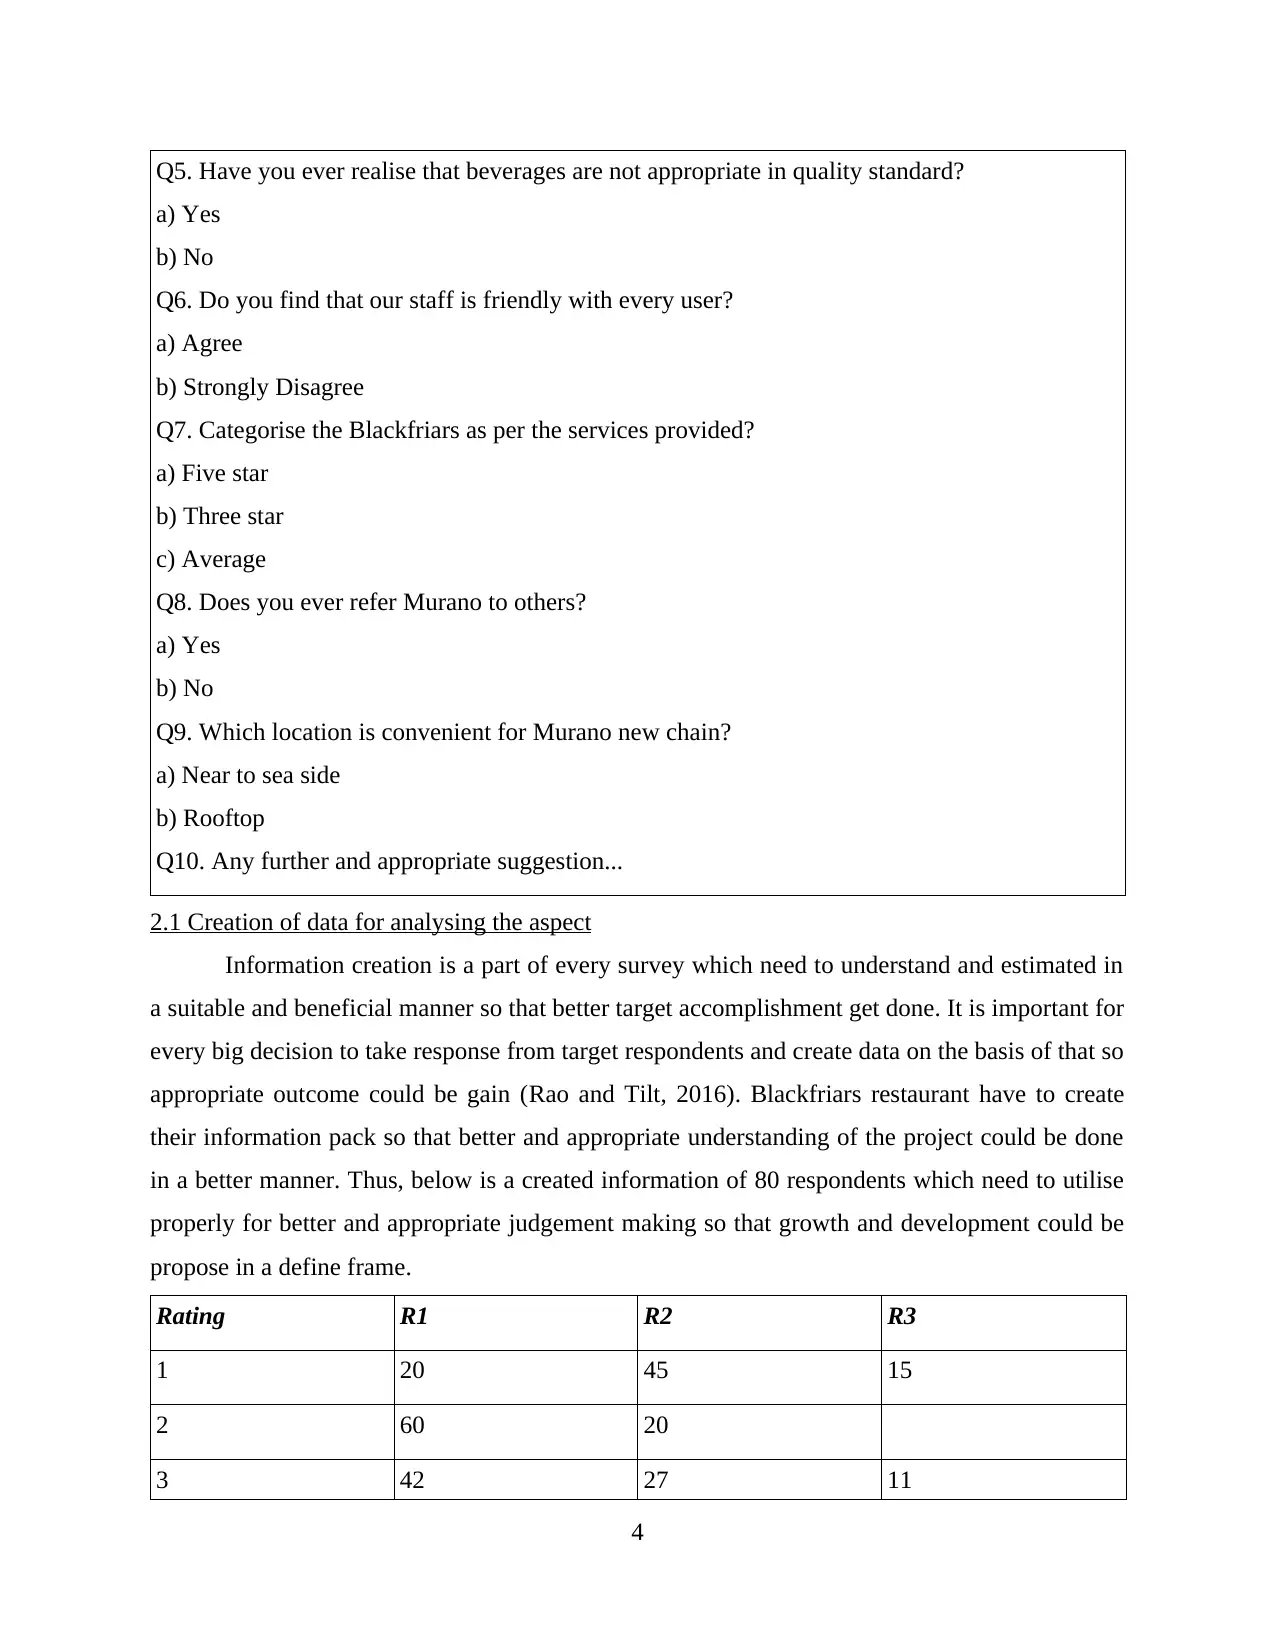
2.1 Creation of data for analysing the aspect
Information creation is a part of every survey which need to understand and estimated in
a suitable and beneficial manner so that better target accomplishment get done. It is important for
every big decision to take response from target respondents and create data on the basis of that so
appropriate outcome could be gain (Rao and Tilt, 2016). Blackfriars restaurant have to create
their information pack so that better and appropriate understanding of the project could be done
in a better manner. Thus, below is a created information of 80 respondents which need to utilise
properly for better and appropriate judgement making so that growth and development could be
propose in a define frame.
Rating R1 R2 R3
1 20 45 15
2 60 20
3 42 27 11
4
a) Yes
b) No
Q6. Do you find that our staff is friendly with every user?
a) Agree
b) Strongly Disagree
Q7. Categorise the Blackfriars as per the services provided?
a) Five star
b) Three star
c) Average
Q8. Does you ever refer Murano to others?
a) Yes
b) No
Q9. Which location is convenient for Murano new chain?
a) Near to sea side
b) Rooftop
Q10. Any further and appropriate suggestion...
2.1 Creation of data for analysing the aspect
Information creation is a part of every survey which need to understand and estimated in
a suitable and beneficial manner so that better target accomplishment get done. It is important for
every big decision to take response from target respondents and create data on the basis of that so
appropriate outcome could be gain (Rao and Tilt, 2016). Blackfriars restaurant have to create
their information pack so that better and appropriate understanding of the project could be done
in a better manner. Thus, below is a created information of 80 respondents which need to utilise
properly for better and appropriate judgement making so that growth and development could be
propose in a define frame.
Rating R1 R2 R3
1 20 45 15
2 60 20
3 42 27 11
4
Paraphrase This Document
Need a fresh take? Get an instant paraphrase of this document with our AI Paraphraser
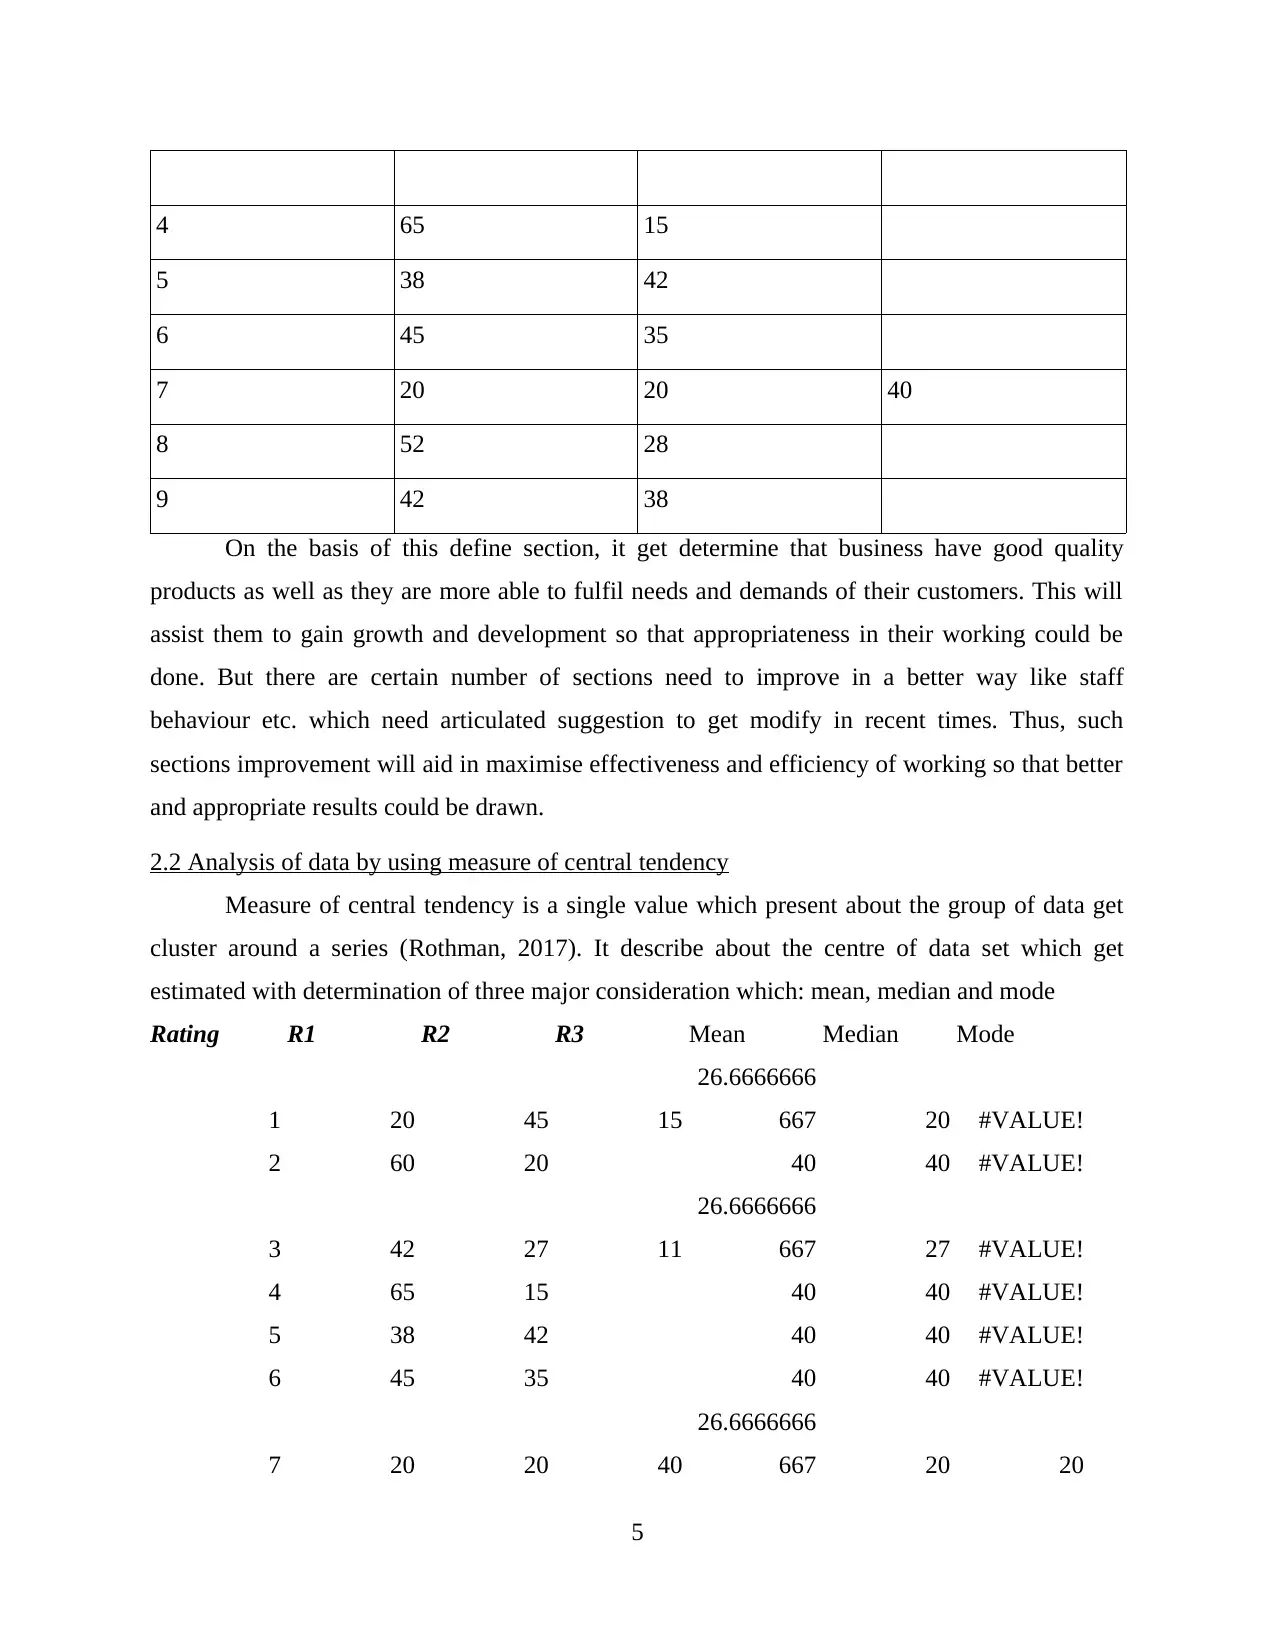
4 65 15
5 38 42
6 45 35
7 20 20 40
8 52 28
9 42 38
On the basis of this define section, it get determine that business have good quality
products as well as they are more able to fulfil needs and demands of their customers. This will
assist them to gain growth and development so that appropriateness in their working could be
done. But there are certain number of sections need to improve in a better way like staff
behaviour etc. which need articulated suggestion to get modify in recent times. Thus, such
sections improvement will aid in maximise effectiveness and efficiency of working so that better
and appropriate results could be drawn.
2.2 Analysis of data by using measure of central tendency
Measure of central tendency is a single value which present about the group of data get
cluster around a series (Rothman, 2017). It describe about the centre of data set which get
estimated with determination of three major consideration which: mean, median and mode
Rating R1 R2 R3 Mean Median Mode
1 20 45 15
26.6666666
667 20 #VALUE!
2 60 20 40 40 #VALUE!
3 42 27 11
26.6666666
667 27 #VALUE!
4 65 15 40 40 #VALUE!
5 38 42 40 40 #VALUE!
6 45 35 40 40 #VALUE!
7 20 20 40
26.6666666
667 20 20
5
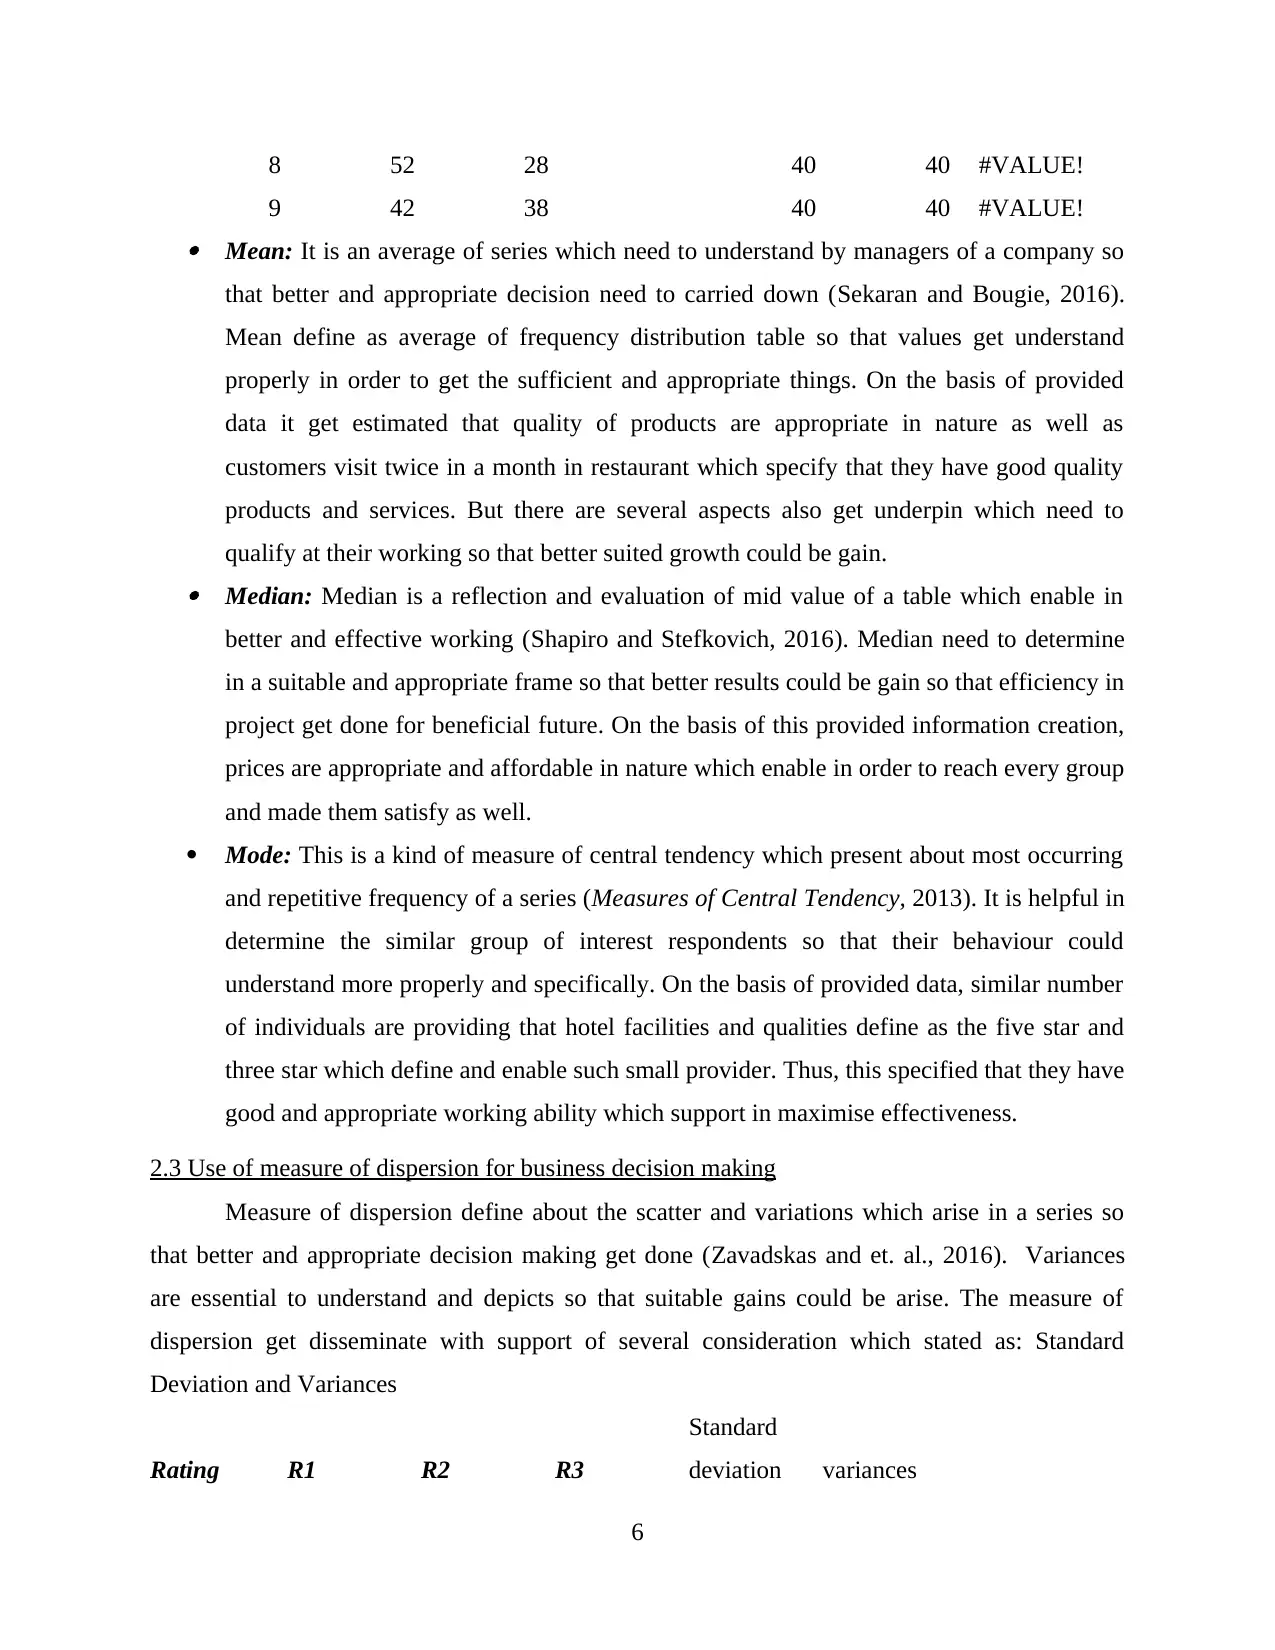
8 52 28 40 40 #VALUE!
9 42 38 40 40 #VALUE! Mean: It is an average of series which need to understand by managers of a company so
that better and appropriate decision need to carried down (Sekaran and Bougie, 2016).
Mean define as average of frequency distribution table so that values get understand
properly in order to get the sufficient and appropriate things. On the basis of provided
data it get estimated that quality of products are appropriate in nature as well as
customers visit twice in a month in restaurant which specify that they have good quality
products and services. But there are several aspects also get underpin which need to
qualify at their working so that better suited growth could be gain. Median: Median is a reflection and evaluation of mid value of a table which enable in
better and effective working (Shapiro and Stefkovich, 2016). Median need to determine
in a suitable and appropriate frame so that better results could be gain so that efficiency in
project get done for beneficial future. On the basis of this provided information creation,
prices are appropriate and affordable in nature which enable in order to reach every group
and made them satisfy as well.
Mode: This is a kind of measure of central tendency which present about most occurring
and repetitive frequency of a series (Measures of Central Tendency, 2013). It is helpful in
determine the similar group of interest respondents so that their behaviour could
understand more properly and specifically. On the basis of provided data, similar number
of individuals are providing that hotel facilities and qualities define as the five star and
three star which define and enable such small provider. Thus, this specified that they have
good and appropriate working ability which support in maximise effectiveness.
2.3 Use of measure of dispersion for business decision making
Measure of dispersion define about the scatter and variations which arise in a series so
that better and appropriate decision making get done (Zavadskas and et. al., 2016). Variances
are essential to understand and depicts so that suitable gains could be arise. The measure of
dispersion get disseminate with support of several consideration which stated as: Standard
Deviation and Variances
Rating R1 R2 R3
Standard
deviation variances
6
⊘ This is a preview!⊘
Do you want full access?
Subscribe today to unlock all pages.
Trusted by 1+ million students worldwide
1 20 45 15
16.0727512
683
258.333333
3333
2 60 20
28.2842712
475 800
3 42 27 11
15.5026879
39
240.333333
3333
4 65 15
35.3553390
593 1250
5 38 42
2.82842712
47 8
6 45 35
7.07106781
19 50
7 20 20 40
11.5470053
838
133.333333
3333
8 52 28
16.9705627
485 288
9 42 38
2.82842712
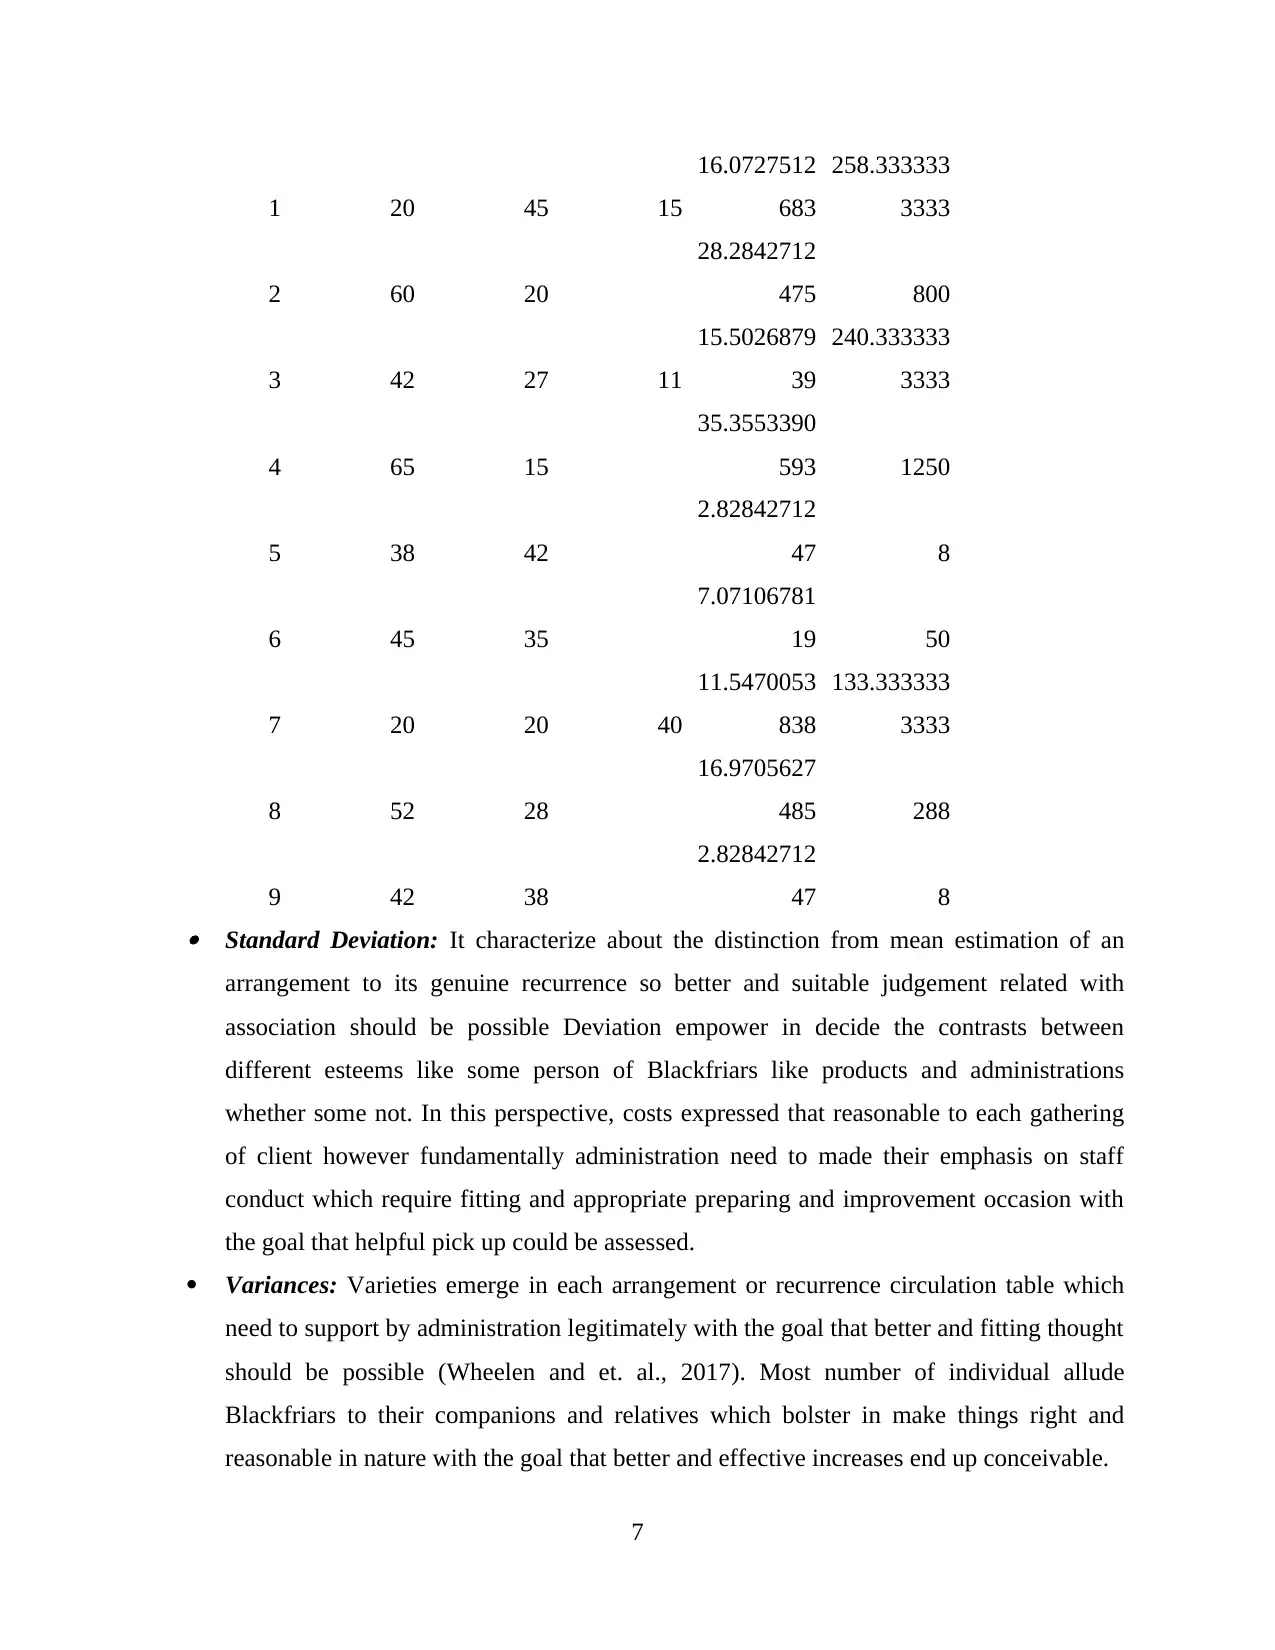
47 8 Standard Deviation: It characterize about the distinction from mean estimation of an
arrangement to its genuine recurrence so better and suitable judgement related with
association should be possible Deviation empower in decide the contrasts between
different esteems like some person of Blackfriars like products and administrations
whether some not. In this perspective, costs expressed that reasonable to each gathering
of client however fundamentally administration need to made their emphasis on staff
conduct which require fitting and appropriate preparing and improvement occasion with
the goal that helpful pick up could be assessed.
Variances: Varieties emerge in each arrangement or recurrence circulation table which
need to support by administration legitimately with the goal that better and fitting thought
should be possible (Wheelen and et. al., 2017). Most number of individual allude
Blackfriars to their companions and relatives which bolster in make things right and
reasonable in nature with the goal that better and effective increases end up conceivable.
7
16.0727512
683
258.333333
3333
2 60 20
28.2842712
475 800
3 42 27 11
15.5026879
39
240.333333
3333
4 65 15
35.3553390
593 1250
5 38 42
2.82842712
47 8
6 45 35
7.07106781
19 50
7 20 20 40
11.5470053
838
133.333333
3333
8 52 28
16.9705627
485 288
9 42 38
2.82842712
47 8 Standard Deviation: It characterize about the distinction from mean estimation of an
arrangement to its genuine recurrence so better and suitable judgement related with
association should be possible Deviation empower in decide the contrasts between
different esteems like some person of Blackfriars like products and administrations
whether some not. In this perspective, costs expressed that reasonable to each gathering
of client however fundamentally administration need to made their emphasis on staff
conduct which require fitting and appropriate preparing and improvement occasion with
the goal that helpful pick up could be assessed.
Variances: Varieties emerge in each arrangement or recurrence circulation table which
need to support by administration legitimately with the goal that better and fitting thought
should be possible (Wheelen and et. al., 2017). Most number of individual allude
Blackfriars to their companions and relatives which bolster in make things right and
reasonable in nature with the goal that better and effective increases end up conceivable.
7
Paraphrase This Document
Need a fresh take? Get an instant paraphrase of this document with our AI Paraphraser
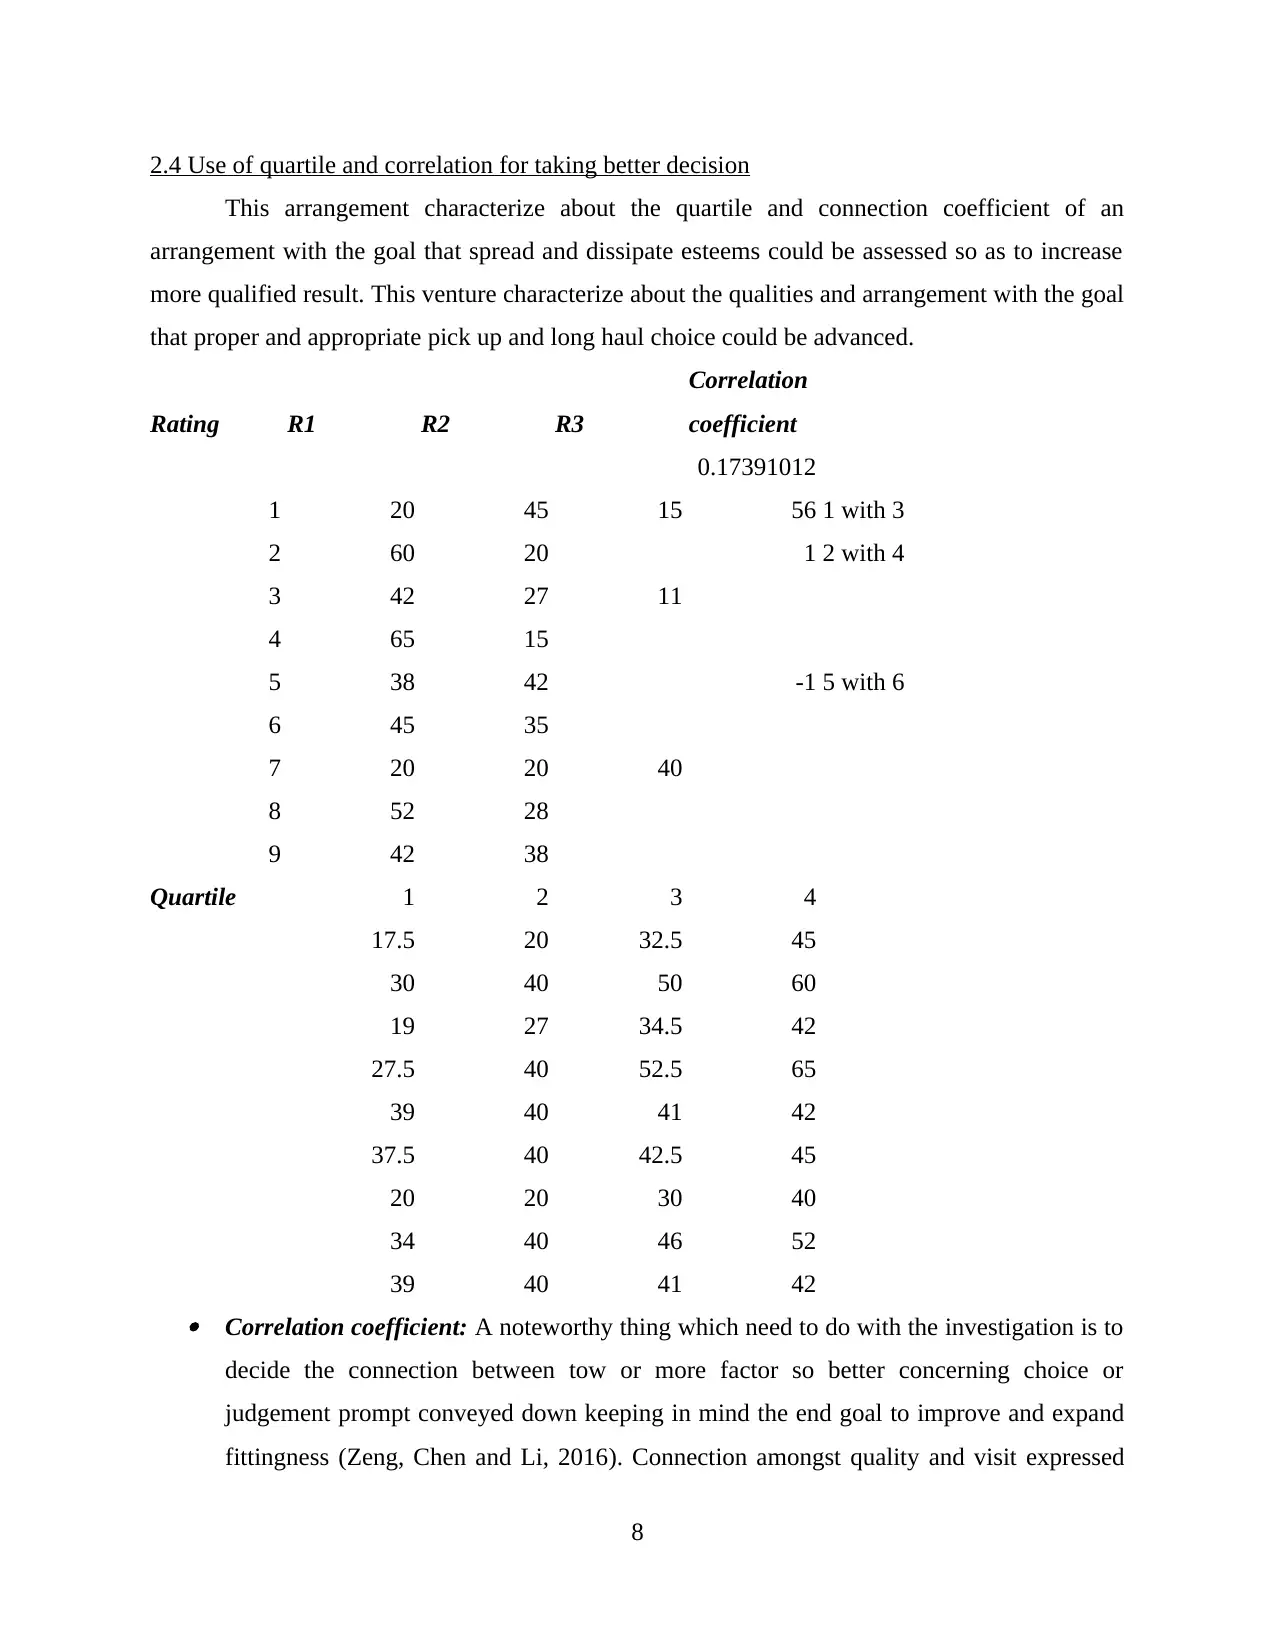
2.4 Use of quartile and correlation for taking better decision
This arrangement characterize about the quartile and connection coefficient of an
arrangement with the goal that spread and dissipate esteems could be assessed so as to increase
more qualified result. This venture characterize about the qualities and arrangement with the goal
that proper and appropriate pick up and long haul choice could be advanced.
Rating R1 R2 R3
Correlation
coefficient
1 20 45 15
0.17391012
56 1 with 3
2 60 20 1 2 with 4
3 42 27 11
4 65 15
5 38 42 -1 5 with 6
6 45 35
7 20 20 40
8 52 28
9 42 38
Quartile 1 2 3 4
17.5 20 32.5 45
30 40 50 60
19 27 34.5 42
27.5 40 52.5 65
39 40 41 42
37.5 40 42.5 45
20 20 30 40
34 40 46 52
39 40 41 42 Correlation coefficient: A noteworthy thing which need to do with the investigation is to
decide the connection between tow or more factor so better concerning choice or
judgement prompt conveyed down keeping in mind the end goal to improve and expand
fittingness (Zeng, Chen and Li, 2016). Connection amongst quality and visit expressed
8
that Blackfriars convey astounding quality items whose reflection get support in number
of visit by their clients. In this manner, twice in a month on a normal individual visit to
eatery with their family or dear ones.
Quartile: A quartile isolate different area into some quantifiable viewpoints through
which better and proper basic leadership complete. The four noteworthy quadrant
partition every single segment appropriately like littlest to most astounding, centre one
gap two segment and so on. Consequently, business need to change their working at some
degree to get a tag of Five star inn and need to convey legitimate preparing with the goal
that better productivity could be oversee and keep up.
TASK 2
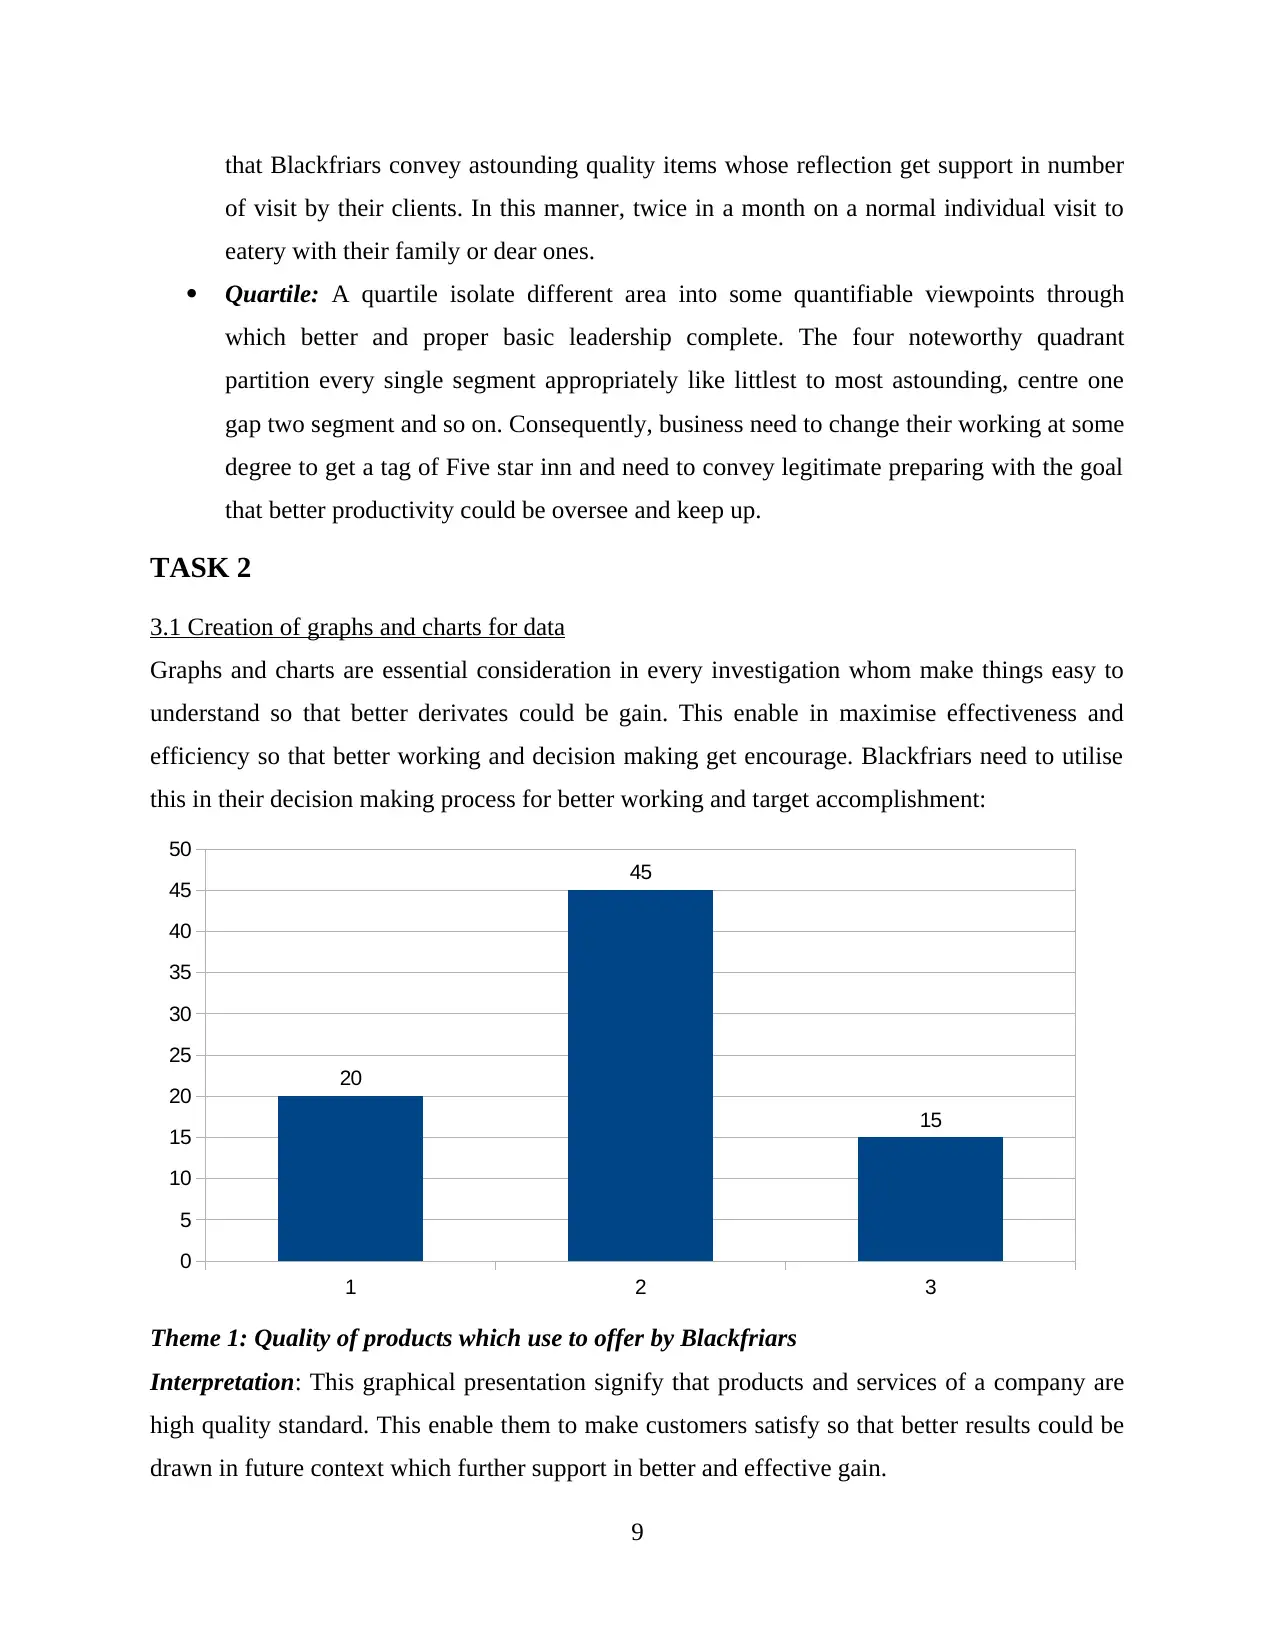
3.1 Creation of graphs and charts for data
Graphs and charts are essential consideration in every investigation whom make things easy to
understand so that better derivates could be gain. This enable in maximise effectiveness and
efficiency so that better working and decision making get encourage. Blackfriars need to utilise
this in their decision making process for better working and target accomplishment:
1 2 3
0
5
10
15
20
25
30
35
40
45
50
20
45
15
Theme 1: Quality of products which use to offer by Blackfriars
Interpretation: This graphical presentation signify that products and services of a company are
high quality standard. This enable them to make customers satisfy so that better results could be
drawn in future context which further support in better and effective gain.
9
of visit by their clients. In this manner, twice in a month on a normal individual visit to
eatery with their family or dear ones.
Quartile: A quartile isolate different area into some quantifiable viewpoints through
which better and proper basic leadership complete. The four noteworthy quadrant
partition every single segment appropriately like littlest to most astounding, centre one
gap two segment and so on. Consequently, business need to change their working at some
degree to get a tag of Five star inn and need to convey legitimate preparing with the goal
that better productivity could be oversee and keep up.
TASK 2
3.1 Creation of graphs and charts for data
Graphs and charts are essential consideration in every investigation whom make things easy to
understand so that better derivates could be gain. This enable in maximise effectiveness and
efficiency so that better working and decision making get encourage. Blackfriars need to utilise
this in their decision making process for better working and target accomplishment:
1 2 3
0
5
10
15
20
25
30
35
40
45
50
20
45
15
Theme 1: Quality of products which use to offer by Blackfriars
Interpretation: This graphical presentation signify that products and services of a company are
high quality standard. This enable them to make customers satisfy so that better results could be
drawn in future context which further support in better and effective gain.
9
⊘ This is a preview!⊘
Do you want full access?
Subscribe today to unlock all pages.
Trusted by 1+ million students worldwide
1 out of 23
Related Documents


Your All-in-One AI-Powered Toolkit for Academic Success.
+13062052269
info@desklib.com
Available 24*7 on WhatsApp / Email
![[object Object]](/_next/static/media/star-bottom.7253800d.svg)
Unlock your academic potential
Copyright © 2020–2026 A2Z Services. All Rights Reserved. Developed and managed by ZUCOL.