HND Business Decision Making Report: Data Analysis and Strategy
VerifiedAdded on 2020/06/04
|24
|4961
|67
Report
AI Summary
This report is a comprehensive analysis of business decision-making processes, focusing on data collection, analysis, and the application of statistical techniques. The assignment involves creating a plan for collecting both primary and secondary data, designing a questionnaire, and presenting the survey methodology and sample frame. The analysis includes summarizing data, using measures of central tendency and dispersion, and applying quartile, percentile, and correlation coefficients to draw valid conclusions. Furthermore, the report includes the formulation of graphs and charts for data presentation, trend line creation for future forecasting, and the use of information processing tools, project planning, and financial methods to aid in decision-making for the hypothetical Murano restaurant. The report concludes with a discussion of the findings and recommendations for the business.
Business Decision Making
Paraphrase This Document
Need a fresh take? Get an instant paraphrase of this document with our AI Paraphraser
Table of Contents
INTRODUCTION...........................................................................................................................1
TASK 1............................................................................................................................................1
1.1 Create a plan for collecting primary and secondary data......................................................1
1.2 Present the survey methodology and sample frame used......................................................2
1.3 Design a questionnaire for collection of data........................................................................2
2.1 Information creation and summarisation by using various values........................................4
2.2 Use of measure of central tendency for result.......................................................................5
2.3 Data analysis by using measure of dispersion.......................................................................8
2.4 Use of quartile, percentile and correlation coefficient for valid decision.............................8
TASK 2..........................................................................................................................................11
3.1 Formulation of graphs and charts to present the findings...................................................11
3.2 Creation of trend line in better future forecasting...............................................................15
3.3 Business presentation (Covered in power point presentation)............................................16
3.4 Formal business report........................................................................................................17
TASK 3..........................................................................................................................................17
4.1 Use of information processing tool.....................................................................................17
4.2 Project plan for the activity and critical path......................................................................18
4.3 Financial methods use in decision making..........................................................................19
CONCLUSION..............................................................................................................................21
REFERENCES..............................................................................................................................22
INTRODUCTION
In every business, an entrepreneur have to take some big and essential decisions which
are helpful and promote sustainability of an enterprise. It is a duty of managers to present every
report of regular operation in front of senior management through which they become enable in
taking a beneficial decision for betterment and growth (Ferrell and Fraedrich, 2015). This
assignment is based on Murano restaurant who want to organise another restaurant in London.
For gaining appropriate information about this, a research get conducted in which collection of
primary and secondary data get done. Once the information get gather its analysis have to done
in an adequate manner. Along with this by using measure of central tendency and measure of
dispersion, appropriate decision for future also take place. Charts, graphs make the presentation
more interesting as well as trend line will support in future forecasting. Calculation of NPV and
IRR enable in measuring feasibility of project.
TASK 1
1.1 Create a plan for collecting primary and secondary data
Data collection is not a easy task for the research and require proper planning
management through which adequate information can gather easily (Ford and Richardson, 2013).
There are mainly two sort of data are identify which are: primary data and secondary data.
Murano hotel managers have to prepare a proper plan for collecting primary and secondary
information and utilise it in proper business project execution.
Primary data: This is such sort of data which collected first time for a specific problem or
purpose. The best way to collect primary data is survey, research by preparing questionnaire.
This primary data collection require appropriate plan for collecting data through various sources.
1. Identify the cause for which research is commencing
2. Choose suitable methodology
3. Targeting population
4. Time duration for a research
5. Budget allocation
This process have to follow by the managers of Murano and then start collecting data from
various number of respondents. Moreover time duration of this research is of one month and
random sampling method has been used for selecting diverse number of respondents.
1
⊘ This is a preview!⊘
Do you want full access?
Subscribe today to unlock all pages.
Trusted by 1+ million students worldwide
Secondary source: Another major source of data is secondary source of information. These are
such sort of information which are already collected for a specific purpose. Some major
techniques from which this process become easy is books, journals, articles etc. This process also
require some more time for investigation because it get done through various articles and internet
sources (Groebner and et. al., 2011).
1.2 Present the survey methodology and sample frame used
There are various survey methods are identify which are helpful in collection of data
(Laudon and Laudon, 2013). The survey methodology is a process through which various sort of
data can easily gather by using different tools and techniques. The various methods of survey
are:
Survey Monkey
Questionnaire
Social media
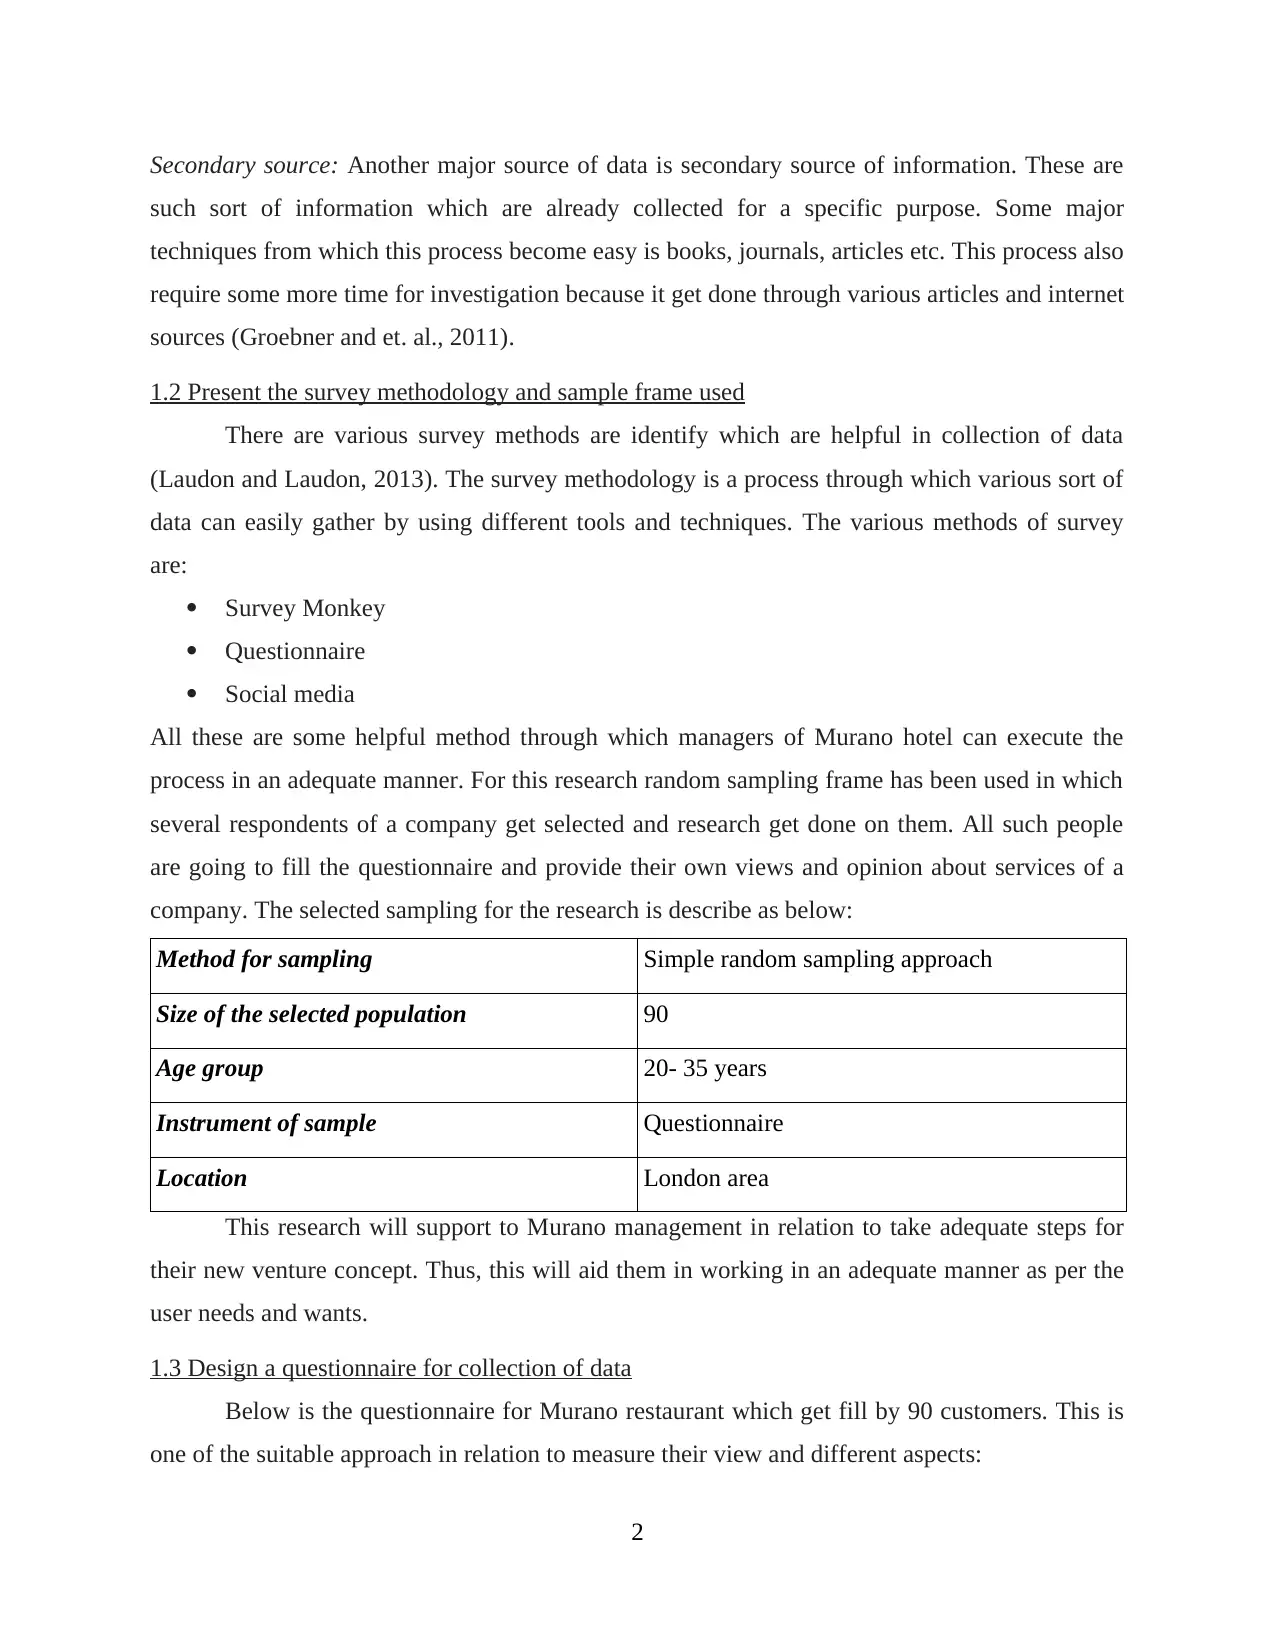
All these are some helpful method through which managers of Murano hotel can execute the
process in an adequate manner. For this research random sampling frame has been used in which
several respondents of a company get selected and research get done on them. All such people
are going to fill the questionnaire and provide their own views and opinion about services of a
company. The selected sampling for the research is describe as below:
Method for sampling Simple random sampling approach
Size of the selected population 90
Age group 20- 35 years
Instrument of sample Questionnaire
Location London area
This research will support to Murano management in relation to take adequate steps for
their new venture concept. Thus, this will aid them in working in an adequate manner as per the
user needs and wants.
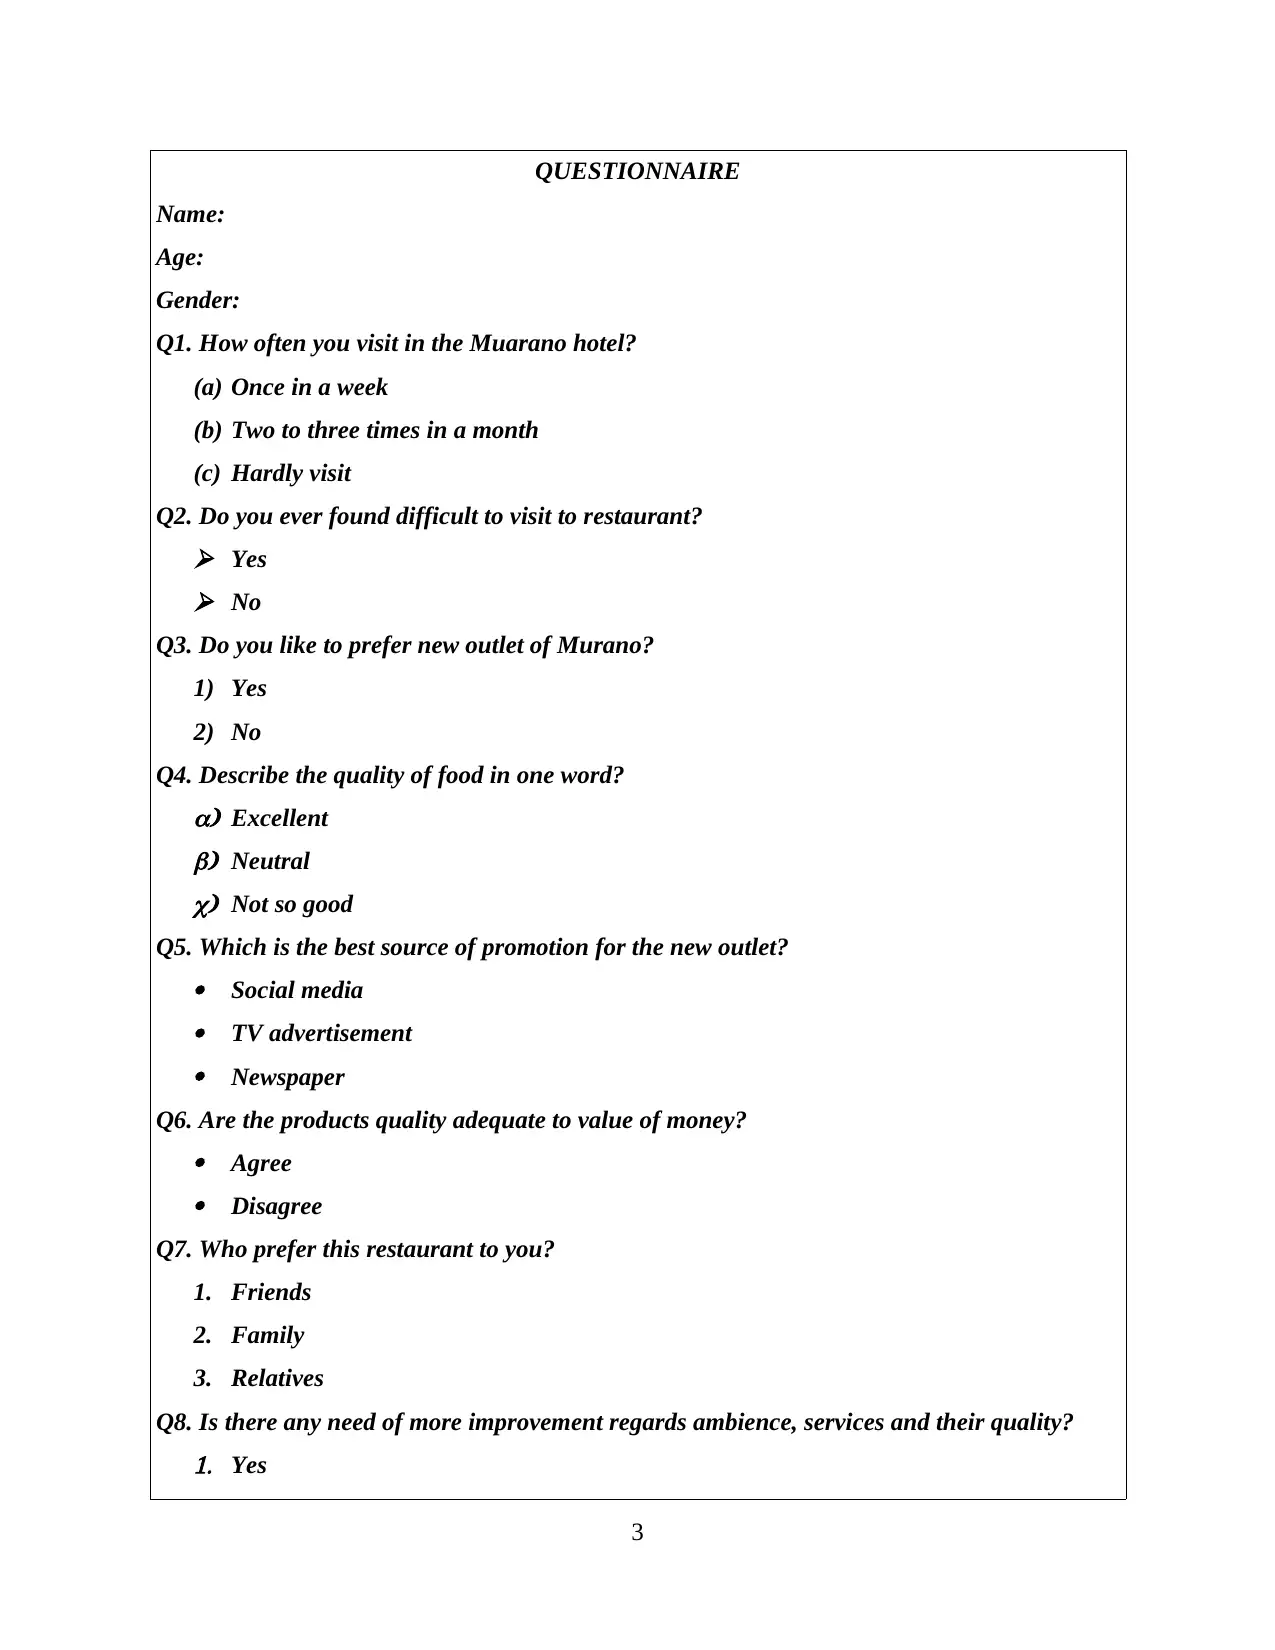
1.3 Design a questionnaire for collection of data
Below is the questionnaire for Murano restaurant which get fill by 90 customers. This is
one of the suitable approach in relation to measure their view and different aspects:
2
such sort of information which are already collected for a specific purpose. Some major
techniques from which this process become easy is books, journals, articles etc. This process also
require some more time for investigation because it get done through various articles and internet
sources (Groebner and et. al., 2011).
1.2 Present the survey methodology and sample frame used
There are various survey methods are identify which are helpful in collection of data
(Laudon and Laudon, 2013). The survey methodology is a process through which various sort of
data can easily gather by using different tools and techniques. The various methods of survey
are:
Survey Monkey
Questionnaire
Social media
All these are some helpful method through which managers of Murano hotel can execute the
process in an adequate manner. For this research random sampling frame has been used in which
several respondents of a company get selected and research get done on them. All such people
are going to fill the questionnaire and provide their own views and opinion about services of a
company. The selected sampling for the research is describe as below:
Method for sampling Simple random sampling approach
Size of the selected population 90
Age group 20- 35 years
Instrument of sample Questionnaire
Location London area
This research will support to Murano management in relation to take adequate steps for
their new venture concept. Thus, this will aid them in working in an adequate manner as per the
user needs and wants.
1.3 Design a questionnaire for collection of data
Below is the questionnaire for Murano restaurant which get fill by 90 customers. This is
one of the suitable approach in relation to measure their view and different aspects:
2
Paraphrase This Document
Need a fresh take? Get an instant paraphrase of this document with our AI Paraphraser
QUESTIONNAIRE
Name:
Age:
Gender:
Q1. How often you visit in the Muarano hotel?
(a) Once in a week
(b) Two to three times in a month
(c) Hardly visit
Q2. Do you ever found difficult to visit to restaurant? Yes No
Q3. Do you like to prefer new outlet of Murano?
1) Yes
2) No
Q4. Describe the quality of food in one word?a) Excellentb) Neutralc) Not so good
Q5. Which is the best source of promotion for the new outlet? Social media TV advertisement Newspaper
Q6. Are the products quality adequate to value of money? Agree Disagree
Q7. Who prefer this restaurant to you?
1. Friends
2. Family
3. Relatives
Q8. Is there any need of more improvement regards ambience, services and their quality?1. Yes
3
2. No
Q9. Which is the most influencing factor in restaurant? Hygiene Cost of dishes Nearness to house Ambiance
Q10. Any adequate suggestion for improvement?
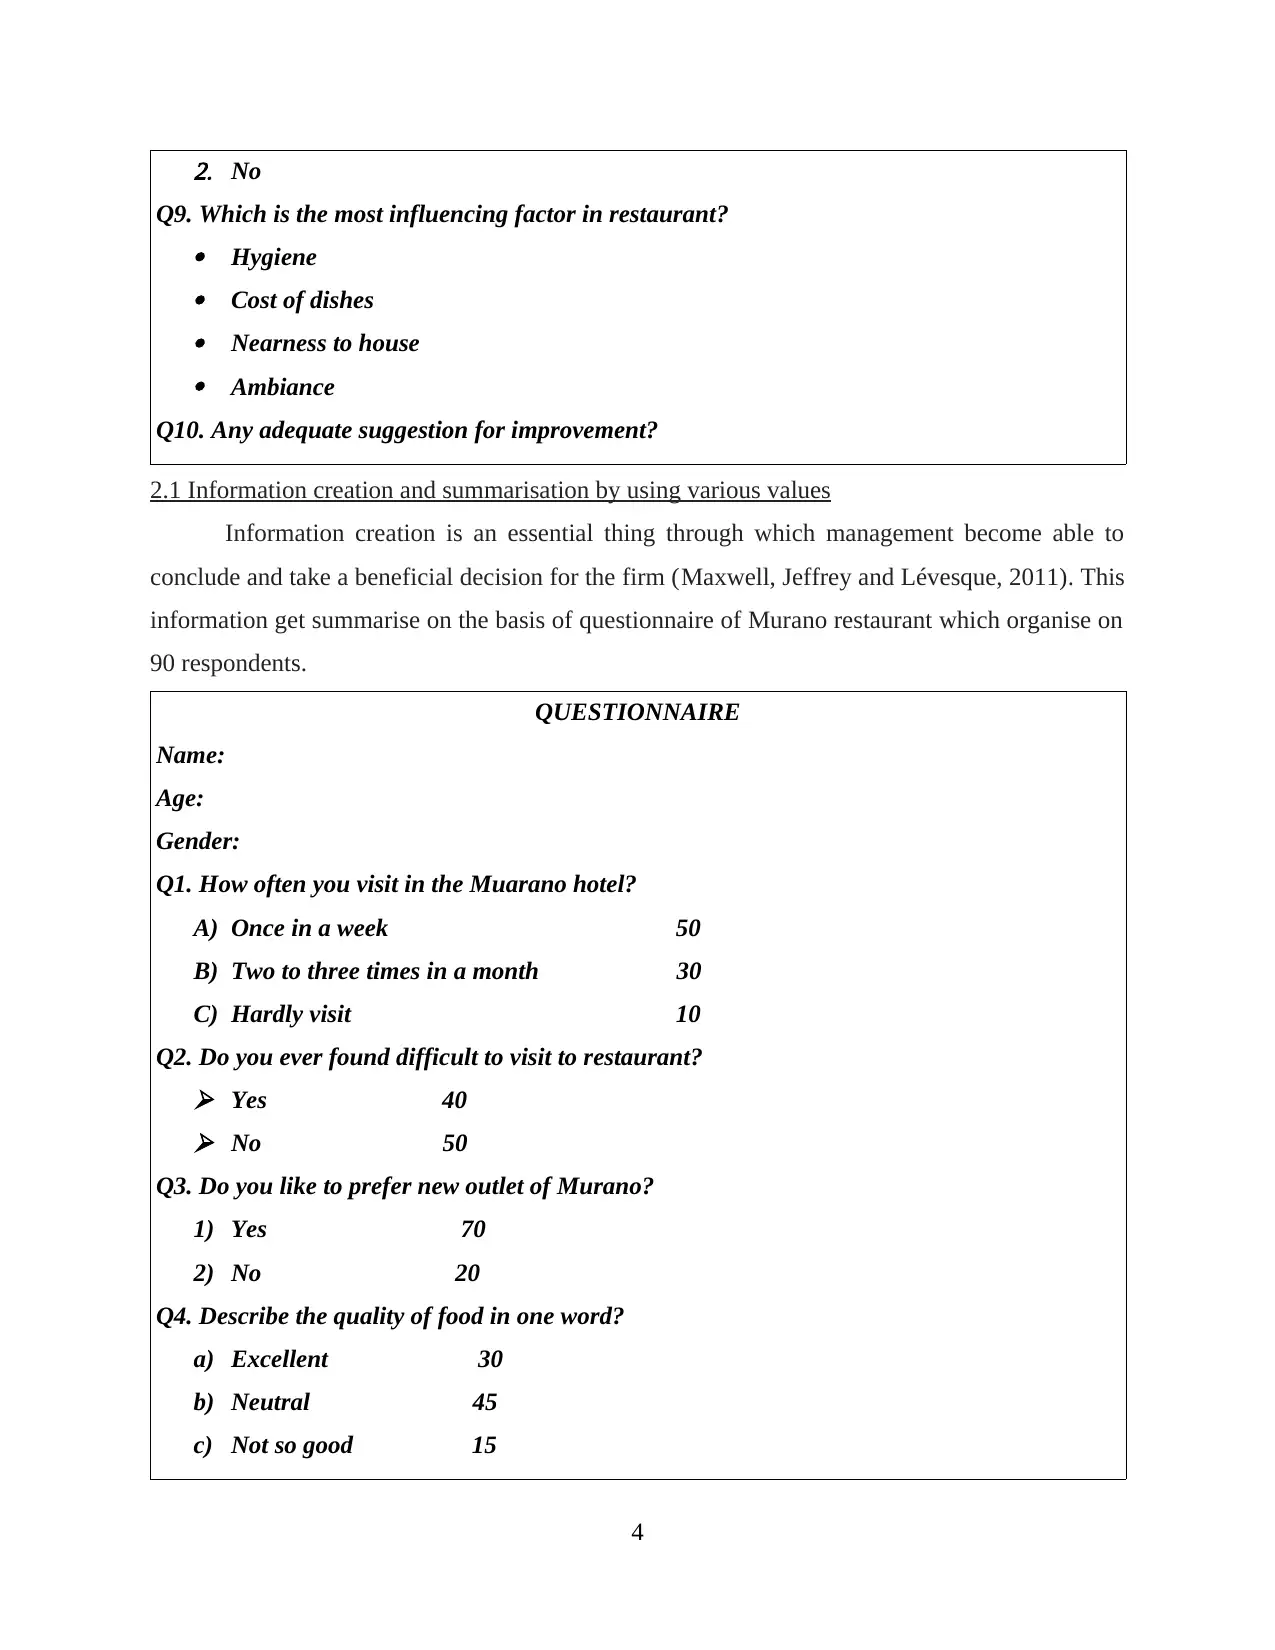
2.1 Information creation and summarisation by using various values
Information creation is an essential thing through which management become able to
conclude and take a beneficial decision for the firm (Maxwell, Jeffrey and Lévesque, 2011). This
information get summarise on the basis of questionnaire of Murano restaurant which organise on
90 respondents.
QUESTIONNAIRE
Name:
Age:
Gender:
Q1. How often you visit in the Muarano hotel?
A) Once in a week 50
B) Two to three times in a month 30
C) Hardly visit 10
Q2. Do you ever found difficult to visit to restaurant? Yes 40 No 50
Q3. Do you like to prefer new outlet of Murano?
1) Yes 70
2) No 20
Q4. Describe the quality of food in one word?
a) Excellent 30
b) Neutral 45
c) Not so good 15
4
Q9. Which is the most influencing factor in restaurant? Hygiene Cost of dishes Nearness to house Ambiance
Q10. Any adequate suggestion for improvement?
2.1 Information creation and summarisation by using various values
Information creation is an essential thing through which management become able to
conclude and take a beneficial decision for the firm (Maxwell, Jeffrey and Lévesque, 2011). This
information get summarise on the basis of questionnaire of Murano restaurant which organise on
90 respondents.
QUESTIONNAIRE
Name:
Age:
Gender:
Q1. How often you visit in the Muarano hotel?
A) Once in a week 50
B) Two to three times in a month 30
C) Hardly visit 10
Q2. Do you ever found difficult to visit to restaurant? Yes 40 No 50
Q3. Do you like to prefer new outlet of Murano?
1) Yes 70
2) No 20
Q4. Describe the quality of food in one word?
a) Excellent 30
b) Neutral 45
c) Not so good 15
4
⊘ This is a preview!⊘
Do you want full access?
Subscribe today to unlock all pages.
Trusted by 1+ million students worldwide
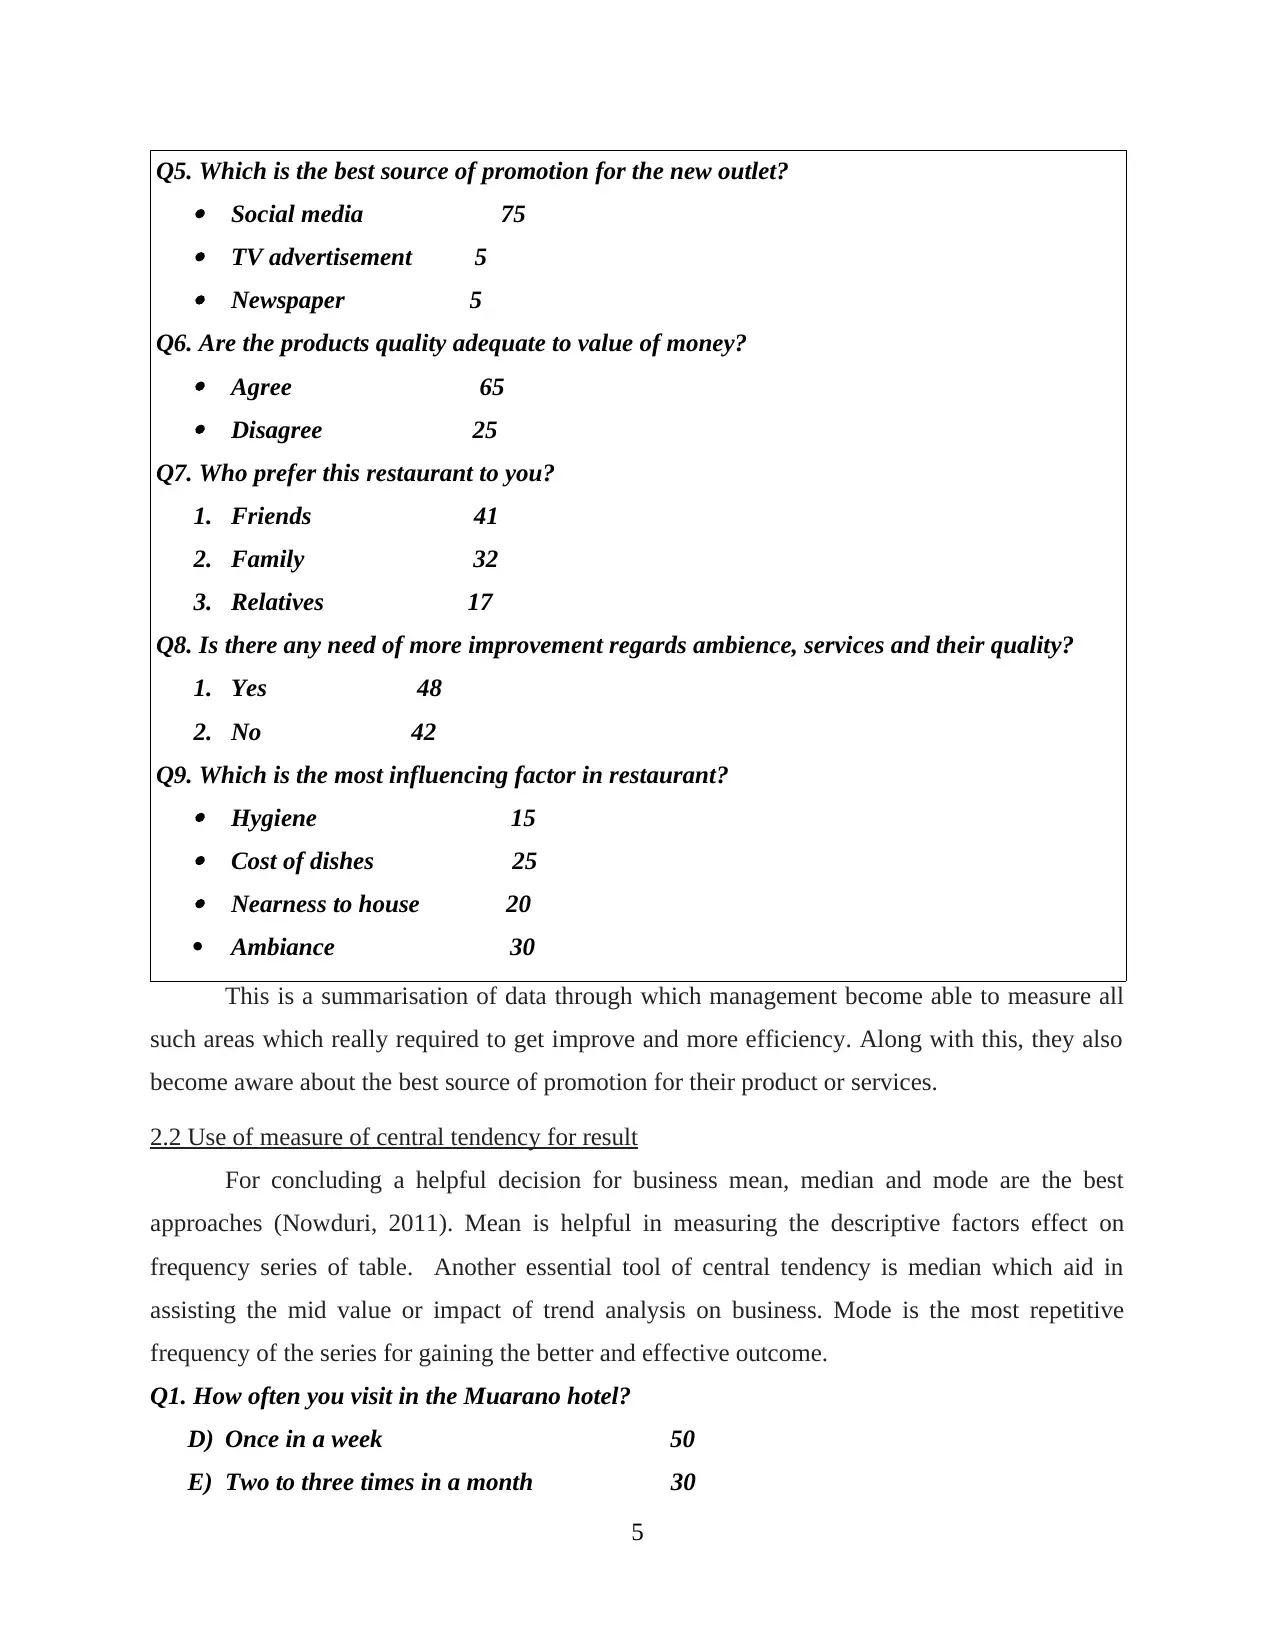
Q5. Which is the best source of promotion for the new outlet? Social media 75 TV advertisement 5 Newspaper 5
Q6. Are the products quality adequate to value of money? Agree 65 Disagree 25
Q7. Who prefer this restaurant to you?
1. Friends 41
2. Family 32
3. Relatives 17
Q8. Is there any need of more improvement regards ambience, services and their quality?
1. Yes 48
2. No 42
Q9. Which is the most influencing factor in restaurant? Hygiene 15 Cost of dishes 25 Nearness to house 20
Ambiance 30
This is a summarisation of data through which management become able to measure all
such areas which really required to get improve and more efficiency. Along with this, they also
become aware about the best source of promotion for their product or services.
2.2 Use of measure of central tendency for result
For concluding a helpful decision for business mean, median and mode are the best
approaches (Nowduri, 2011). Mean is helpful in measuring the descriptive factors effect on
frequency series of table. Another essential tool of central tendency is median which aid in
assisting the mid value or impact of trend analysis on business. Mode is the most repetitive
frequency of the series for gaining the better and effective outcome.
Q1. How often you visit in the Muarano hotel?
D) Once in a week 50
E) Two to three times in a month 30
5
Paraphrase This Document
Need a fresh take? Get an instant paraphrase of this document with our AI Paraphraser
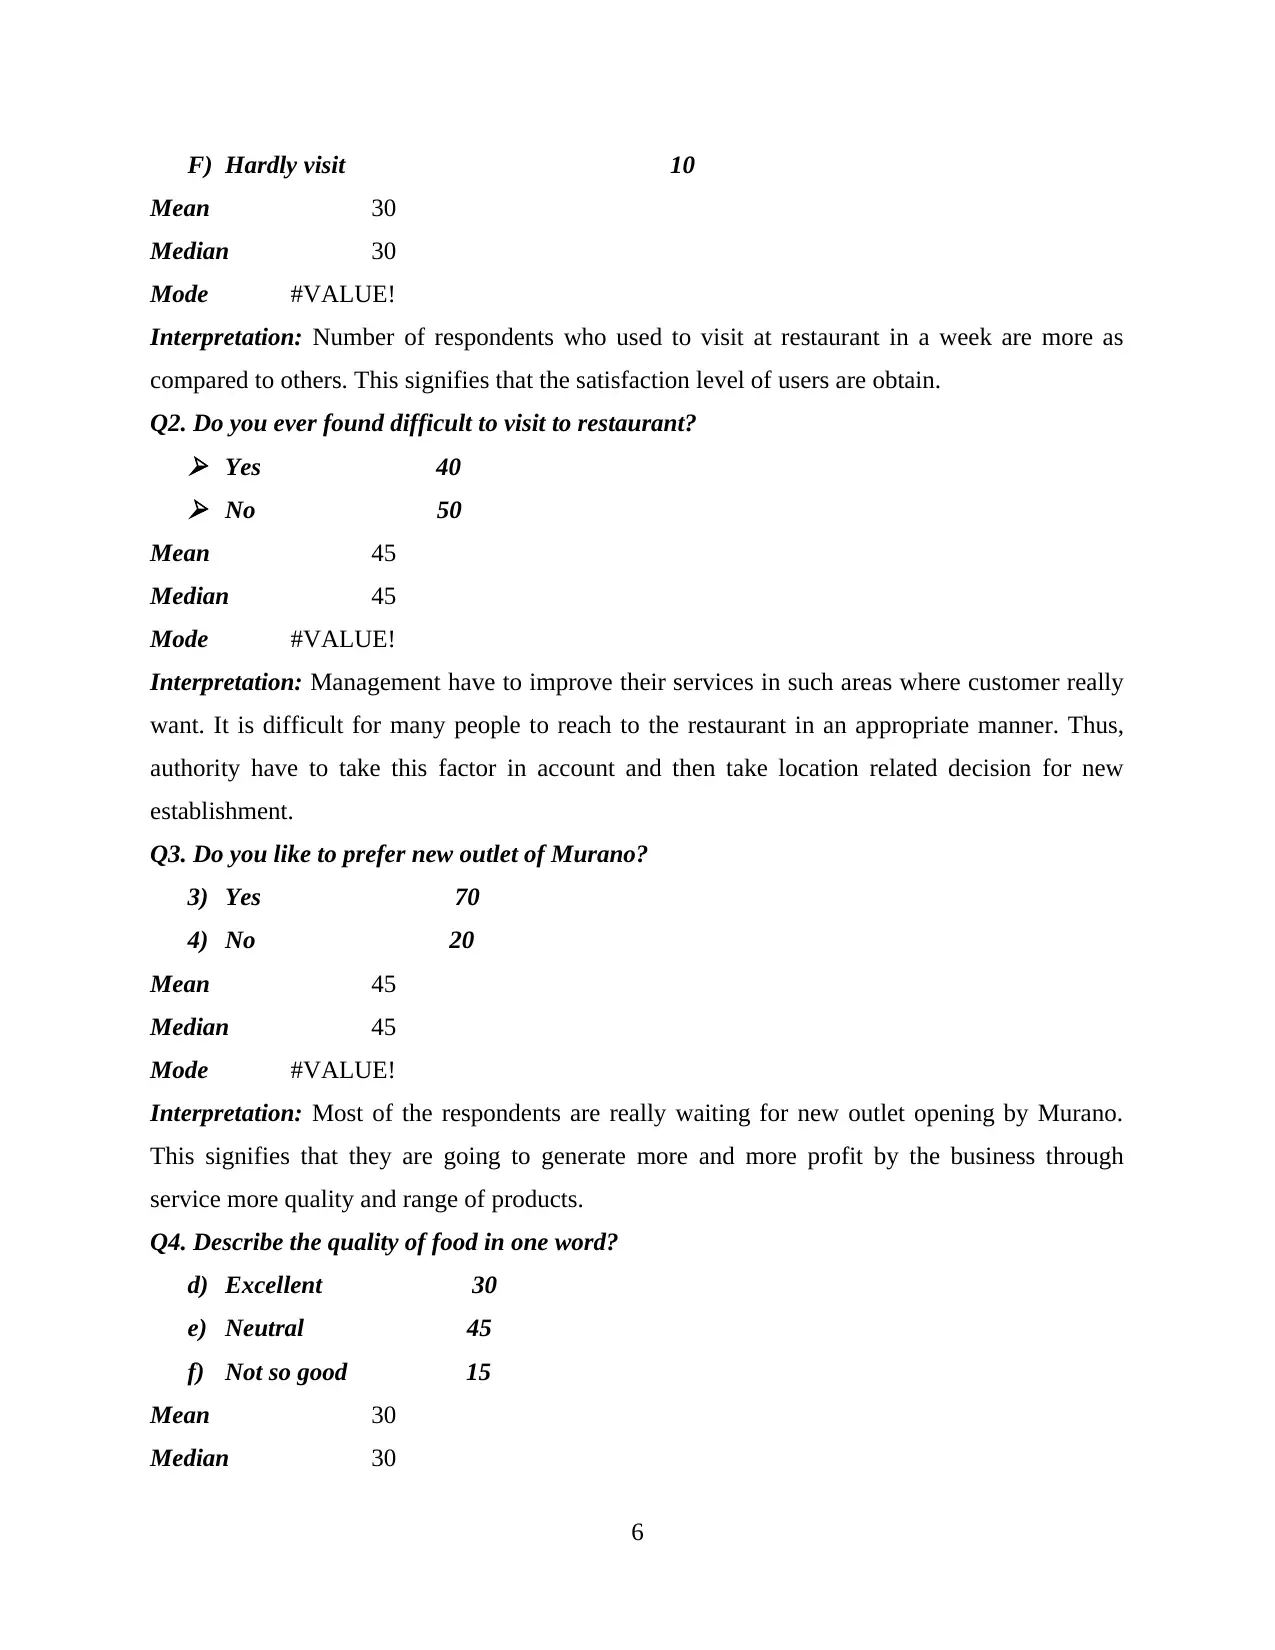
F) Hardly visit 10
Mean 30
Median 30
Mode #VALUE!
Interpretation: Number of respondents who used to visit at restaurant in a week are more as
compared to others. This signifies that the satisfaction level of users are obtain.
Q2. Do you ever found difficult to visit to restaurant? Yes 40 No 50
Mean 45
Median 45
Mode #VALUE!
Interpretation: Management have to improve their services in such areas where customer really
want. It is difficult for many people to reach to the restaurant in an appropriate manner. Thus,
authority have to take this factor in account and then take location related decision for new
establishment.
Q3. Do you like to prefer new outlet of Murano?
3) Yes 70
4) No 20
Mean 45
Median 45
Mode #VALUE!
Interpretation: Most of the respondents are really waiting for new outlet opening by Murano.
This signifies that they are going to generate more and more profit by the business through
service more quality and range of products.
Q4. Describe the quality of food in one word?
d) Excellent 30
e) Neutral 45
f) Not so good 15
Mean 30
Median 30
6
Mean 30
Median 30
Mode #VALUE!
Interpretation: Number of respondents who used to visit at restaurant in a week are more as
compared to others. This signifies that the satisfaction level of users are obtain.
Q2. Do you ever found difficult to visit to restaurant? Yes 40 No 50
Mean 45
Median 45
Mode #VALUE!
Interpretation: Management have to improve their services in such areas where customer really
want. It is difficult for many people to reach to the restaurant in an appropriate manner. Thus,
authority have to take this factor in account and then take location related decision for new
establishment.
Q3. Do you like to prefer new outlet of Murano?
3) Yes 70
4) No 20
Mean 45
Median 45
Mode #VALUE!
Interpretation: Most of the respondents are really waiting for new outlet opening by Murano.
This signifies that they are going to generate more and more profit by the business through
service more quality and range of products.
Q4. Describe the quality of food in one word?
d) Excellent 30
e) Neutral 45
f) Not so good 15
Mean 30
Median 30
6
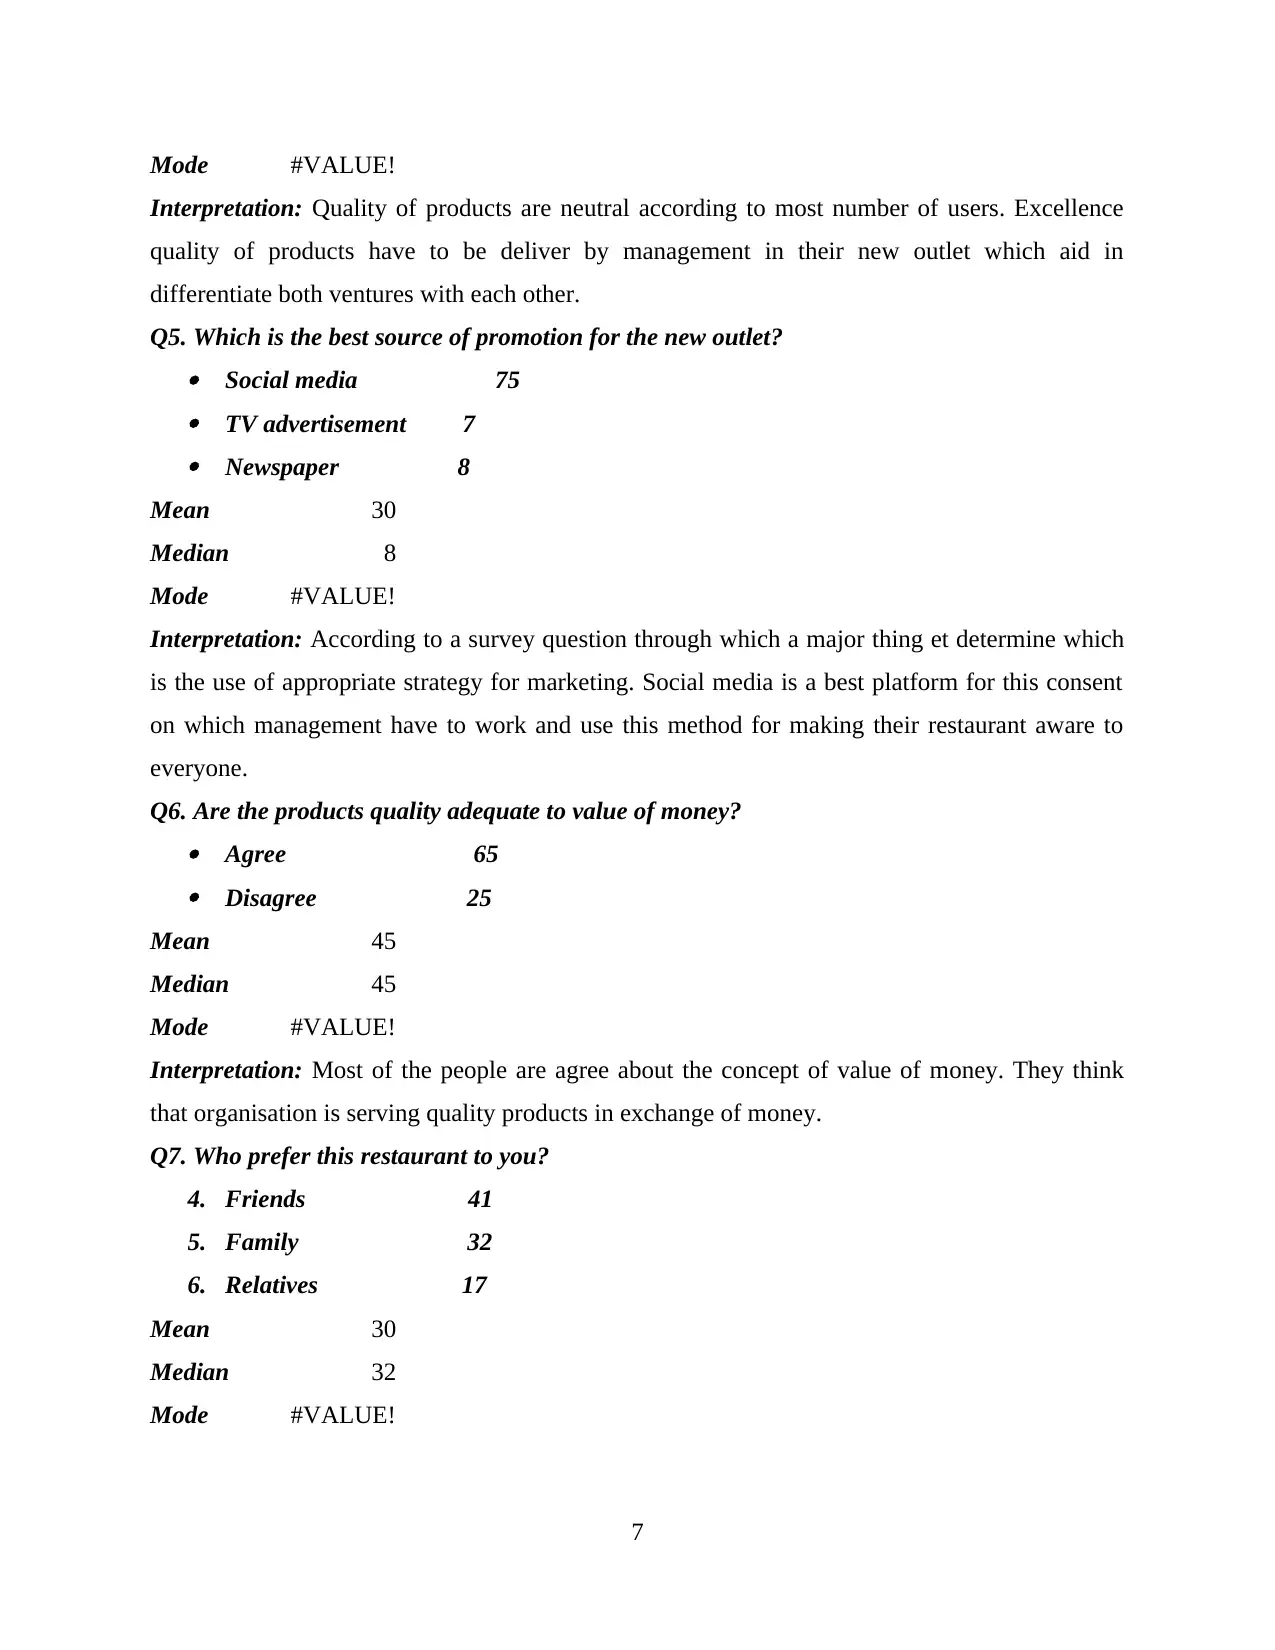
Mode #VALUE!
Interpretation: Quality of products are neutral according to most number of users. Excellence
quality of products have to be deliver by management in their new outlet which aid in
differentiate both ventures with each other.
Q5. Which is the best source of promotion for the new outlet? Social media 75 TV advertisement 7 Newspaper 8
Mean 30
Median 8
Mode #VALUE!
Interpretation: According to a survey question through which a major thing et determine which
is the use of appropriate strategy for marketing. Social media is a best platform for this consent
on which management have to work and use this method for making their restaurant aware to
everyone.
Q6. Are the products quality adequate to value of money? Agree 65 Disagree 25
Mean 45
Median 45
Mode #VALUE!
Interpretation: Most of the people are agree about the concept of value of money. They think
that organisation is serving quality products in exchange of money.
Q7. Who prefer this restaurant to you?
4. Friends 41
5. Family 32
6. Relatives 17
Mean 30
Median 32
Mode #VALUE!
7
⊘ This is a preview!⊘
Do you want full access?
Subscribe today to unlock all pages.
Trusted by 1+ million students worldwide
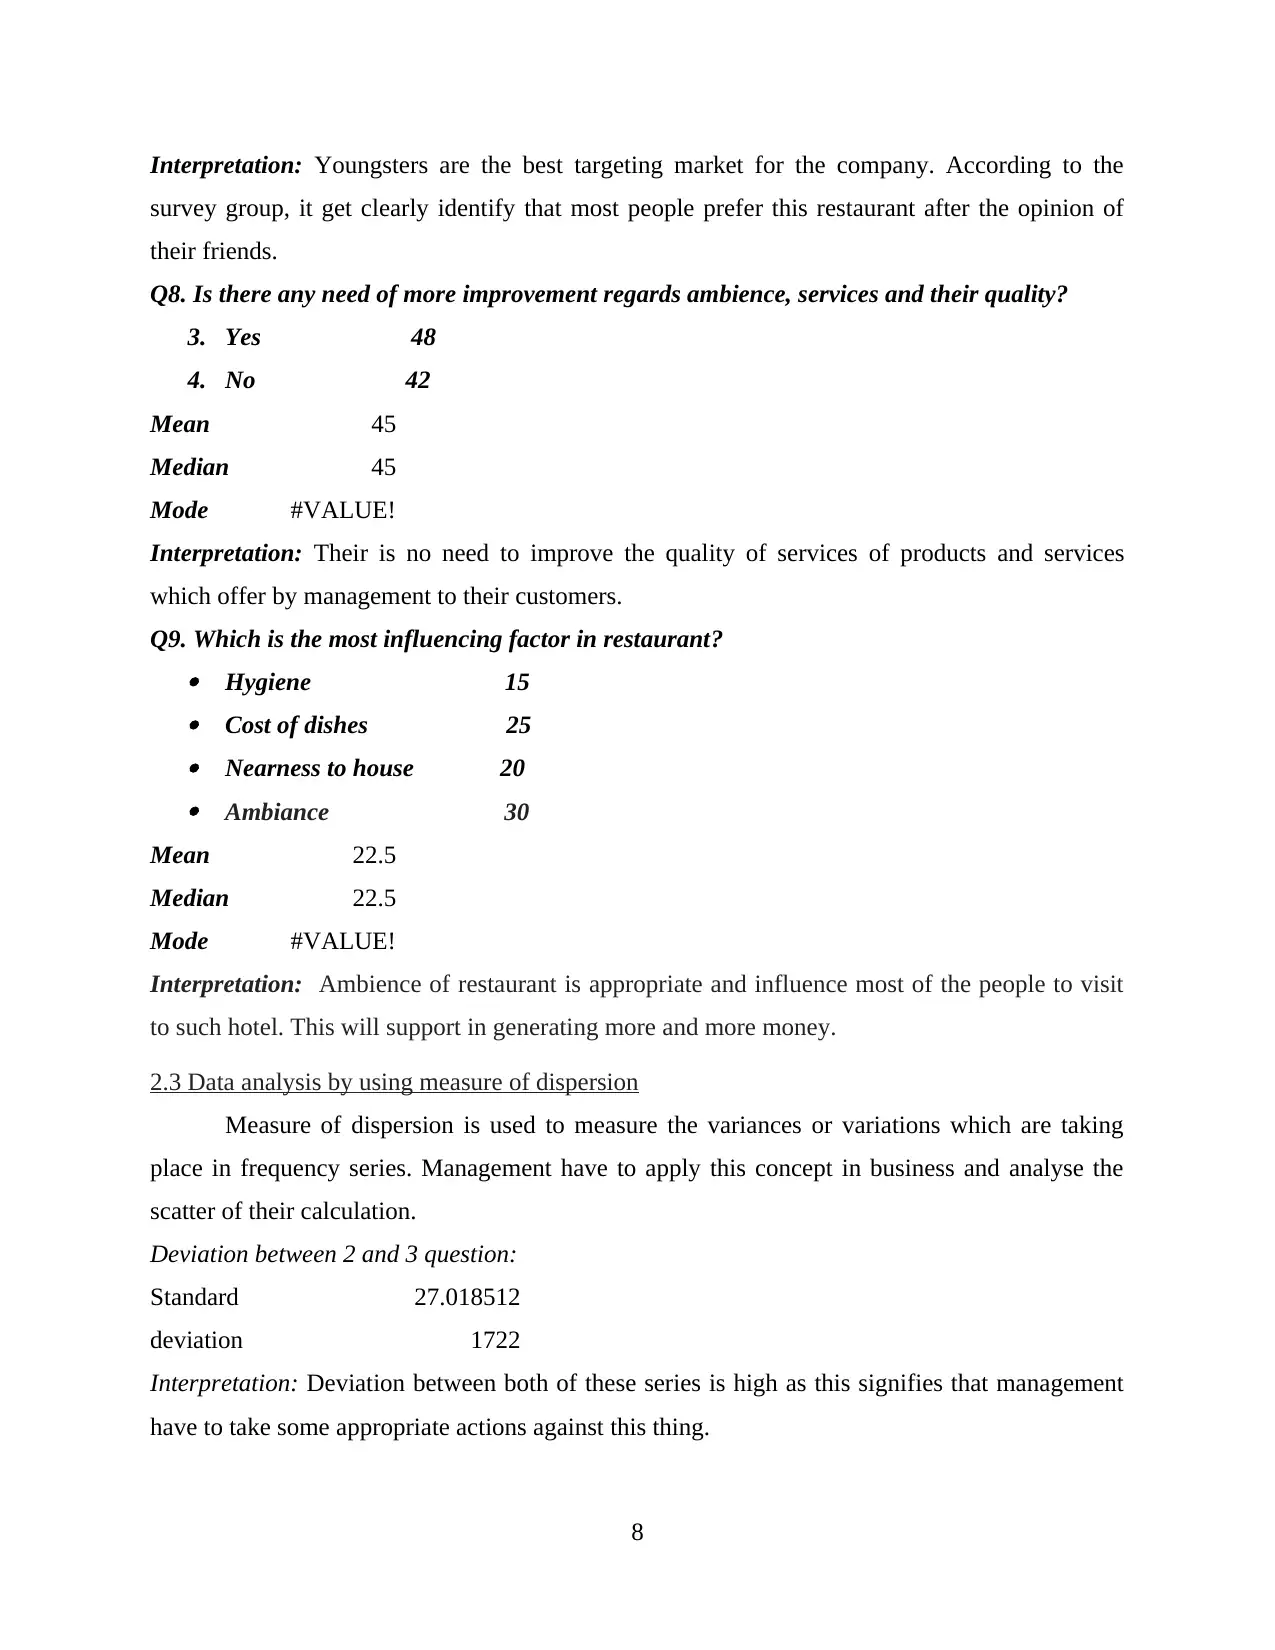
Interpretation: Youngsters are the best targeting market for the company. According to the
survey group, it get clearly identify that most people prefer this restaurant after the opinion of
their friends.
Q8. Is there any need of more improvement regards ambience, services and their quality?
3. Yes 48
4. No 42
Mean 45
Median 45
Mode #VALUE!
Interpretation: Their is no need to improve the quality of services of products and services
which offer by management to their customers.
Q9. Which is the most influencing factor in restaurant? Hygiene 15 Cost of dishes 25 Nearness to house 20 Ambiance 30
Mean 22.5
Median 22.5
Mode #VALUE!
Interpretation: Ambience of restaurant is appropriate and influence most of the people to visit
to such hotel. This will support in generating more and more money.
2.3 Data analysis by using measure of dispersion
Measure of dispersion is used to measure the variances or variations which are taking
place in frequency series. Management have to apply this concept in business and analyse the
scatter of their calculation.
Deviation between 2 and 3 question:
Standard
deviation
27.018512
1722
Interpretation: Deviation between both of these series is high as this signifies that management
have to take some appropriate actions against this thing.
8
Paraphrase This Document
Need a fresh take? Get an instant paraphrase of this document with our AI Paraphraser
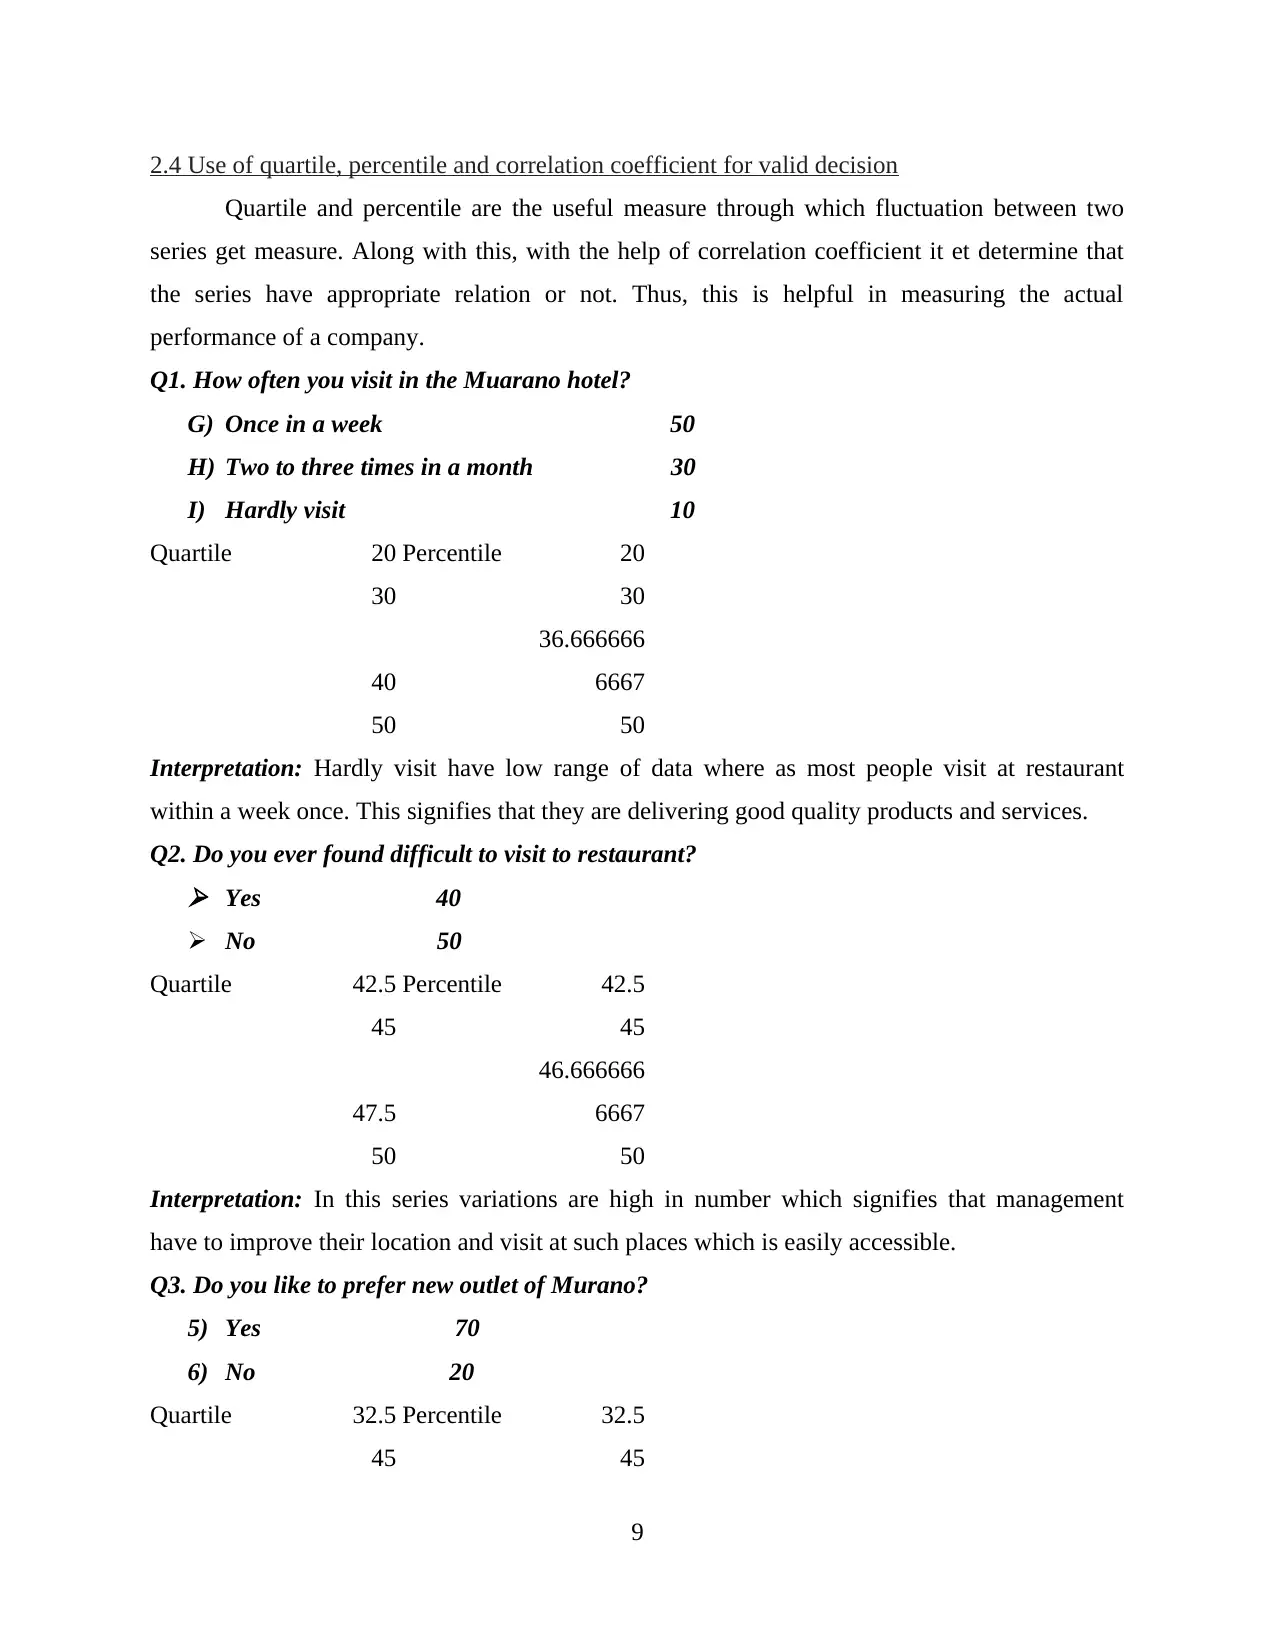
2.4 Use of quartile, percentile and correlation coefficient for valid decision
Quartile and percentile are the useful measure through which fluctuation between two
series get measure. Along with this, with the help of correlation coefficient it et determine that
the series have appropriate relation or not. Thus, this is helpful in measuring the actual
performance of a company.
Q1. How often you visit in the Muarano hotel?
G) Once in a week 50
H) Two to three times in a month 30
I) Hardly visit 10
Quartile 20 Percentile 20
30 30
40
36.666666
6667
50 50
Interpretation: Hardly visit have low range of data where as most people visit at restaurant
within a week once. This signifies that they are delivering good quality products and services.
Q2. Do you ever found difficult to visit to restaurant? Yes 40
No 50
Quartile 42.5 Percentile 42.5
45 45
47.5
46.666666
6667
50 50
Interpretation: In this series variations are high in number which signifies that management
have to improve their location and visit at such places which is easily accessible.
Q3. Do you like to prefer new outlet of Murano?
5) Yes 70
6) No 20
Quartile 32.5 Percentile 32.5
45 45
9
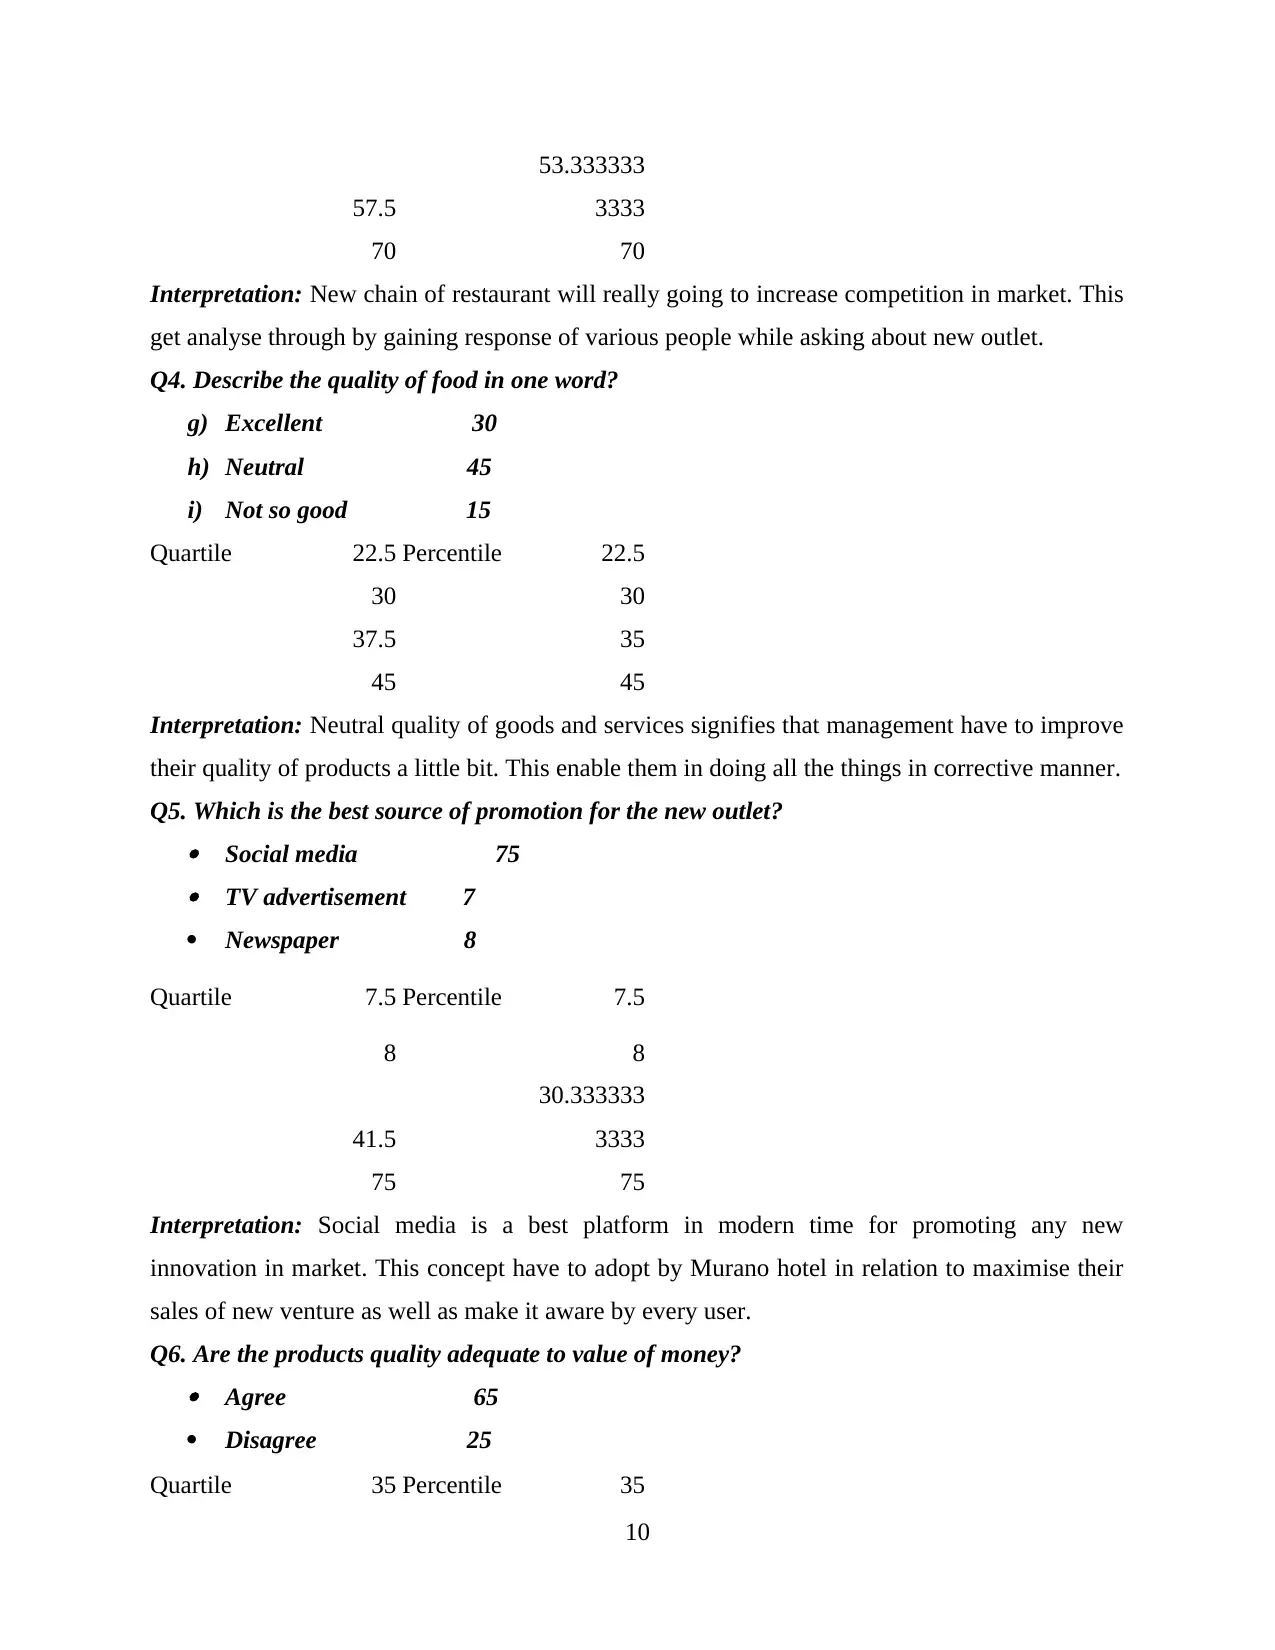
57.5
53.333333
3333
70 70
Interpretation: New chain of restaurant will really going to increase competition in market. This
get analyse through by gaining response of various people while asking about new outlet.
Q4. Describe the quality of food in one word?
g) Excellent 30
h) Neutral 45
i) Not so good 15
Quartile 22.5 Percentile 22.5
30 30
37.5 35
45 45
Interpretation: Neutral quality of goods and services signifies that management have to improve
their quality of products a little bit. This enable them in doing all the things in corrective manner.
Q5. Which is the best source of promotion for the new outlet? Social media 75 TV advertisement 7
Newspaper 8
Quartile 7.5 Percentile 7.5
8 8
41.5
30.333333
3333
75 75
Interpretation: Social media is a best platform in modern time for promoting any new
innovation in market. This concept have to adopt by Murano hotel in relation to maximise their
sales of new venture as well as make it aware by every user.
Q6. Are the products quality adequate to value of money? Agree 65
Disagree 25
Quartile 35 Percentile 35
10
⊘ This is a preview!⊘
Do you want full access?
Subscribe today to unlock all pages.
Trusted by 1+ million students worldwide
1 out of 24
Related Documents


Your All-in-One AI-Powered Toolkit for Academic Success.
+13062052269
info@desklib.com
Available 24*7 on WhatsApp / Email
![[object Object]](/_next/static/media/star-bottom.7253800d.svg)
Unlock your academic potential
Copyright © 2020–2026 A2Z Services. All Rights Reserved. Developed and managed by ZUCOL.