Business Decision Making Report: Murano Restaurant Expansion Analysis
VerifiedAdded on 2020/06/06
|29
|4899
|216
Report
AI Summary
This report delves into the business decision-making processes relevant to the expansion of the Murano restaurant. It begins by outlining data collection methods, including primary and secondary data sources, survey methodologies, and the design of a questionnaire used to gather insights into customer satisfaction and preferences. The report then progresses to data analysis, employing techniques such as mean, median, mode, standard deviation, quartiles, and correlation coefficients to derive meaningful conclusions from the collected data. Findings from the survey are presented, along with trend line forecasting to predict future performance. The report also includes a project plan, incorporating Gantt charts and network diagrams, and evaluates investment appraisal techniques like Net Present Value (NPV) and Internal Rate of Return (IRR) to assess the financial viability of the expansion. The report's findings and analysis provide a comprehensive overview of the key considerations for the expansion of the restaurant.

BUSINESS DECISION
MAKING
MAKING
Paraphrase This Document
Need a fresh take? Get an instant paraphrase of this document with our AI Paraphraser
TABLE OF CONTENTS
INTRODUCTION...........................................................................................................................1
TASK 1............................................................................................................................................1
1.1 Data collection methods........................................................................................................1
1.2 Survey methods and sampling framework............................................................................1
1.3 Questionnaire........................................................................................................................2
TASK 2............................................................................................................................................4
2.1 Data estimations....................................................................................................................4
2.2 Averages on collected data....................................................................................................6
2.3 Dispersion on collected data.................................................................................................8
2.4 Quartile and correlation coefficient......................................................................................9
TASK 3..........................................................................................................................................10
3.1 Findings on conducting survey...........................................................................................10
3.2 Trend line on forecasting for further years.........................................................................16
3.3 Presentation on findings......................................................................................................17
3.4 Business report....................................................................................................................17
TASK 4..........................................................................................................................................18
4.1 Information processing tools...............................................................................................18
4.2 Project plan..........................................................................................................................18
4.3 Investment appraisal techniques.........................................................................................21
CONCLUSION..............................................................................................................................23
REFERENCE.................................................................................................................................24
INDEX OF TABLES
Table 1: NPV ................................................................................................................................22
Table 2: IRR as investment plan...................................................................................................23
Table 1: NPV ................................................................................................................................22
Table 2: IRR as investment plan...................................................................................................23
⊘ This is a preview!⊘
Do you want full access?
Subscribe today to unlock all pages.
Trusted by 1+ million students worldwide
ILLUSTRATION INDEX
Illustration 1: Formula used for calculating mean ..........................................................................5
Illustration 2: Formula for calculating median for odd number respondents..................................5
Illustration 3: Standard deviation measurement..............................................................................8
Illustration 4: Age group of respondents.......................................................................................11
Illustration 5: Respondents' views on services of the restaurant...................................................12
Illustration 6: Frequency to visit Murano restaurant......................................................................13
Illustration 7: The most attractive tool of restaurant......................................................................14
Illustration 8: Respondents' ranking on services of restaurant......................................................15
Illustration 9: Service required to be improved.............................................................................16
Illustration 10: Trend line for forecasting on further operations...................................................17
Illustration 11: Project plan............................................................................................................19
Illustration 12: Gantt chart.............................................................................................................20
Illustration 13: Network diagram...................................................................................................20
Illustration 14: Project schedule.....................................................................................................21
Illustration 15: Formula for calculating NPV................................................................................22
Paraphrase This Document
Need a fresh take? Get an instant paraphrase of this document with our AI Paraphraser
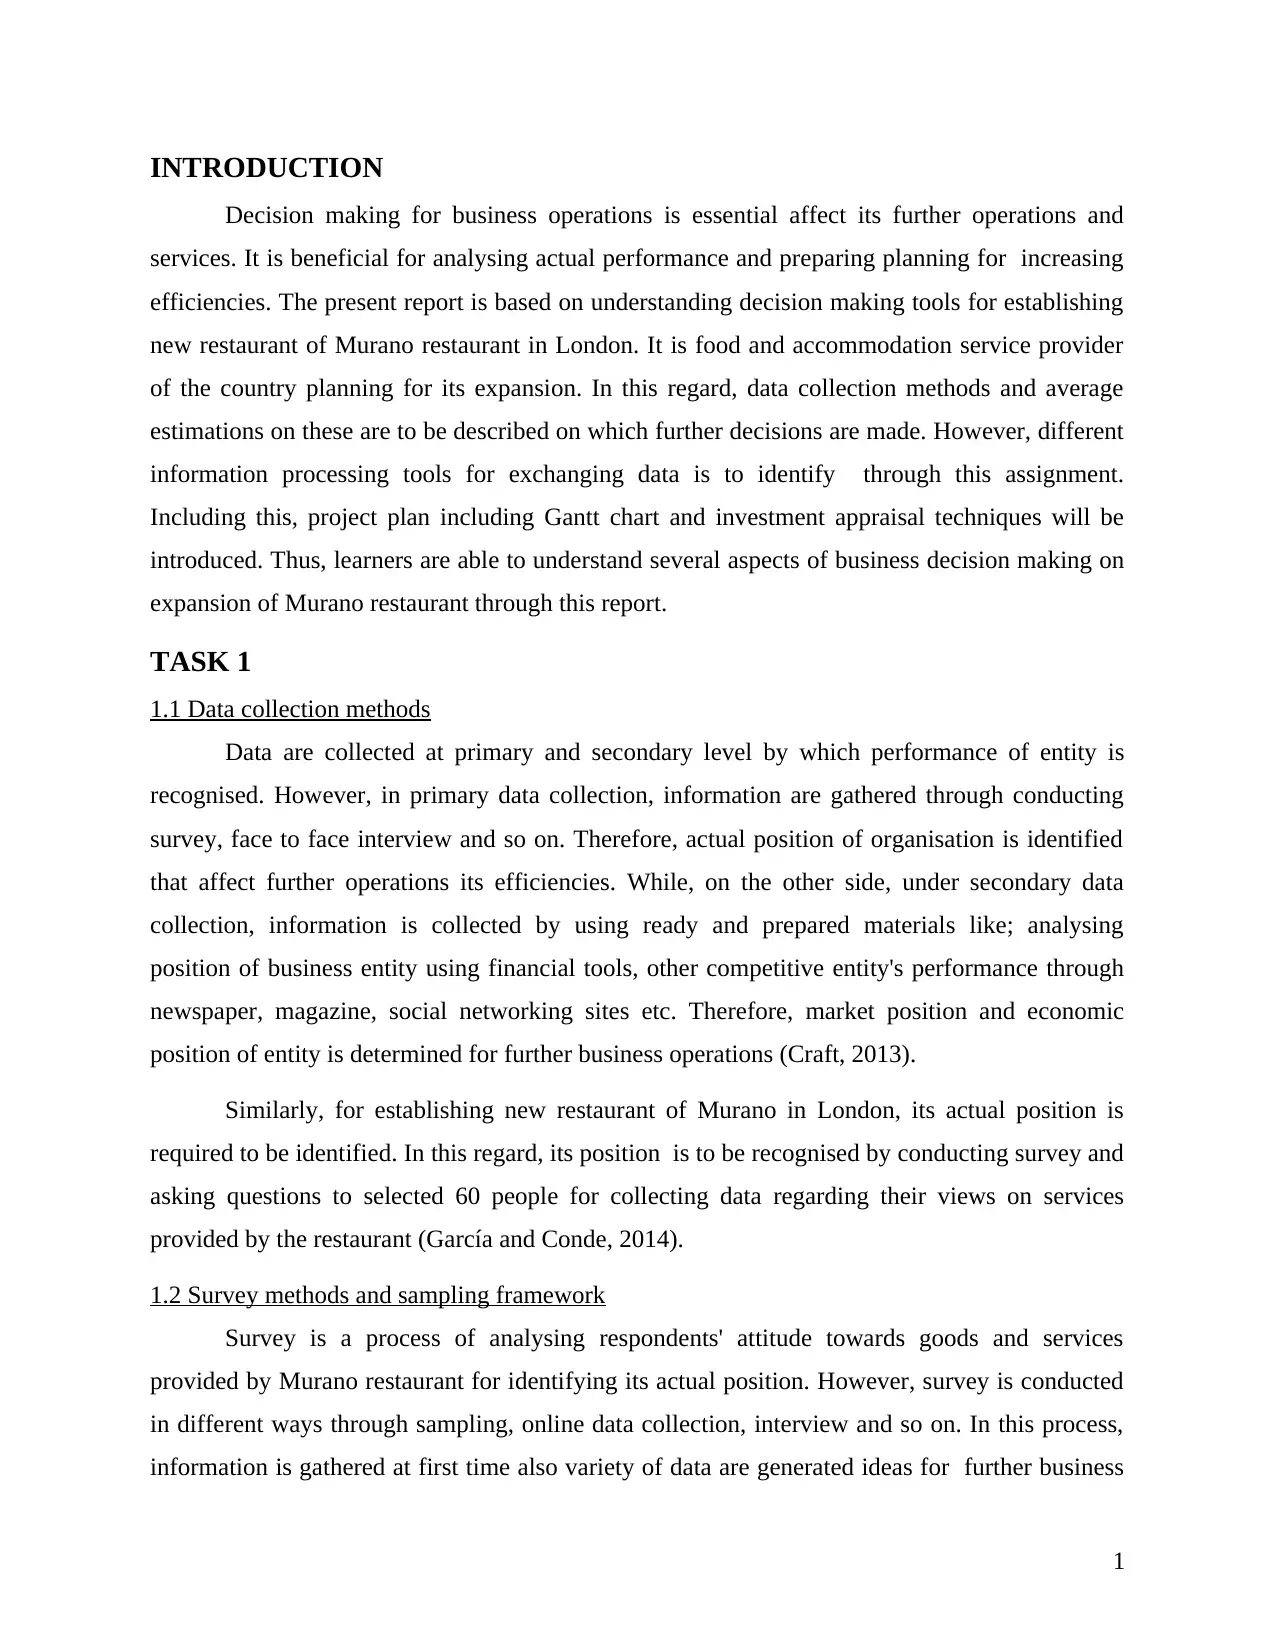
INTRODUCTION
Decision making for business operations is essential affect its further operations and
services. It is beneficial for analysing actual performance and preparing planning for increasing
efficiencies. The present report is based on understanding decision making tools for establishing
new restaurant of Murano restaurant in London. It is food and accommodation service provider
of the country planning for its expansion. In this regard, data collection methods and average
estimations on these are to be described on which further decisions are made. However, different
information processing tools for exchanging data is to identify through this assignment.
Including this, project plan including Gantt chart and investment appraisal techniques will be
introduced. Thus, learners are able to understand several aspects of business decision making on
expansion of Murano restaurant through this report.
TASK 1
1.1 Data collection methods
Data are collected at primary and secondary level by which performance of entity is
recognised. However, in primary data collection, information are gathered through conducting
survey, face to face interview and so on. Therefore, actual position of organisation is identified
that affect further operations its efficiencies. While, on the other side, under secondary data
collection, information is collected by using ready and prepared materials like; analysing
position of business entity using financial tools, other competitive entity's performance through
newspaper, magazine, social networking sites etc. Therefore, market position and economic
position of entity is determined for further business operations (Craft, 2013).
Similarly, for establishing new restaurant of Murano in London, its actual position is
required to be identified. In this regard, its position is to be recognised by conducting survey and
asking questions to selected 60 people for collecting data regarding their views on services
provided by the restaurant (García and Conde, 2014).
1.2 Survey methods and sampling framework
Survey is a process of analysing respondents' attitude towards goods and services
provided by Murano restaurant for identifying its actual position. However, survey is conducted
in different ways through sampling, online data collection, interview and so on. In this process,
information is gathered at first time also variety of data are generated ideas for further business
1
operations (Ginevičius and Podviezko, 2013). For conducting survey, researcher is to select 60
people randomly for identifying their views on food and accommodation services of Murano
restaurant.
Sampling: Survey is done through sampling people out of population systematically or
randomly. However, respondents are selected systematically as selecting each one or alternate
one. While, on the other side, under random sampling method, respondents are selected
randomly as no fix system is recognised for sampling and conducting survey. Likewise, cluster
sampling is a process for selecting respondents and asking questions in a cluster or group. In this
regard, for analysing respondents' views on services of Murano restaurant, 60 respondents are
selected randomly and for conducting survey (Gu and et.al., 2013). Therefore, different ideas are
also generated for further business operations and its expansion efficiently.
1.3 Questionnaire
It consists of questions regarding satisfaction level and different views of respondents on
services of Murano restaurant (Hill and et.al., 2013). However, questions asked by researcher to
selected respondents are mentioned below:
Name:
Age:
Gender:
Q.1 From which of the age group you are belonged to?
14-20
21-25
26-35
36-50
Above 50
Q.2 Comment on services provided by Murano restaurant.
Effective
Satisfied
Neutral
2
⊘ This is a preview!⊘
Do you want full access?
Subscribe today to unlock all pages.
Trusted by 1+ million students worldwide
Unsatisfied
Q.3 How frequently you visit the restaurant?
Weekly
Monthly
Between 2-3 month
Twice in a year
Yearly
Rare
Q.4 From which of the following service of organisation attracted you the most?
Delicious and variety in food
Accommodation
Dealing with customers
Environment
Q.5 Do you recommend you friends and family for its services?
Yes
No
Q.6 How is cost charges on services of Murano restaurant?
High cost on services
Economic
Q.7 Comment on quality services of restaurant.
Impressive
Effective
Neutral
Poor
3
Paraphrase This Document
Need a fresh take? Get an instant paraphrase of this document with our AI Paraphraser
Q.8 Overall, rank on services of Murano restaurant.
1st order
2nd order
3rd order
Q.9 On which of the following factor, Murano should consider for better services in the future
time?
Food services
Accommodation
Environment
Customer dealing
Suggest your recommendations for the entity..............
TASK 2
2.1 Data estimations
Estimation on collected data is done through evaluating mean, median and mode on
which further decisions are made regarding business operations. However, all the tools for data
estimation can be described as:
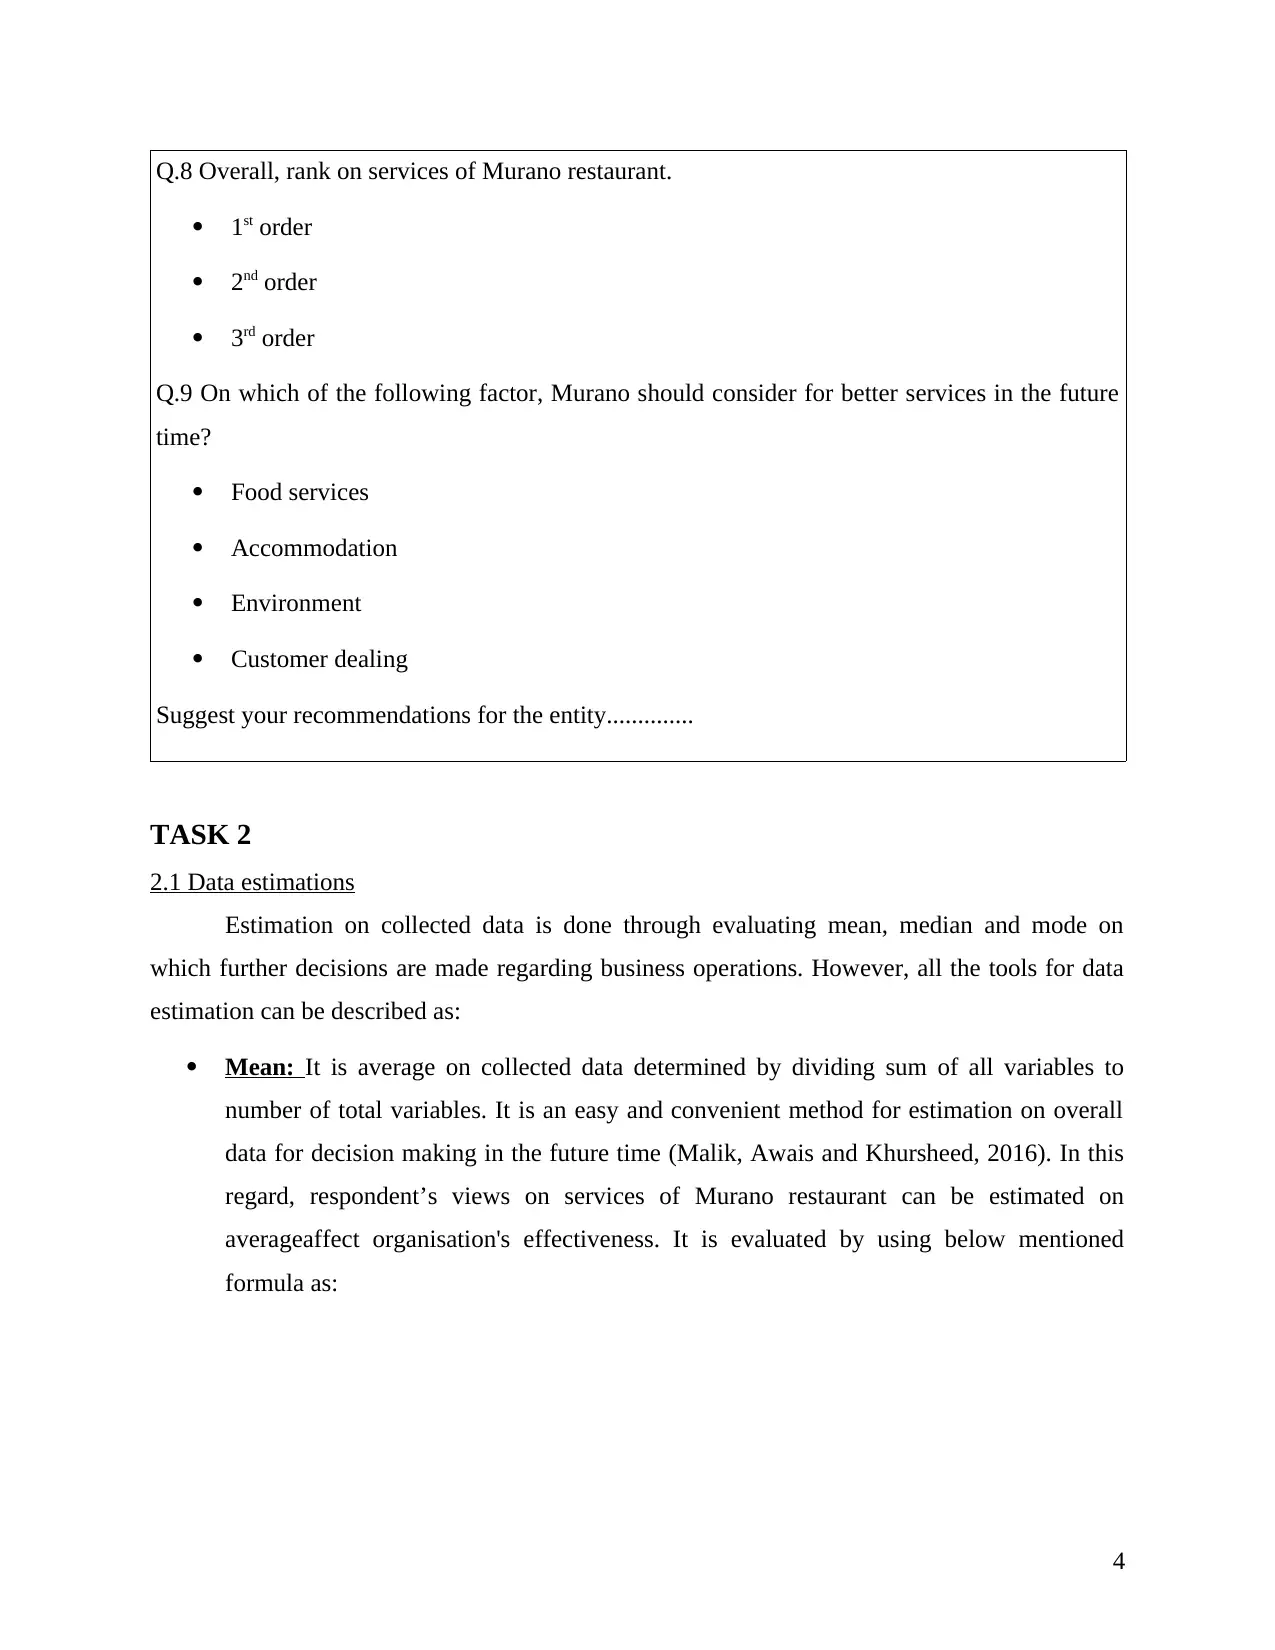
Mean: It is average on collected data determined by dividing sum of all variables to
number of total variables. It is an easy and convenient method for estimation on overall
data for decision making in the future time (Malik, Awais and Khursheed, 2016). In this
regard, respondent’s views on services of Murano restaurant can be estimated on
averageaffect organisation's effectiveness. It is evaluated by using below mentioned
formula as:
4
1st order
2nd order
3rd order
Q.9 On which of the following factor, Murano should consider for better services in the future
time?
Food services
Accommodation
Environment
Customer dealing
Suggest your recommendations for the entity..............
TASK 2
2.1 Data estimations
Estimation on collected data is done through evaluating mean, median and mode on
which further decisions are made regarding business operations. However, all the tools for data
estimation can be described as:
Mean: It is average on collected data determined by dividing sum of all variables to
number of total variables. It is an easy and convenient method for estimation on overall
data for decision making in the future time (Malik, Awais and Khursheed, 2016). In this
regard, respondent’s views on services of Murano restaurant can be estimated on
averageaffect organisation's effectiveness. It is evaluated by using below mentioned
formula as:
4
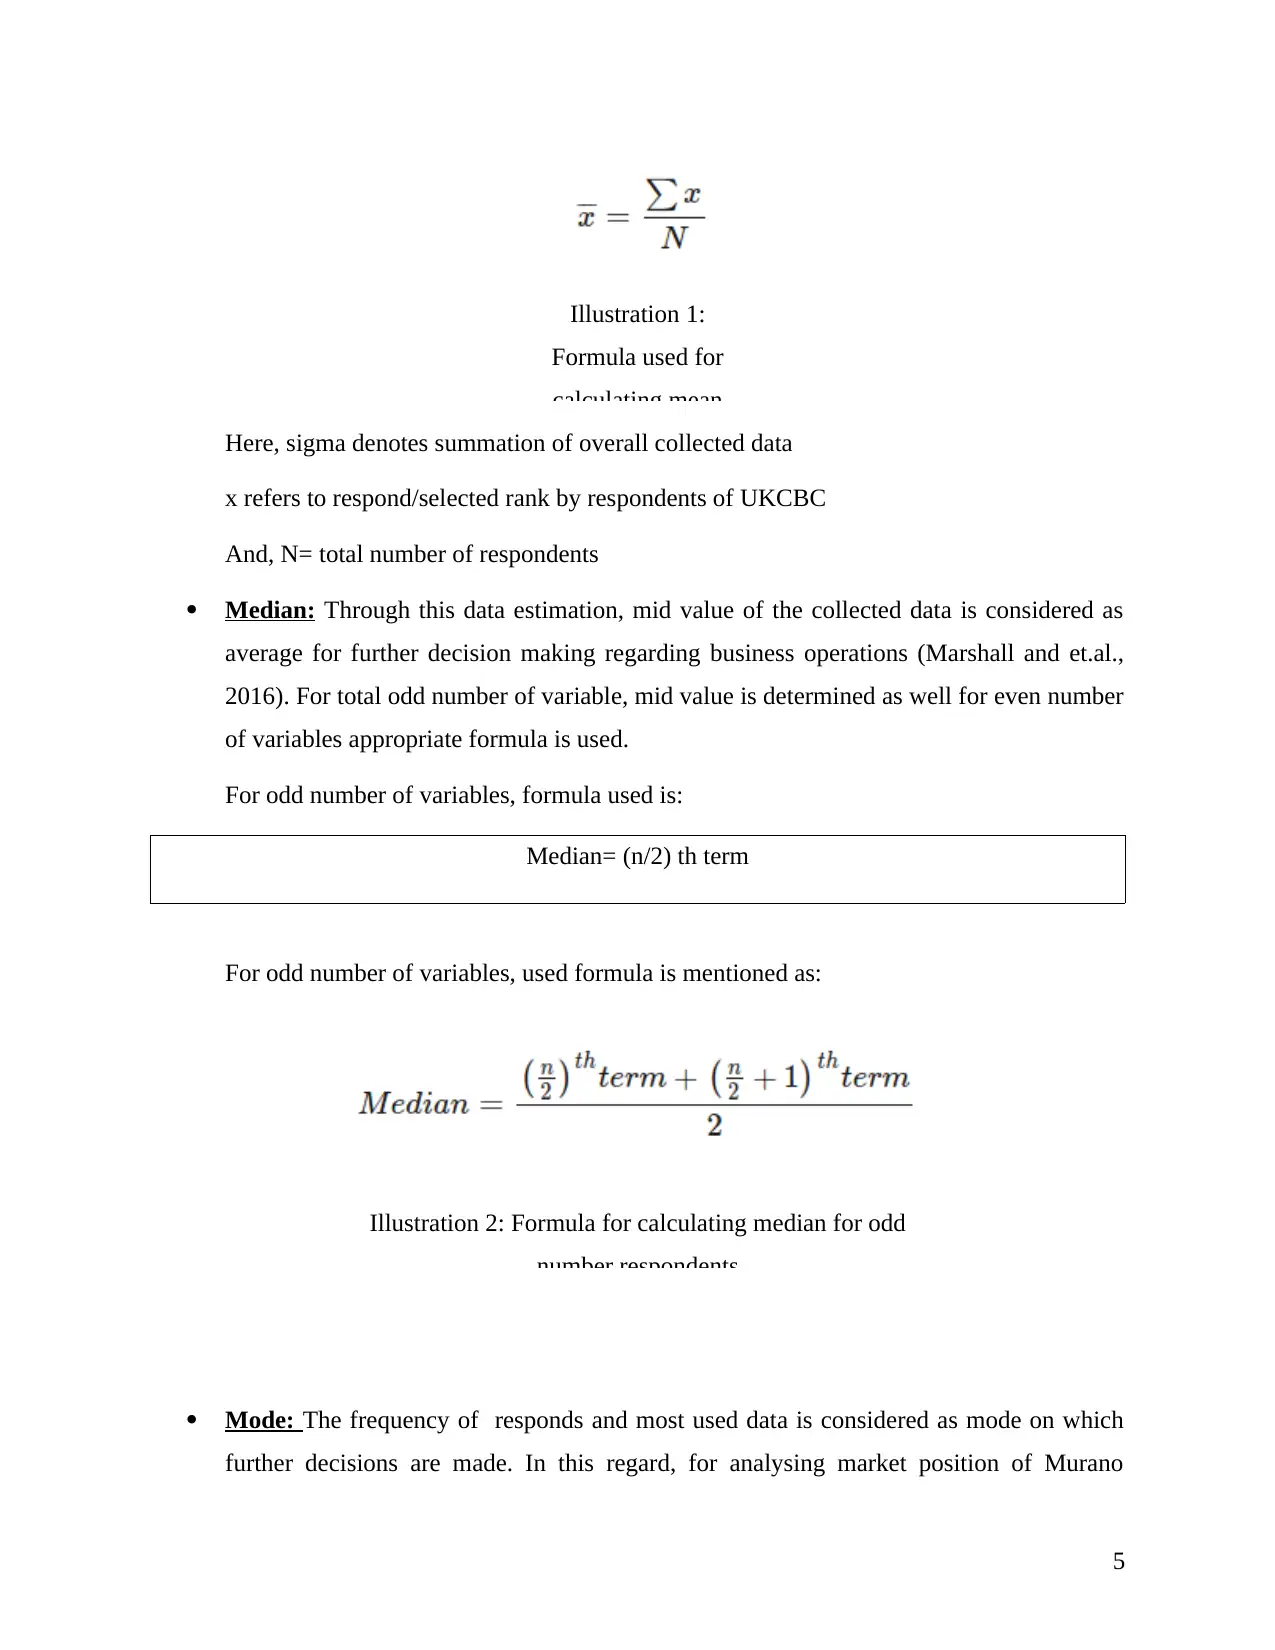
Illustration 1:
Formula used for
calculating mean
Here, sigma denotes summation of overall collected data
x refers to respond/selected rank by respondents of UKCBC
And, N= total number of respondents
Median: Through this data estimation, mid value of the collected data is considered as
average for further decision making regarding business operations (Marshall and et.al.,
2016). For total odd number of variable, mid value is determined as well for even number
of variables appropriate formula is used.
For odd number of variables, formula used is:
Median= (n/2) th term
For odd number of variables, used formula is mentioned as:
Illustration 2: Formula for calculating median for odd
number respondents
Mode: The frequency of responds and most used data is considered as mode on which
further decisions are made. In this regard, for analysing market position of Murano
5
⊘ This is a preview!⊘
Do you want full access?
Subscribe today to unlock all pages.
Trusted by 1+ million students worldwide
restaurant, frequent responds on satisfaction level of respondents is estimated for further
implementation. Similarly, proper ideas are generated regarding expansion of entity and
increasing its quality services for further years (Moonen and et.al., 2013). Therefore,
using this data estimation tool affect further services and increasing its effectiveness.
2.2 Averages on collected data
Average on data collections as respondents' views in respect of different services of
Murano restaurant is evaluated (Noguera and Pert, 2015). However, on different tools, they rank
differently shows market position of the entity can be understood as follows:
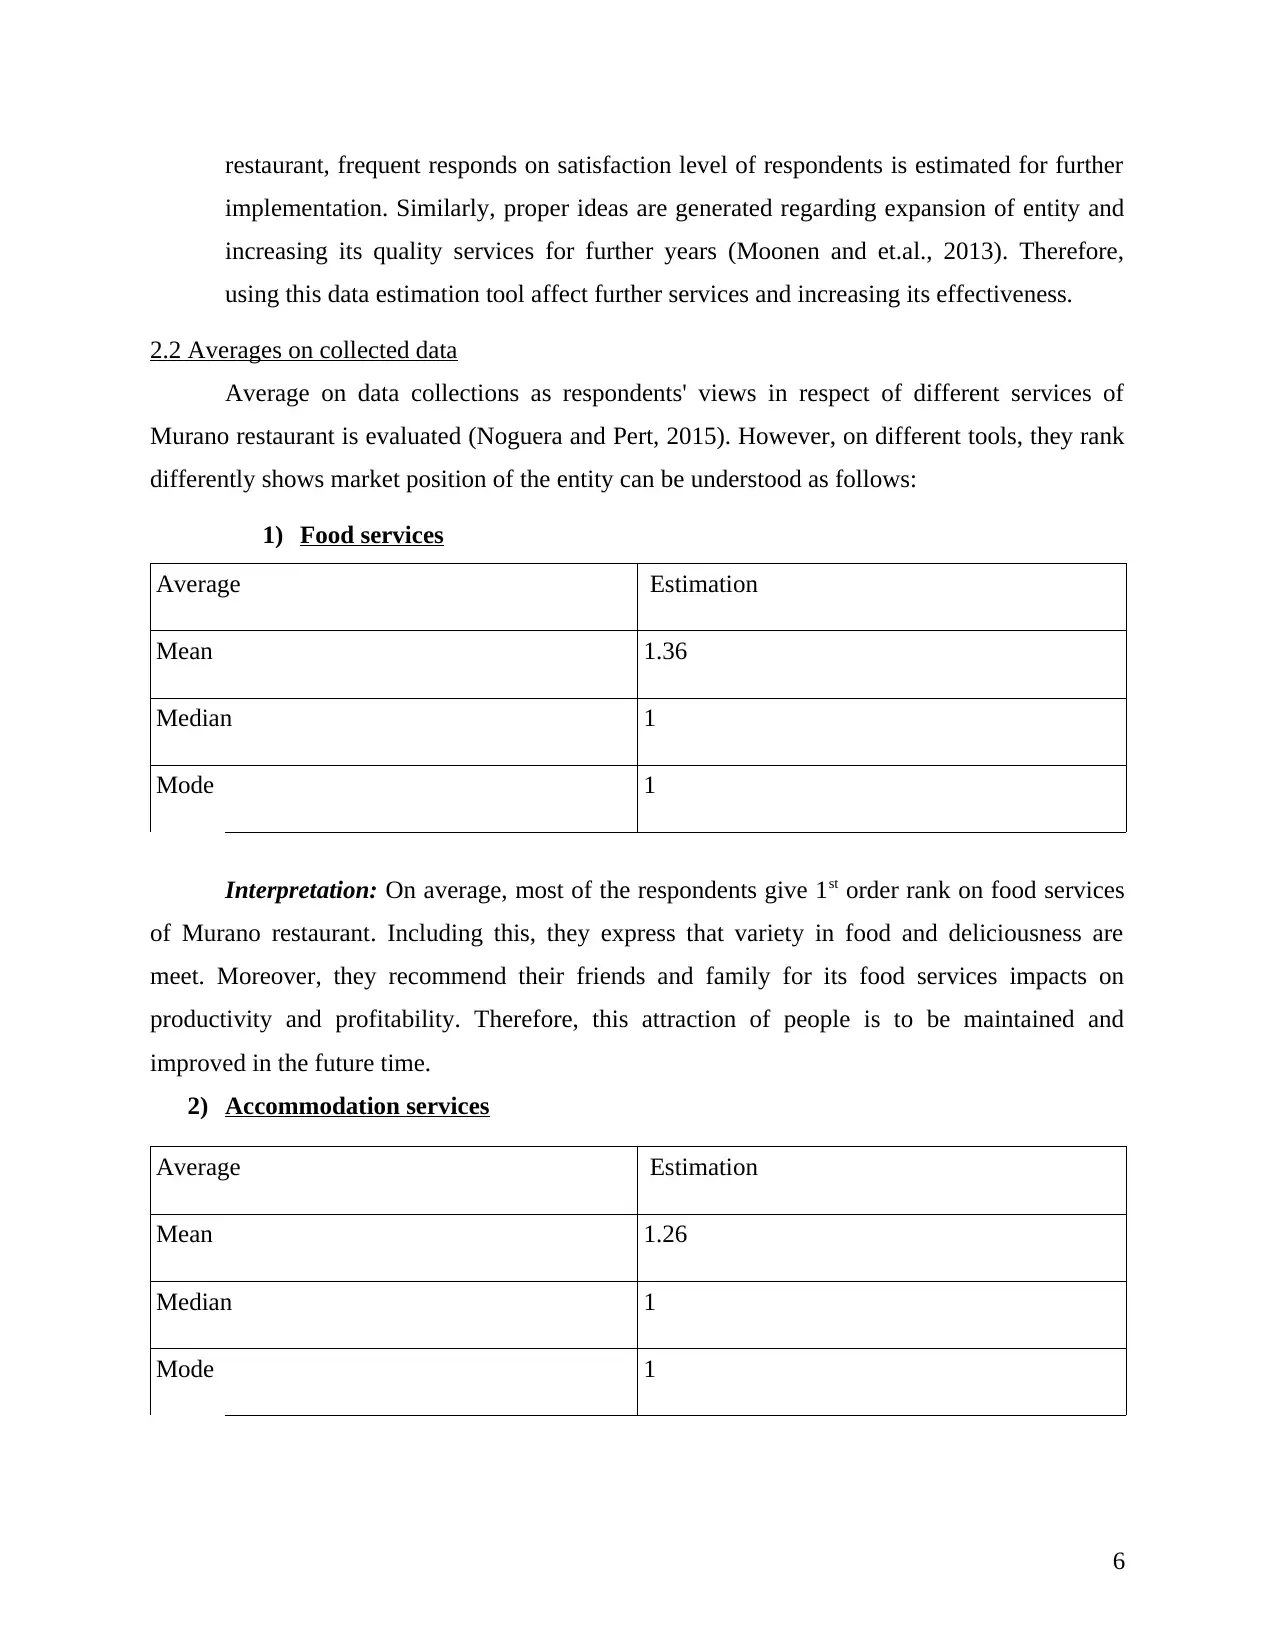
1) Food services
Average Estimation
Mean 1.36
Median 1
Mode 1
Interpretation: On average, most of the respondents give 1st order rank on food services
of Murano restaurant. Including this, they express that variety in food and deliciousness are
meet. Moreover, they recommend their friends and family for its food services impacts on
productivity and profitability. Therefore, this attraction of people is to be maintained and
improved in the future time.
2) Accommodation services
Average Estimation
Mean 1.26
Median 1
Mode 1
6
implementation. Similarly, proper ideas are generated regarding expansion of entity and
increasing its quality services for further years (Moonen and et.al., 2013). Therefore,
using this data estimation tool affect further services and increasing its effectiveness.
2.2 Averages on collected data
Average on data collections as respondents' views in respect of different services of
Murano restaurant is evaluated (Noguera and Pert, 2015). However, on different tools, they rank
differently shows market position of the entity can be understood as follows:
1) Food services
Average Estimation
Mean 1.36
Median 1
Mode 1
Interpretation: On average, most of the respondents give 1st order rank on food services
of Murano restaurant. Including this, they express that variety in food and deliciousness are
meet. Moreover, they recommend their friends and family for its food services impacts on
productivity and profitability. Therefore, this attraction of people is to be maintained and
improved in the future time.
2) Accommodation services
Average Estimation
Mean 1.26
Median 1
Mode 1
6
Paraphrase This Document
Need a fresh take? Get an instant paraphrase of this document with our AI Paraphraser
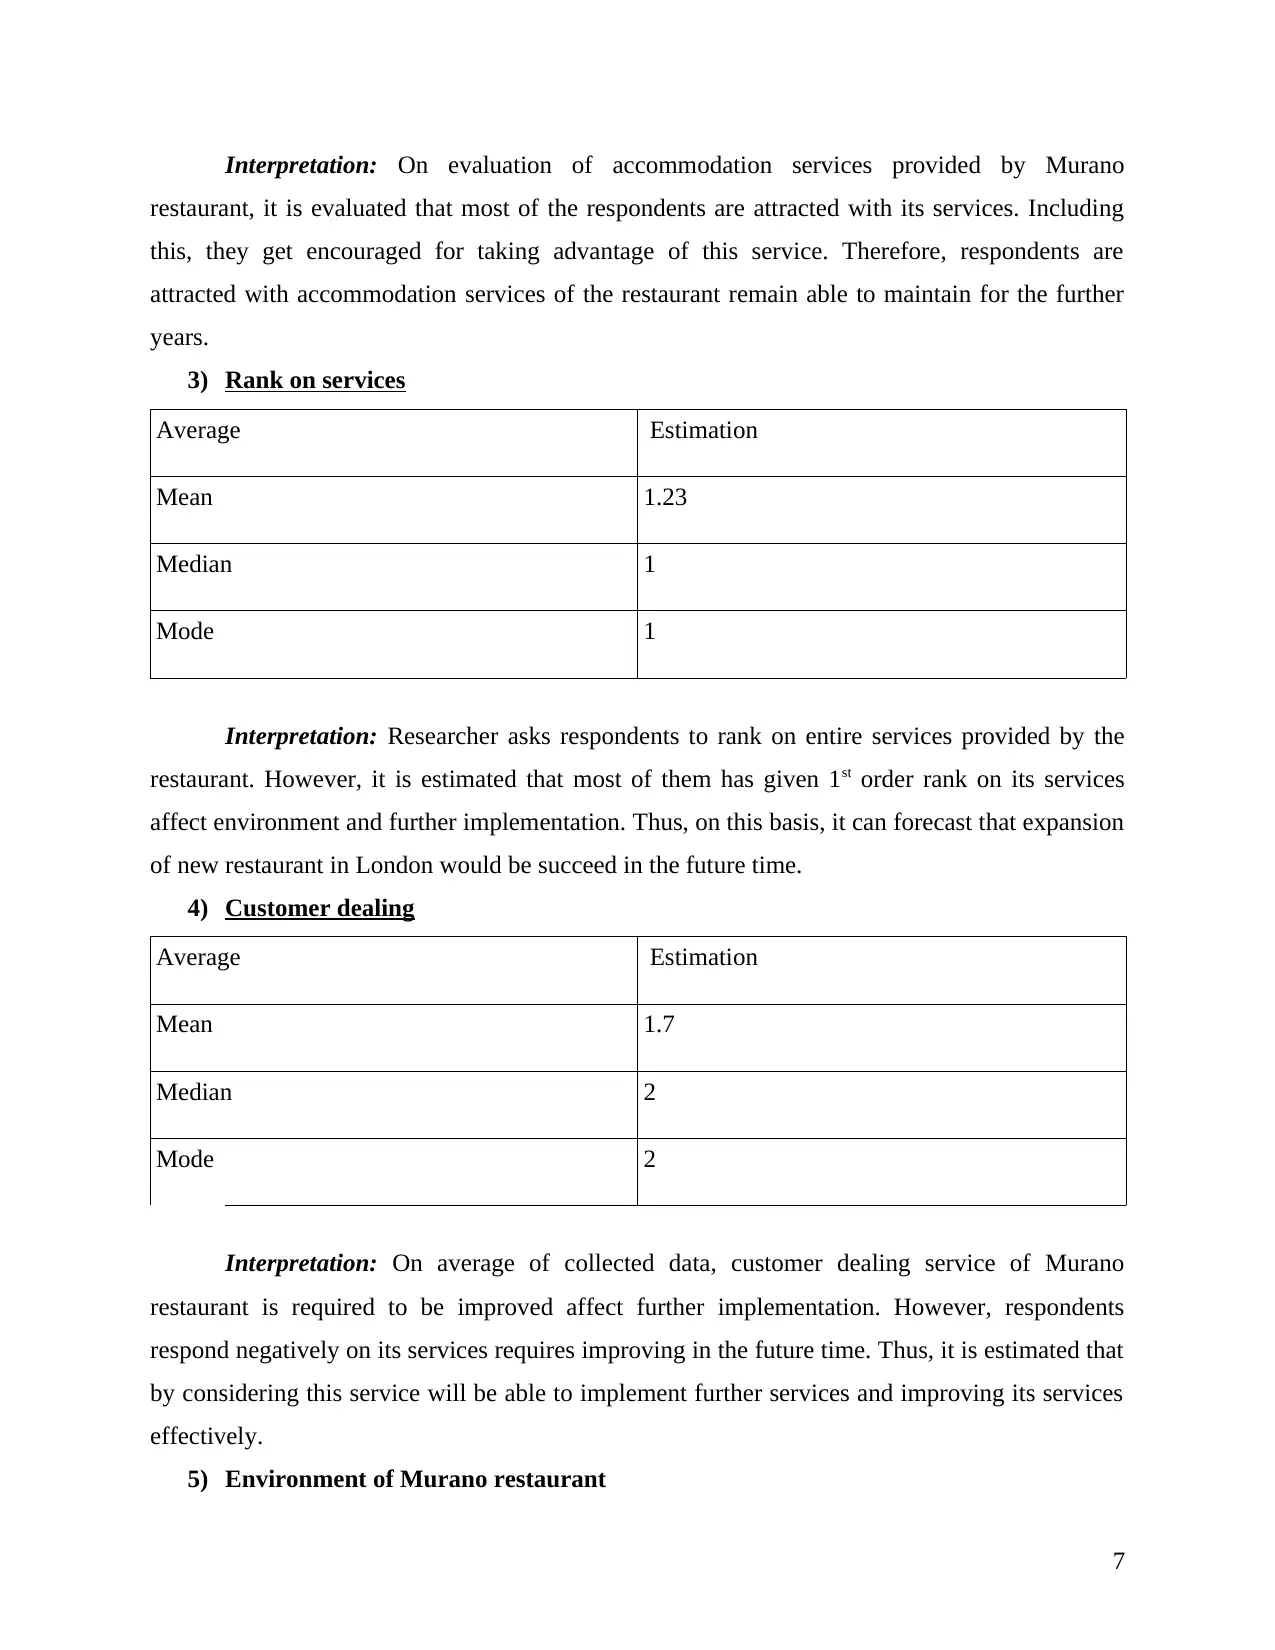
Interpretation: On evaluation of accommodation services provided by Murano
restaurant, it is evaluated that most of the respondents are attracted with its services. Including
this, they get encouraged for taking advantage of this service. Therefore, respondents are
attracted with accommodation services of the restaurant remain able to maintain for the further
years.
3) Rank on services
Average Estimation
Mean 1.23
Median 1
Mode 1
Interpretation: Researcher asks respondents to rank on entire services provided by the
restaurant. However, it is estimated that most of them has given 1st order rank on its services
affect environment and further implementation. Thus, on this basis, it can forecast that expansion
of new restaurant in London would be succeed in the future time.
4) Customer dealing
Average Estimation
Mean 1.7
Median 2
Mode 2
Interpretation: On average of collected data, customer dealing service of Murano
restaurant is required to be improved affect further implementation. However, respondents
respond negatively on its services requires improving in the future time. Thus, it is estimated that
by considering this service will be able to implement further services and improving its services
effectively.
5) Environment of Murano restaurant
7
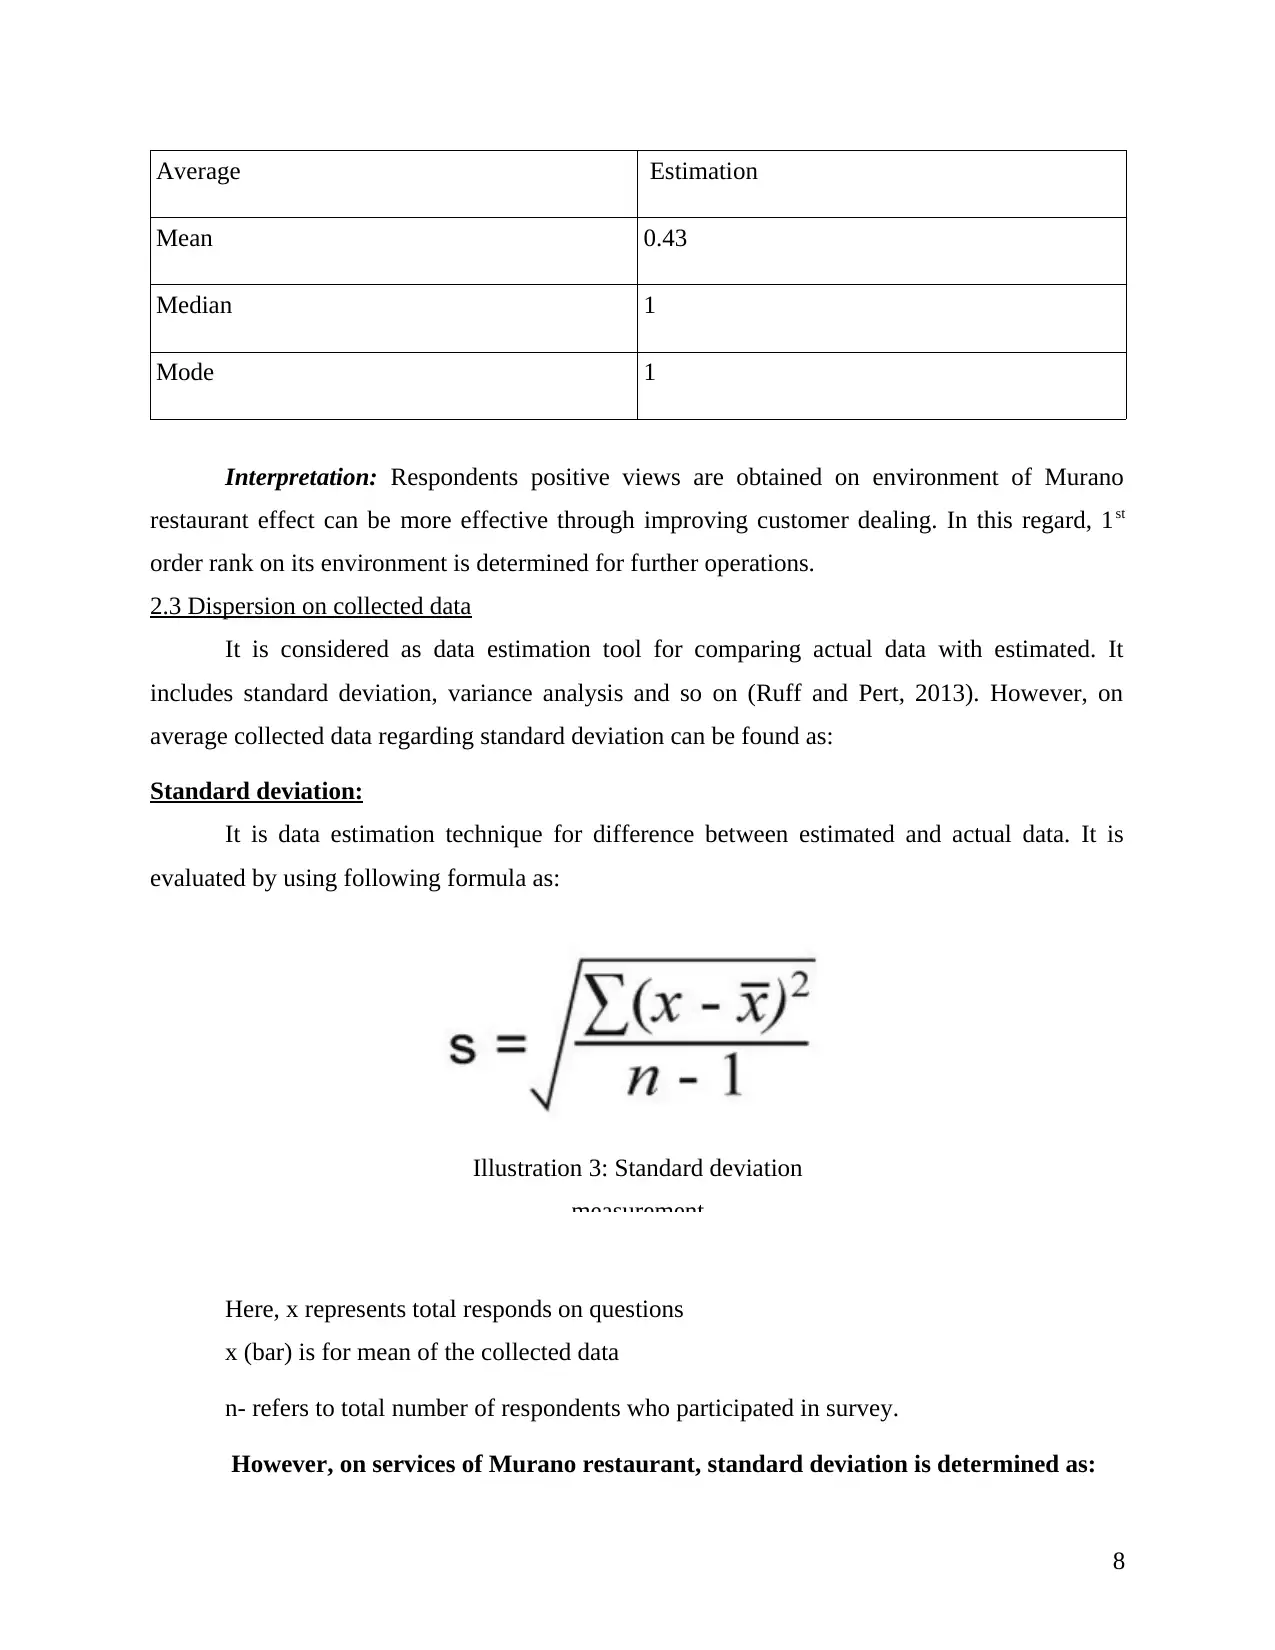
Average Estimation
Mean 0.43
Median 1
Mode 1
Interpretation: Respondents positive views are obtained on environment of Murano
restaurant effect can be more effective through improving customer dealing. In this regard, 1st
order rank on its environment is determined for further operations.
2.3 Dispersion on collected data
It is considered as data estimation tool for comparing actual data with estimated. It
includes standard deviation, variance analysis and so on (Ruff and Pert, 2013). However, on
average collected data regarding standard deviation can be found as:
Standard deviation:
It is data estimation technique for difference between estimated and actual data. It is
evaluated by using following formula as:
Illustration 3: Standard deviation
measurement
Here, x represents total responds on questions
x (bar) is for mean of the collected data
n- refers to total number of respondents who participated in survey.
However, on services of Murano restaurant, standard deviation is determined as:
8
⊘ This is a preview!⊘
Do you want full access?
Subscribe today to unlock all pages.
Trusted by 1+ million students worldwide
1 out of 29
Related Documents


Your All-in-One AI-Powered Toolkit for Academic Success.
+13062052269
info@desklib.com
Available 24*7 on WhatsApp / Email
![[object Object]](/_next/static/media/star-bottom.7253800d.svg)
Unlock your academic potential
Copyright © 2020–2026 A2Z Services. All Rights Reserved. Developed and managed by ZUCOL.