Business Decision Making Project: Analysis of Murano Restaurant UK
VerifiedAdded on 2020/02/12
|27
|5399
|109
Project
AI Summary
This project report analyzes business decision-making for the Murano restaurant in the UK. It begins with an introduction to business decision-making and its importance, followed by a detailed plan for collecting primary and secondary data, including surveys and questionnaires. The report summarizes collected data using measures of central tendency (mean, median, mode) and dispersion (standard deviation, range), providing interpretations of these measures in the context of the restaurant's sales and profit. It incorporates graphs, charts, and trend lines to forecast business information and presents this information effectively in a business report. Furthermore, the project utilizes information processing tools like Gantt charts and critical path analysis for project management, along with financial tools such as Net Present Value (NPV) and Internal Rate of Return (IRR) for investment appraisal. The report concludes with a summary of findings and recommendations, supported by references and an index of tables and illustrations.

BUSINESS DECISION
MAKING
MAKING
Paraphrase This Document
Need a fresh take? Get an instant paraphrase of this document with our AI Paraphraser
TABLE OF CONTENTS
INTRODUCTION...........................................................................................................................1
TASK 1............................................................................................................................................1
1.1 Plan for primary and secondary data for the business problem............................................1
1.2 Methodology of surveys and their frame for sampling.........................................................2
1.3 Questionnaires.......................................................................................................................3
2.1 Summarise the data collected through methodology............................................................5
2.2 Interpretation of measure of central tendency.......................................................................5
2.3 Measures of dispersion..........................................................................................................7
2.4 Quartiles and correlation coefficient for collected data........................................................8
TASK 2............................................................................................................................................9
3.1 Graph and charts...................................................................................................................9
3.2 Trend lines forecast the information about specific business.............................................13
3.3 Presentation of the information affectivity.........................................................................14
3.4 Business report ...................................................................................................................14
TASK 3..........................................................................................................................................16
4.1 Information processing tools...............................................................................................16
4.2 Gantt chart and critical path................................................................................................17
Gantt chart.................................................................................................................................17
Critical path...............................................................................................................................18
4.3 Financial tools NPV or IRR................................................................................................19
CONCLUSION..............................................................................................................................20
REFERENCE.................................................................................................................................21
INDEX OF TABLES
Table 1: Estimations on collected data............................................................................................5
Table 2: Standard deviation on collected data.................................................................................7
Table 3: Quartiles and correlation coefficient for collected data.....................................................9
Table 4: Activities of project plan.................................................................................................17
Table 5: NPV for investment plan.................................................................................................19
Table 6: IRR as investment appraisal tool.....................................................................................19
⊘ This is a preview!⊘
Do you want full access?
Subscribe today to unlock all pages.
Trusted by 1+ million students worldwide
ILLUSTRATION INDEX
Illustration 1: Formula used for calculating mean...........................................................................6
Illustration 2: Median for odd number of respondents....................................................................7
Illustration 3: Using formula to evaluate Standard deviation..........................................................8
Illustration 4: Critical path.............................................................................................................18
Illustration 5: Network diagram for project plan...........................................................................18
Paraphrase This Document
Need a fresh take? Get an instant paraphrase of this document with our AI Paraphraser
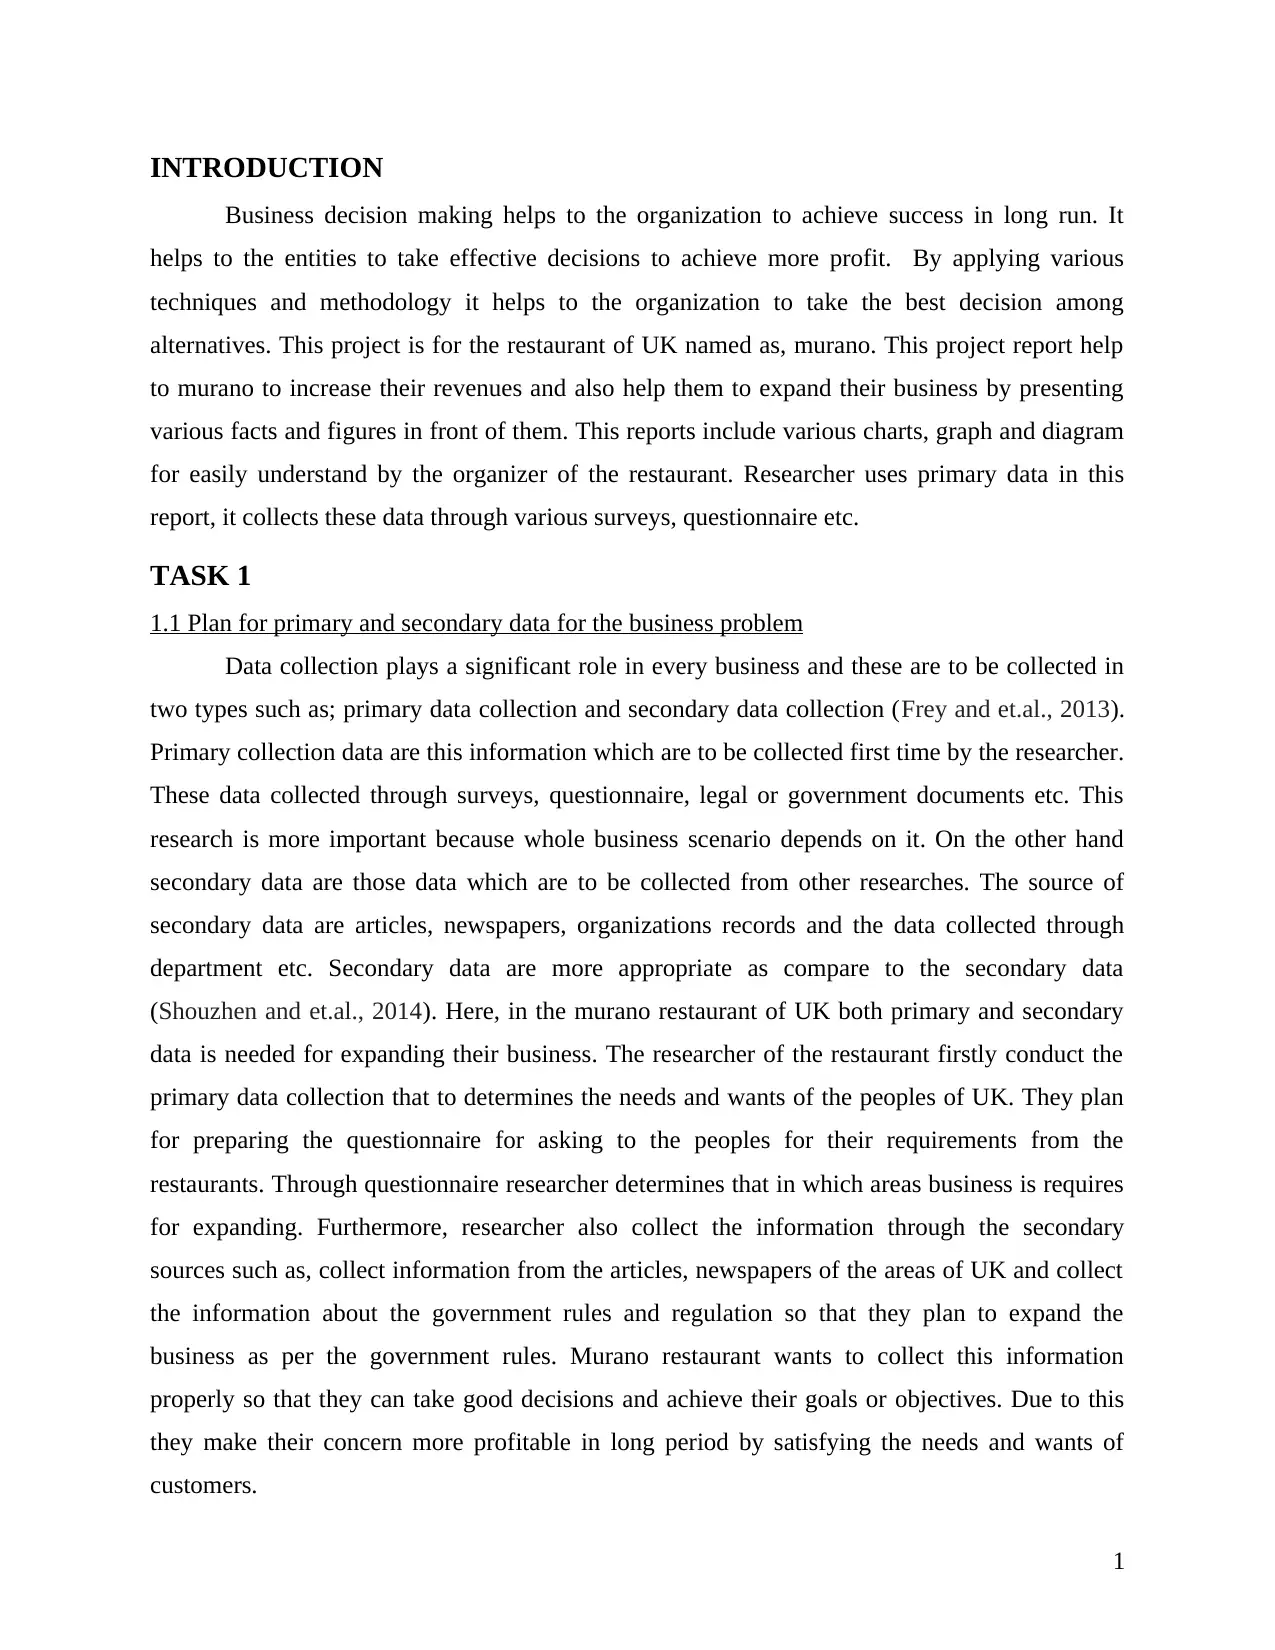
INTRODUCTION
Business decision making helps to the organization to achieve success in long run. It
helps to the entities to take effective decisions to achieve more profit. By applying various
techniques and methodology it helps to the organization to take the best decision among
alternatives. This project is for the restaurant of UK named as, murano. This project report help
to murano to increase their revenues and also help them to expand their business by presenting
various facts and figures in front of them. This reports include various charts, graph and diagram
for easily understand by the organizer of the restaurant. Researcher uses primary data in this
report, it collects these data through various surveys, questionnaire etc.
TASK 1
1.1 Plan for primary and secondary data for the business problem
Data collection plays a significant role in every business and these are to be collected in
two types such as; primary data collection and secondary data collection (Frey and et.al., 2013).
Primary collection data are this information which are to be collected first time by the researcher.
These data collected through surveys, questionnaire, legal or government documents etc. This
research is more important because whole business scenario depends on it. On the other hand
secondary data are those data which are to be collected from other researches. The source of
secondary data are articles, newspapers, organizations records and the data collected through
department etc. Secondary data are more appropriate as compare to the secondary data
(Shouzhen and et.al., 2014). Here, in the murano restaurant of UK both primary and secondary
data is needed for expanding their business. The researcher of the restaurant firstly conduct the
primary data collection that to determines the needs and wants of the peoples of UK. They plan
for preparing the questionnaire for asking to the peoples for their requirements from the
restaurants. Through questionnaire researcher determines that in which areas business is requires
for expanding. Furthermore, researcher also collect the information through the secondary
sources such as, collect information from the articles, newspapers of the areas of UK and collect
the information about the government rules and regulation so that they plan to expand the
business as per the government rules. Murano restaurant wants to collect this information
properly so that they can take good decisions and achieve their goals or objectives. Due to this
they make their concern more profitable in long period by satisfying the needs and wants of
customers.
1
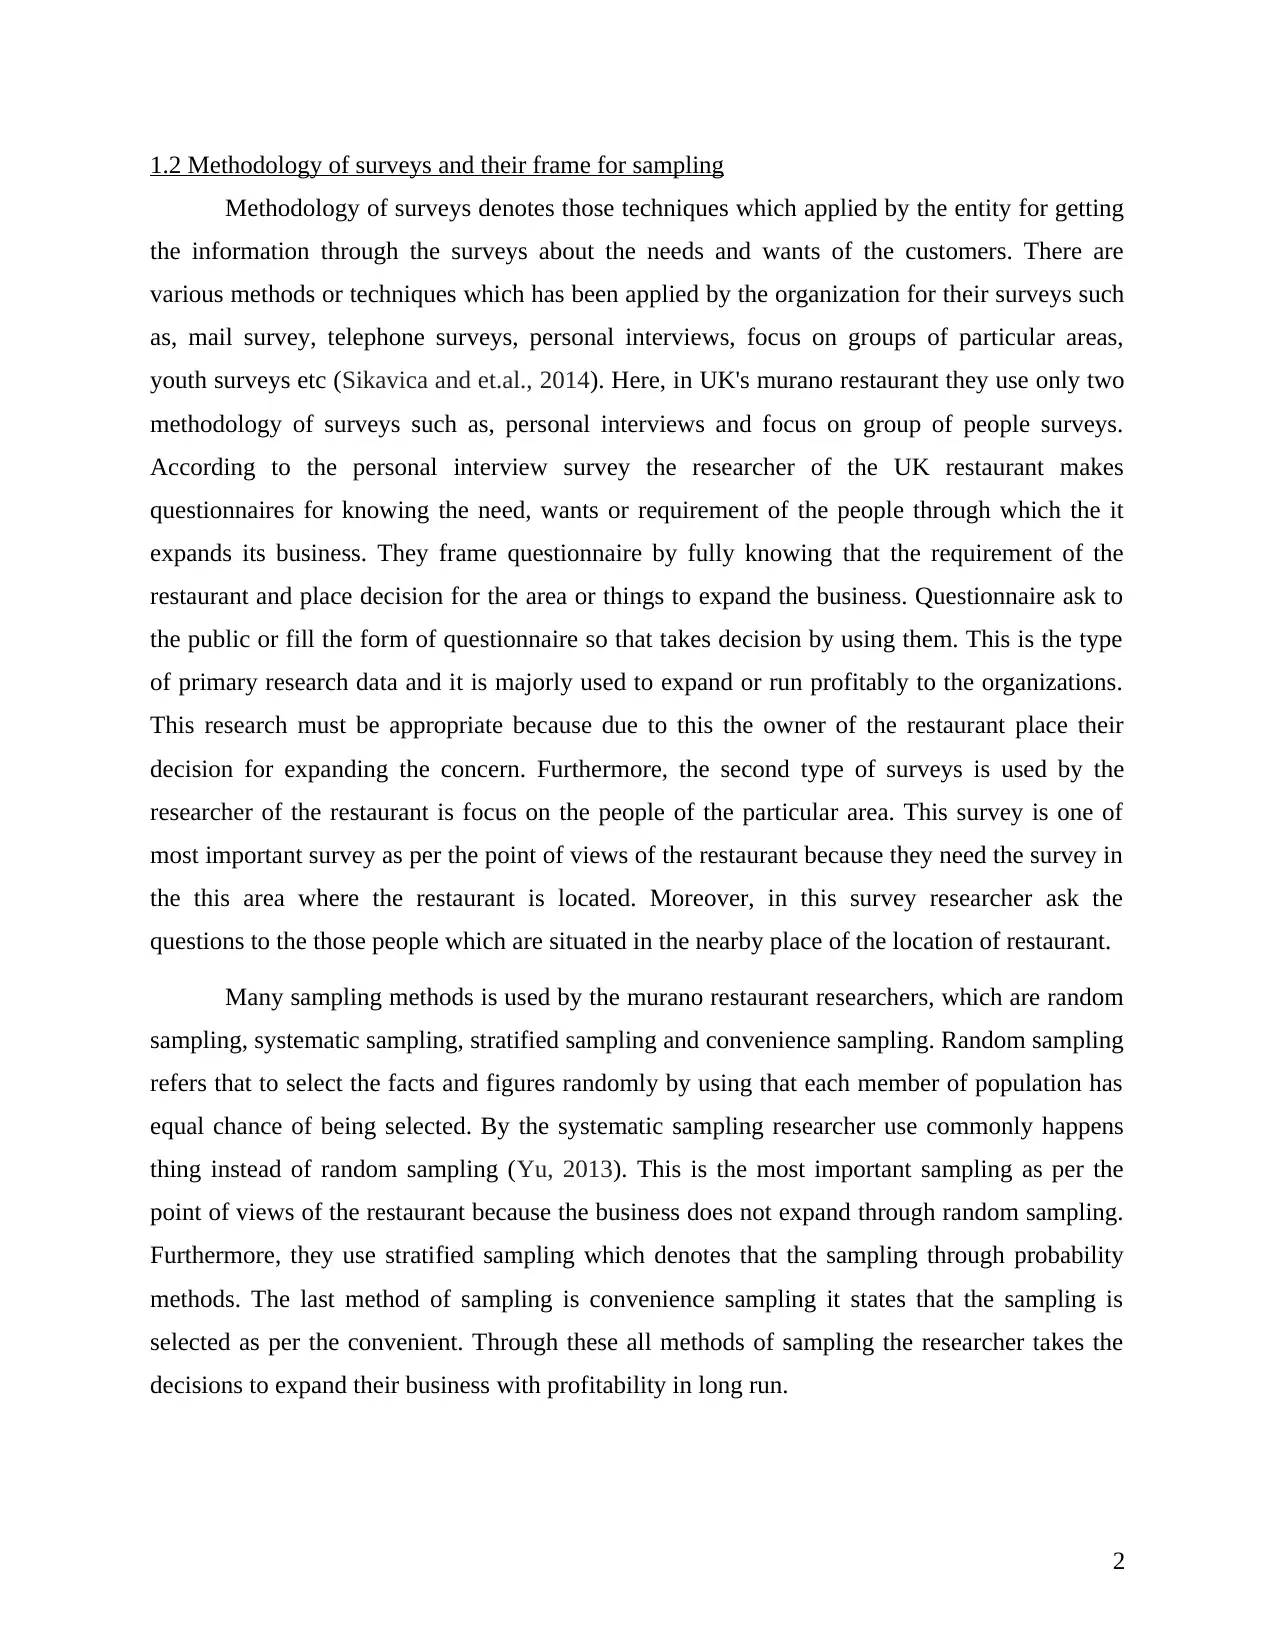
1.2 Methodology of surveys and their frame for sampling
Methodology of surveys denotes those techniques which applied by the entity for getting
the information through the surveys about the needs and wants of the customers. There are
various methods or techniques which has been applied by the organization for their surveys such
as, mail survey, telephone surveys, personal interviews, focus on groups of particular areas,
youth surveys etc (Sikavica and et.al., 2014). Here, in UK's murano restaurant they use only two
methodology of surveys such as, personal interviews and focus on group of people surveys.
According to the personal interview survey the researcher of the UK restaurant makes
questionnaires for knowing the need, wants or requirement of the people through which the it
expands its business. They frame questionnaire by fully knowing that the requirement of the
restaurant and place decision for the area or things to expand the business. Questionnaire ask to
the public or fill the form of questionnaire so that takes decision by using them. This is the type
of primary research data and it is majorly used to expand or run profitably to the organizations.
This research must be appropriate because due to this the owner of the restaurant place their
decision for expanding the concern. Furthermore, the second type of surveys is used by the
researcher of the restaurant is focus on the people of the particular area. This survey is one of
most important survey as per the point of views of the restaurant because they need the survey in
the this area where the restaurant is located. Moreover, in this survey researcher ask the
questions to the those people which are situated in the nearby place of the location of restaurant.
Many sampling methods is used by the murano restaurant researchers, which are random
sampling, systematic sampling, stratified sampling and convenience sampling. Random sampling
refers that to select the facts and figures randomly by using that each member of population has
equal chance of being selected. By the systematic sampling researcher use commonly happens
thing instead of random sampling (Yu, 2013). This is the most important sampling as per the
point of views of the restaurant because the business does not expand through random sampling.
Furthermore, they use stratified sampling which denotes that the sampling through probability
methods. The last method of sampling is convenience sampling it states that the sampling is
selected as per the convenient. Through these all methods of sampling the researcher takes the
decisions to expand their business with profitability in long run.
2
⊘ This is a preview!⊘
Do you want full access?
Subscribe today to unlock all pages.
Trusted by 1+ million students worldwide
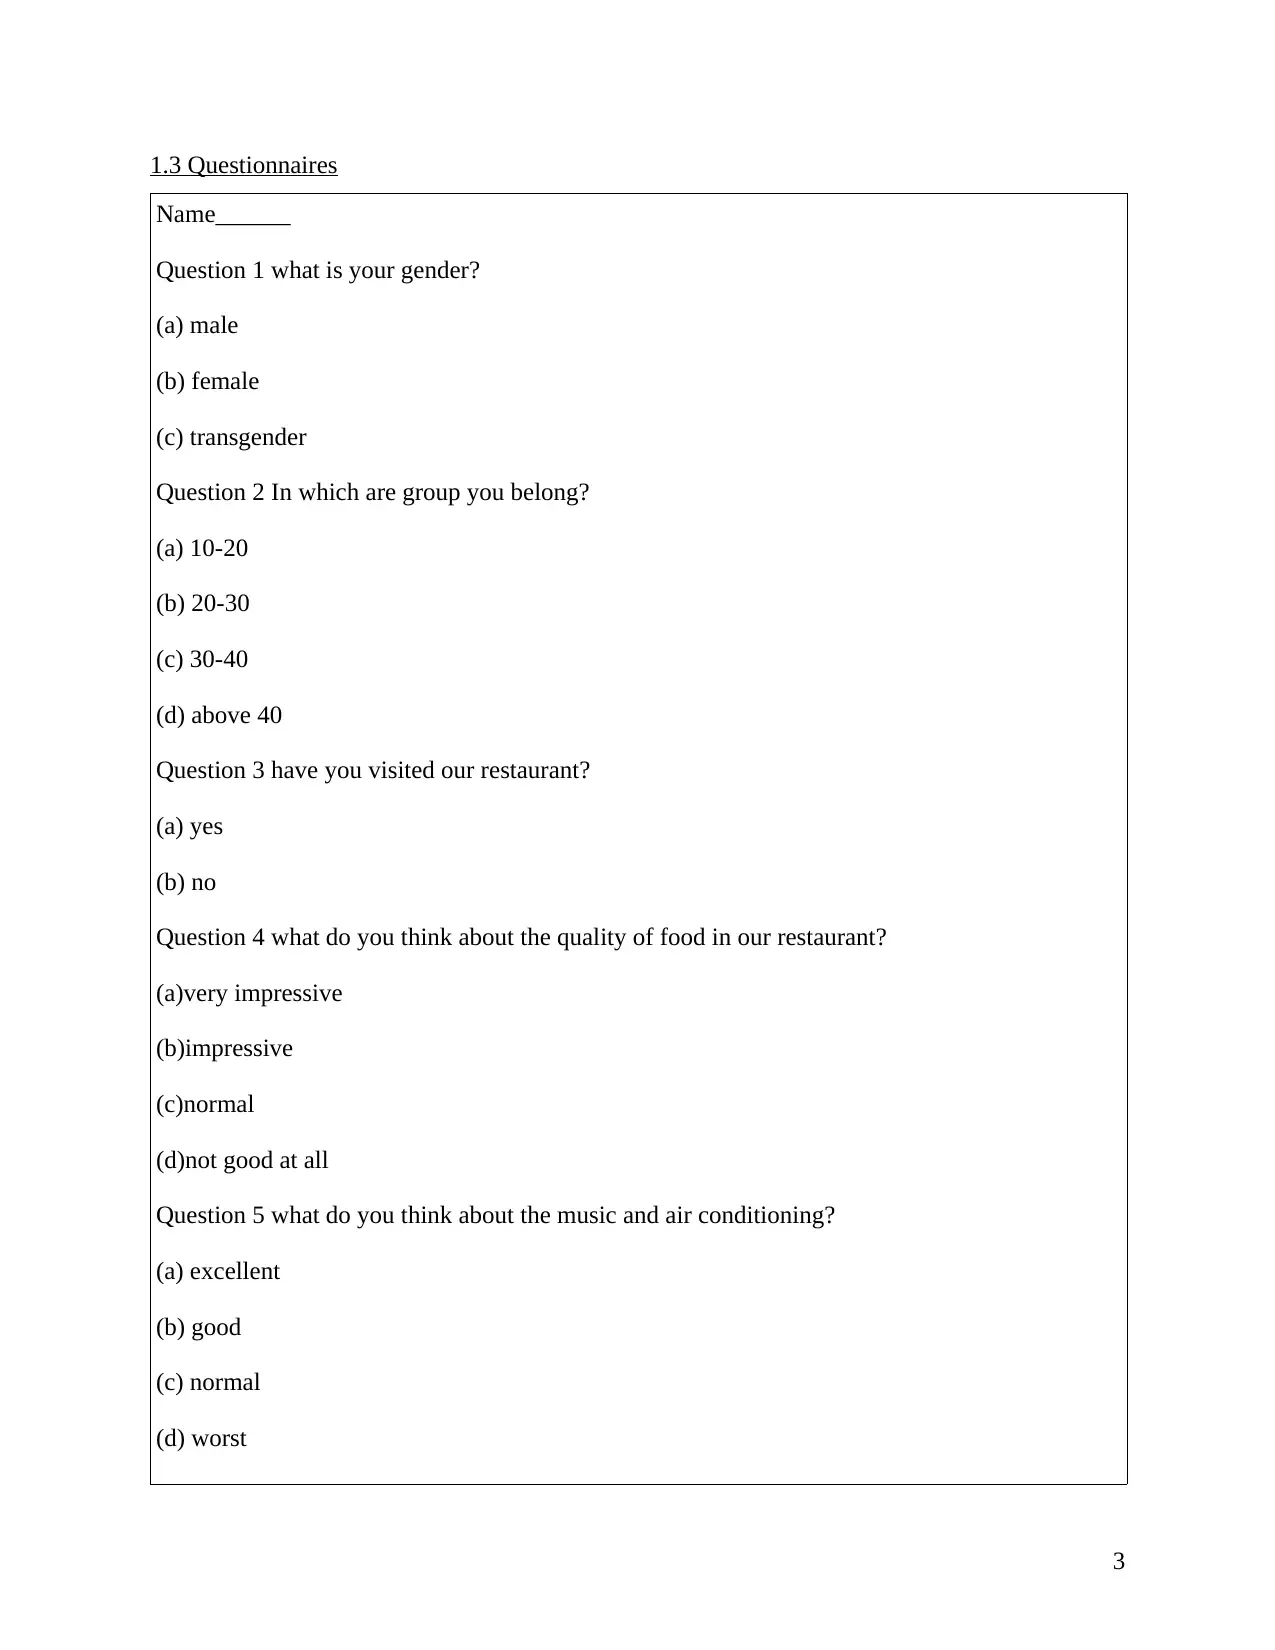
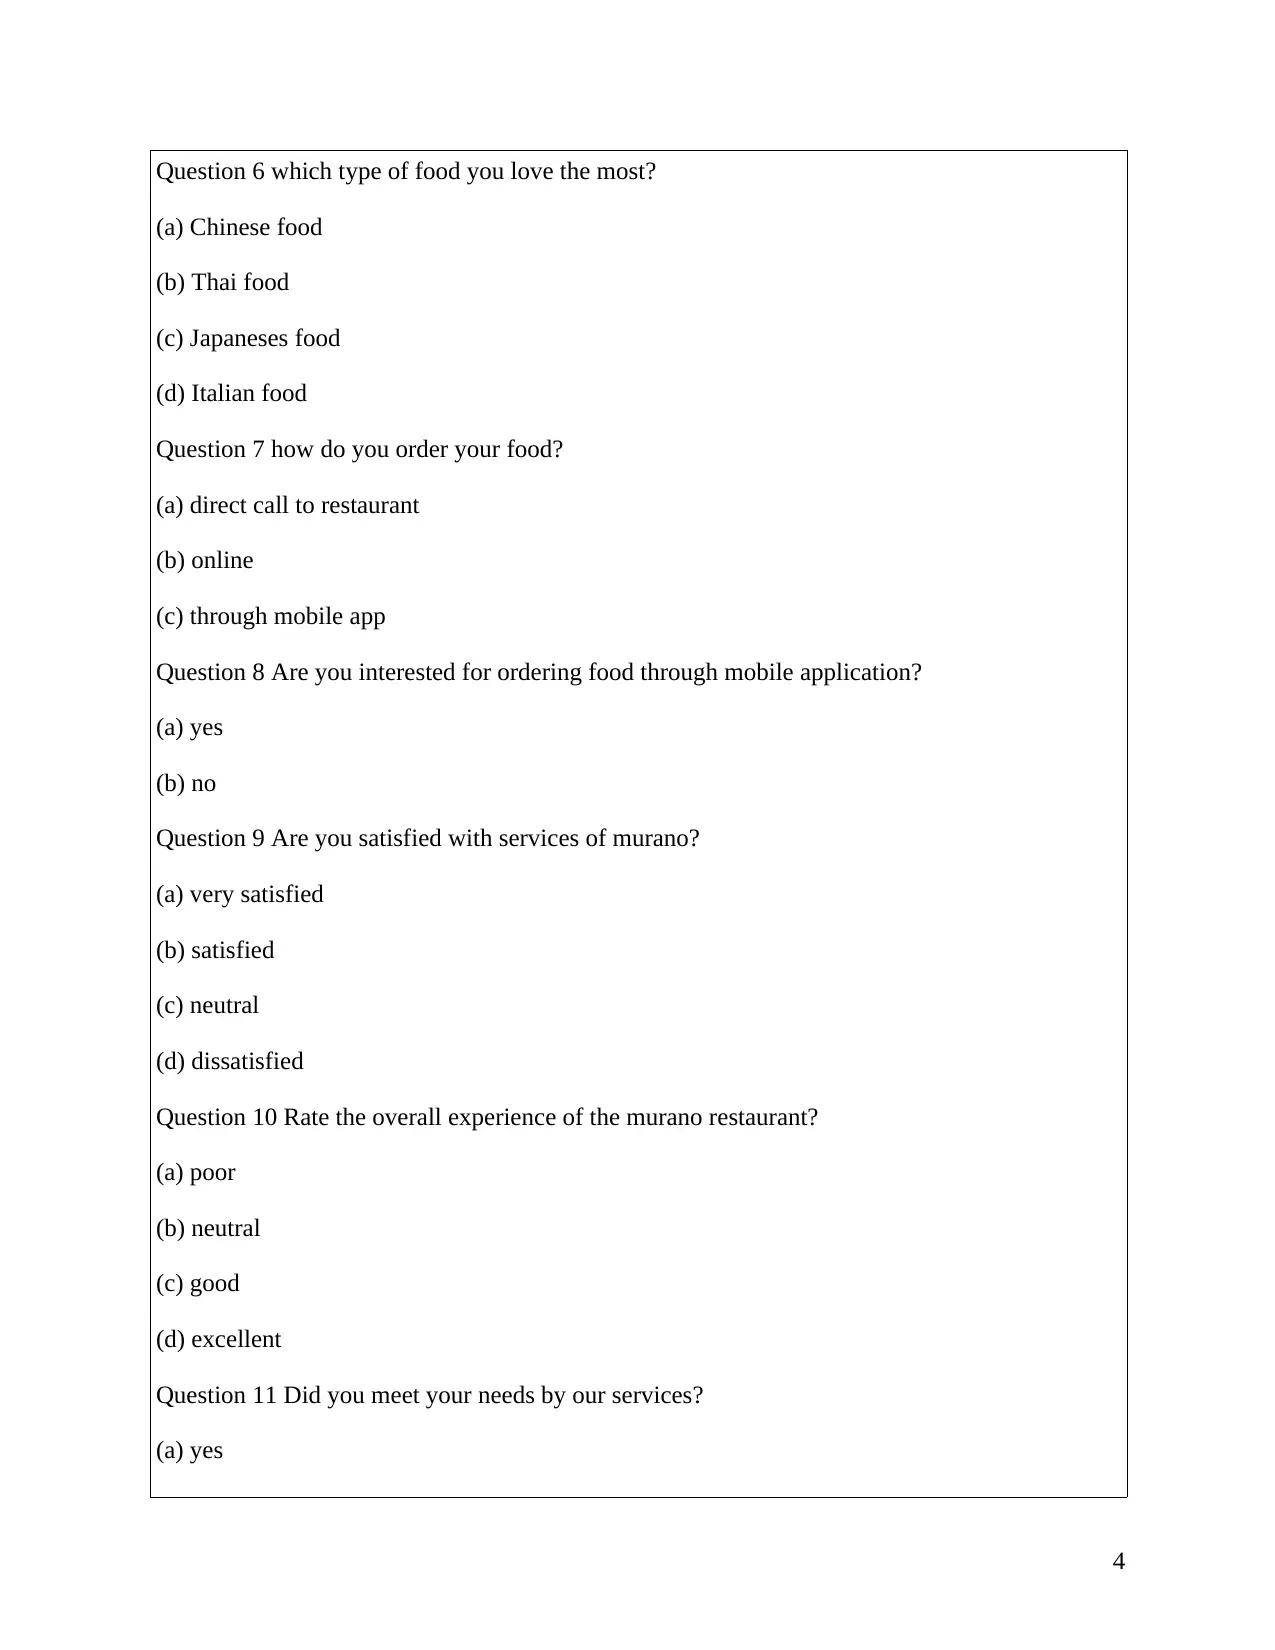
1.3 Questionnaires
Name______
Question 1 what is your gender?
(a) male
(b) female
(c) transgender
Question 2 In which are group you belong?
(a) 10-20
(b) 20-30
(c) 30-40
(d) above 40
Question 3 have you visited our restaurant?
(a) yes
(b) no
Question 4 what do you think about the quality of food in our restaurant?
(a)very impressive
(b)impressive
(c)normal
(d)not good at all
Question 5 what do you think about the music and air conditioning?
(a) excellent
(b) good
(c) normal
(d) worst
3
Paraphrase This Document
Need a fresh take? Get an instant paraphrase of this document with our AI Paraphraser
Question 6 which type of food you love the most?
(a) Chinese food
(b) Thai food
(c) Japaneses food
(d) Italian food
Question 7 how do you order your food?
(a) direct call to restaurant
(b) online
(c) through mobile app
Question 8 Are you interested for ordering food through mobile application?
(a) yes
(b) no
Question 9 Are you satisfied with services of murano?
(a) very satisfied
(b) satisfied
(c) neutral
(d) dissatisfied
Question 10 Rate the overall experience of the murano restaurant?
(a) poor
(b) neutral
(c) good
(d) excellent
Question 11 Did you meet your needs by our services?
(a) yes
4
(b) no
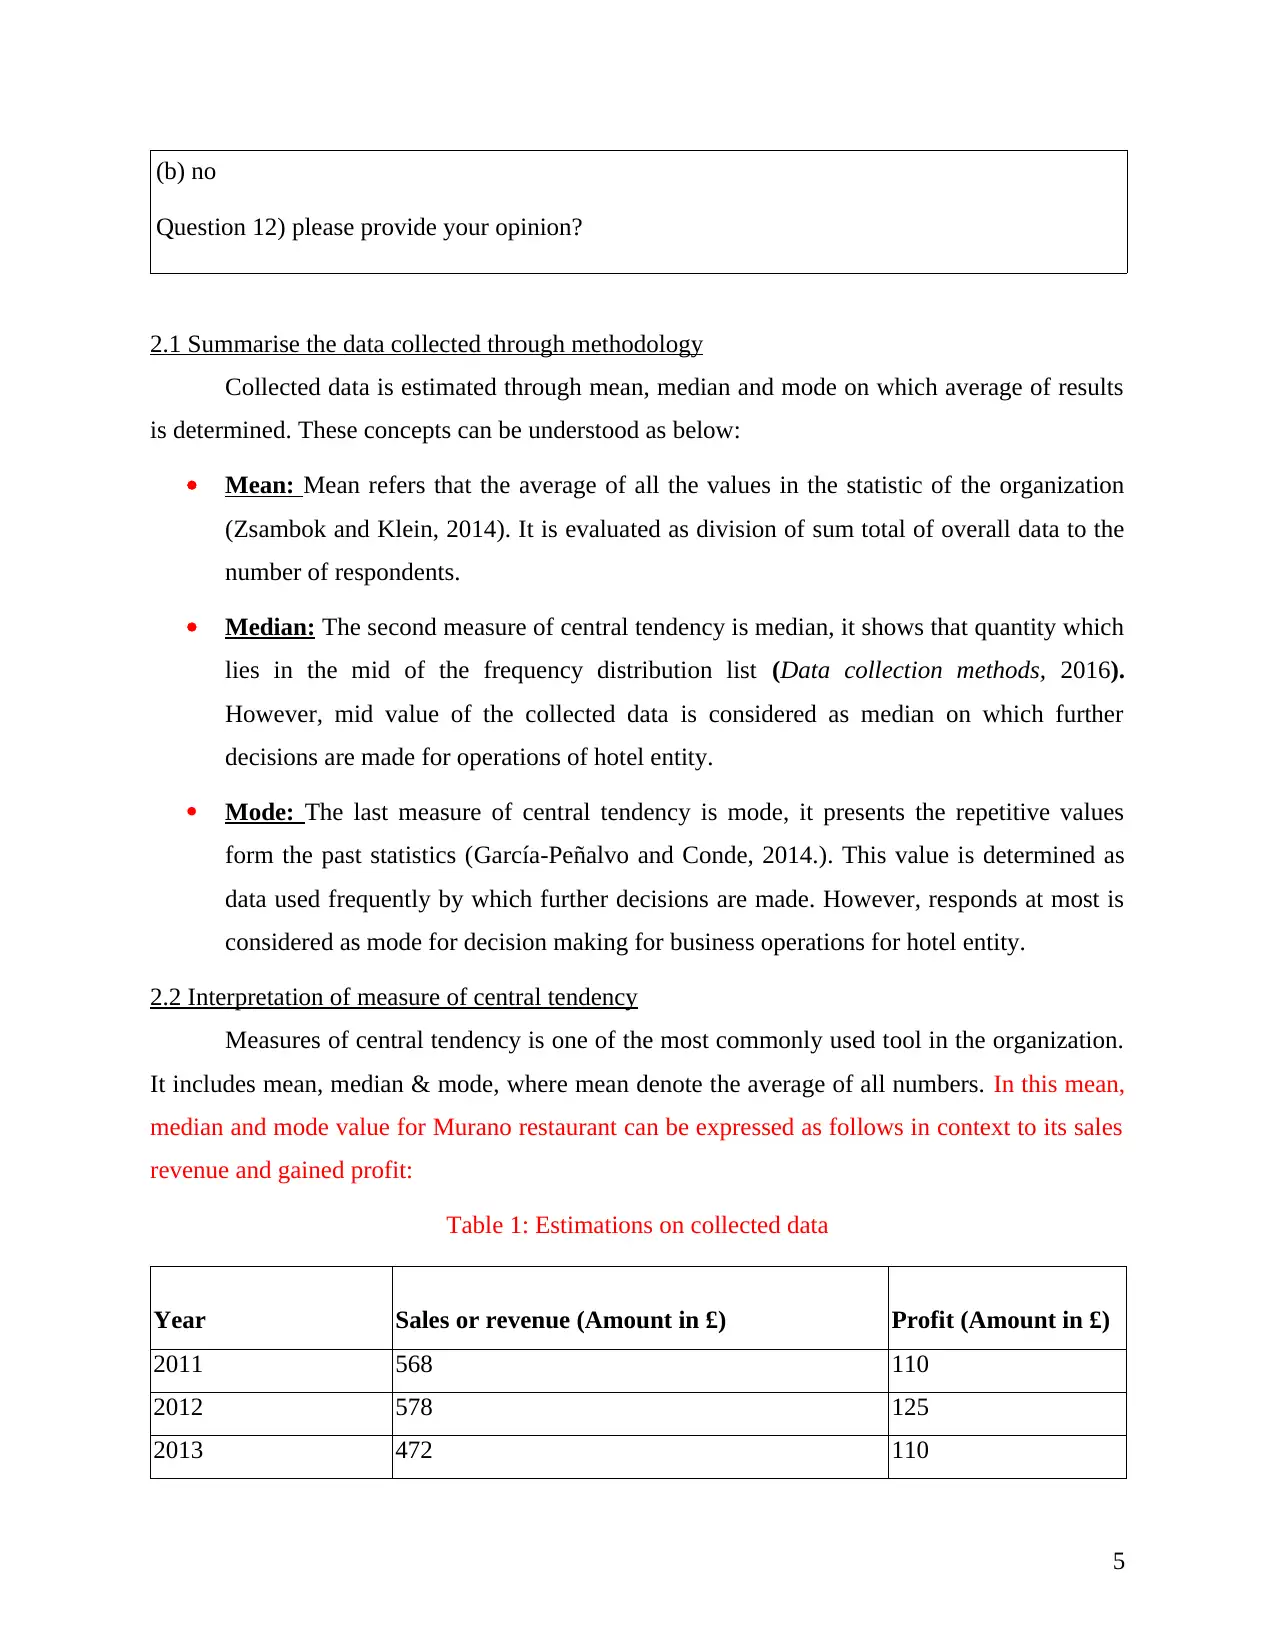
Question 12) please provide your opinion?
2.1 Summarise the data collected through methodology
Collected data is estimated through mean, median and mode on which average of results
is determined. These concepts can be understood as below:
Mean: Mean refers that the average of all the values in the statistic of the organization
(Zsambok and Klein, 2014). It is evaluated as division of sum total of overall data to the
number of respondents.
Median: The second measure of central tendency is median, it shows that quantity which
lies in the mid of the frequency distribution list (Data collection methods, 2016).
However, mid value of the collected data is considered as median on which further
decisions are made for operations of hotel entity.
Mode: The last measure of central tendency is mode, it presents the repetitive values
form the past statistics (García-Peñalvo and Conde, 2014.). This value is determined as
data used frequently by which further decisions are made. However, responds at most is
considered as mode for decision making for business operations for hotel entity.
2.2 Interpretation of measure of central tendency
Measures of central tendency is one of the most commonly used tool in the organization.
It includes mean, median & mode, where mean denote the average of all numbers. In this mean,
median and mode value for Murano restaurant can be expressed as follows in context to its sales
revenue and gained profit:
Table 1: Estimations on collected data
Year Sales or revenue (Amount in £) Profit (Amount in £)
2011 568 110
2012 578 125
2013 472 110
5
⊘ This is a preview!⊘
Do you want full access?
Subscribe today to unlock all pages.
Trusted by 1+ million students worldwide
2014 600 140
2015 720 160
2016 745 200
2017 800 230
Mean 640.4285714286 153.5714285714
Median 600 140
Mode 0 110
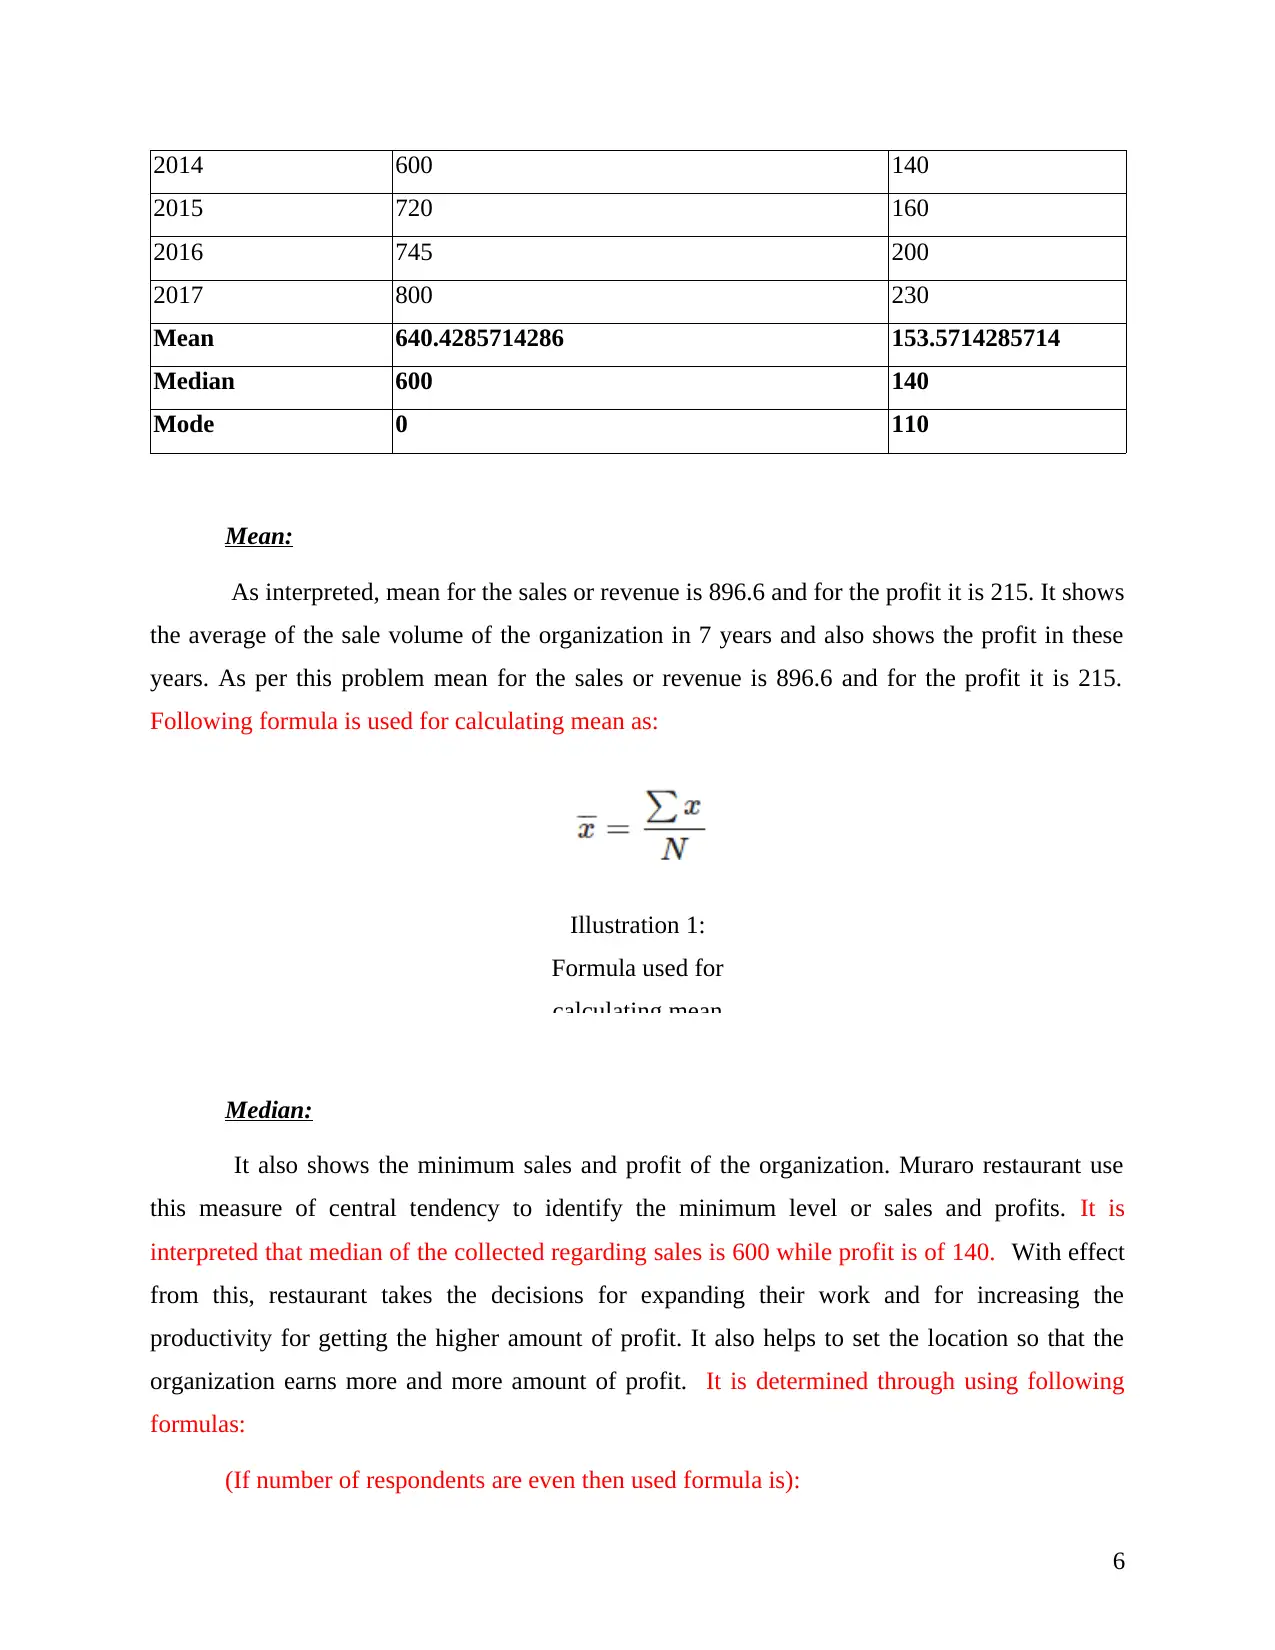
Mean:
As interpreted, mean for the sales or revenue is 896.6 and for the profit it is 215. It shows
the average of the sale volume of the organization in 7 years and also shows the profit in these
years. As per this problem mean for the sales or revenue is 896.6 and for the profit it is 215.
Following formula is used for calculating mean as:
Illustration 1:
Formula used for
calculating mean
Median:
It also shows the minimum sales and profit of the organization. Muraro restaurant use
this measure of central tendency to identify the minimum level or sales and profits. It is
interpreted that median of the collected regarding sales is 600 while profit is of 140. With effect
from this, restaurant takes the decisions for expanding their work and for increasing the
productivity for getting the higher amount of profit. It also helps to set the location so that the
organization earns more and more amount of profit. It is determined through using following
formulas:
(If number of respondents are even then used formula is):
6
2015 720 160
2016 745 200
2017 800 230
Mean 640.4285714286 153.5714285714
Median 600 140
Mode 0 110
Mean:
As interpreted, mean for the sales or revenue is 896.6 and for the profit it is 215. It shows
the average of the sale volume of the organization in 7 years and also shows the profit in these
years. As per this problem mean for the sales or revenue is 896.6 and for the profit it is 215.
Following formula is used for calculating mean as:
Illustration 1:
Formula used for
calculating mean
Median:
It also shows the minimum sales and profit of the organization. Muraro restaurant use
this measure of central tendency to identify the minimum level or sales and profits. It is
interpreted that median of the collected regarding sales is 600 while profit is of 140. With effect
from this, restaurant takes the decisions for expanding their work and for increasing the
productivity for getting the higher amount of profit. It also helps to set the location so that the
organization earns more and more amount of profit. It is determined through using following
formulas:
(If number of respondents are even then used formula is):
6
Paraphrase This Document
Need a fresh take? Get an instant paraphrase of this document with our AI Paraphraser
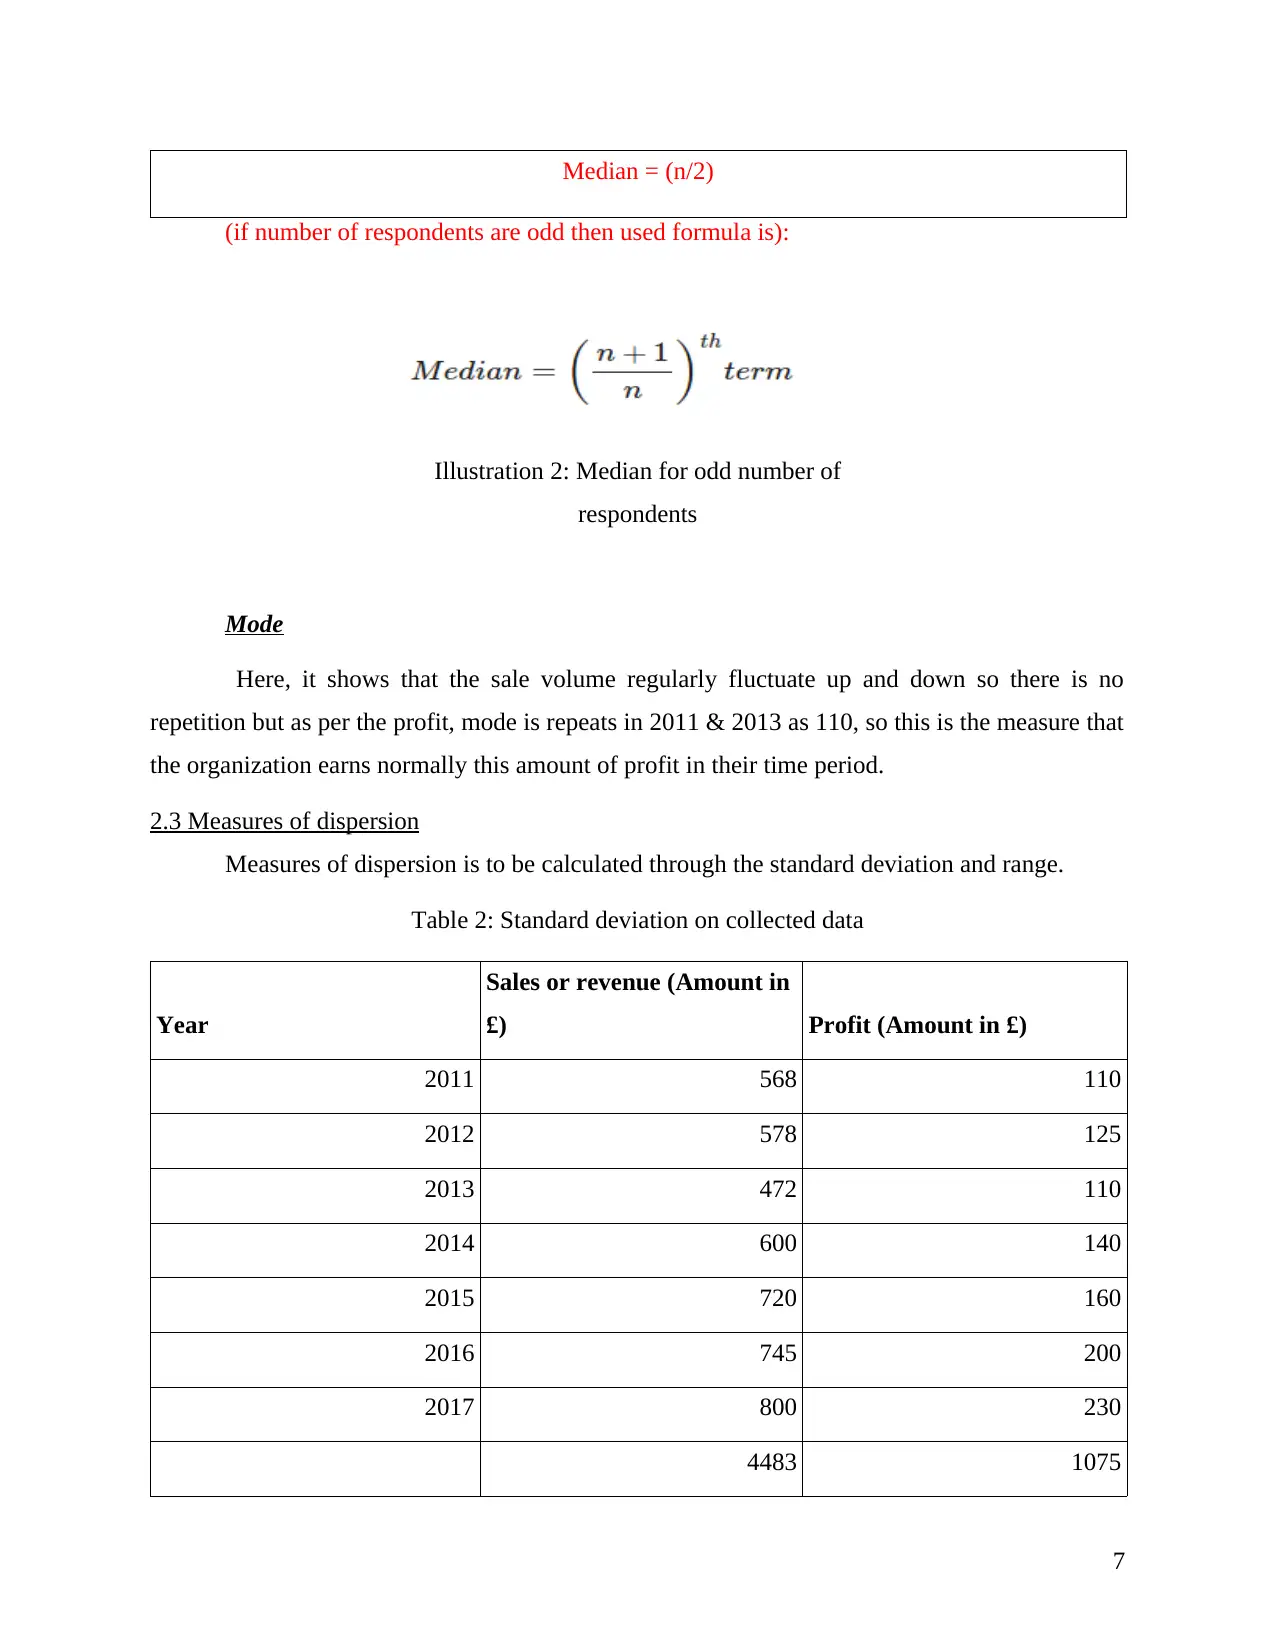
Median = (n/2)
(if number of respondents are odd then used formula is):
Mode
Here, it shows that the sale volume regularly fluctuate up and down so there is no
repetition but as per the profit, mode is repeats in 2011 & 2013 as 110, so this is the measure that
the organization earns normally this amount of profit in their time period.
2.3 Measures of dispersion
Measures of dispersion is to be calculated through the standard deviation and range.
Table 2: Standard deviation on collected data
Year
Sales or revenue (Amount in
£) Profit (Amount in £)
2011 568 110
2012 578 125
2013 472 110
2014 600 140
2015 720 160
2016 745 200
2017 800 230
4483 1075
7
Illustration 2: Median for odd number of
respondents
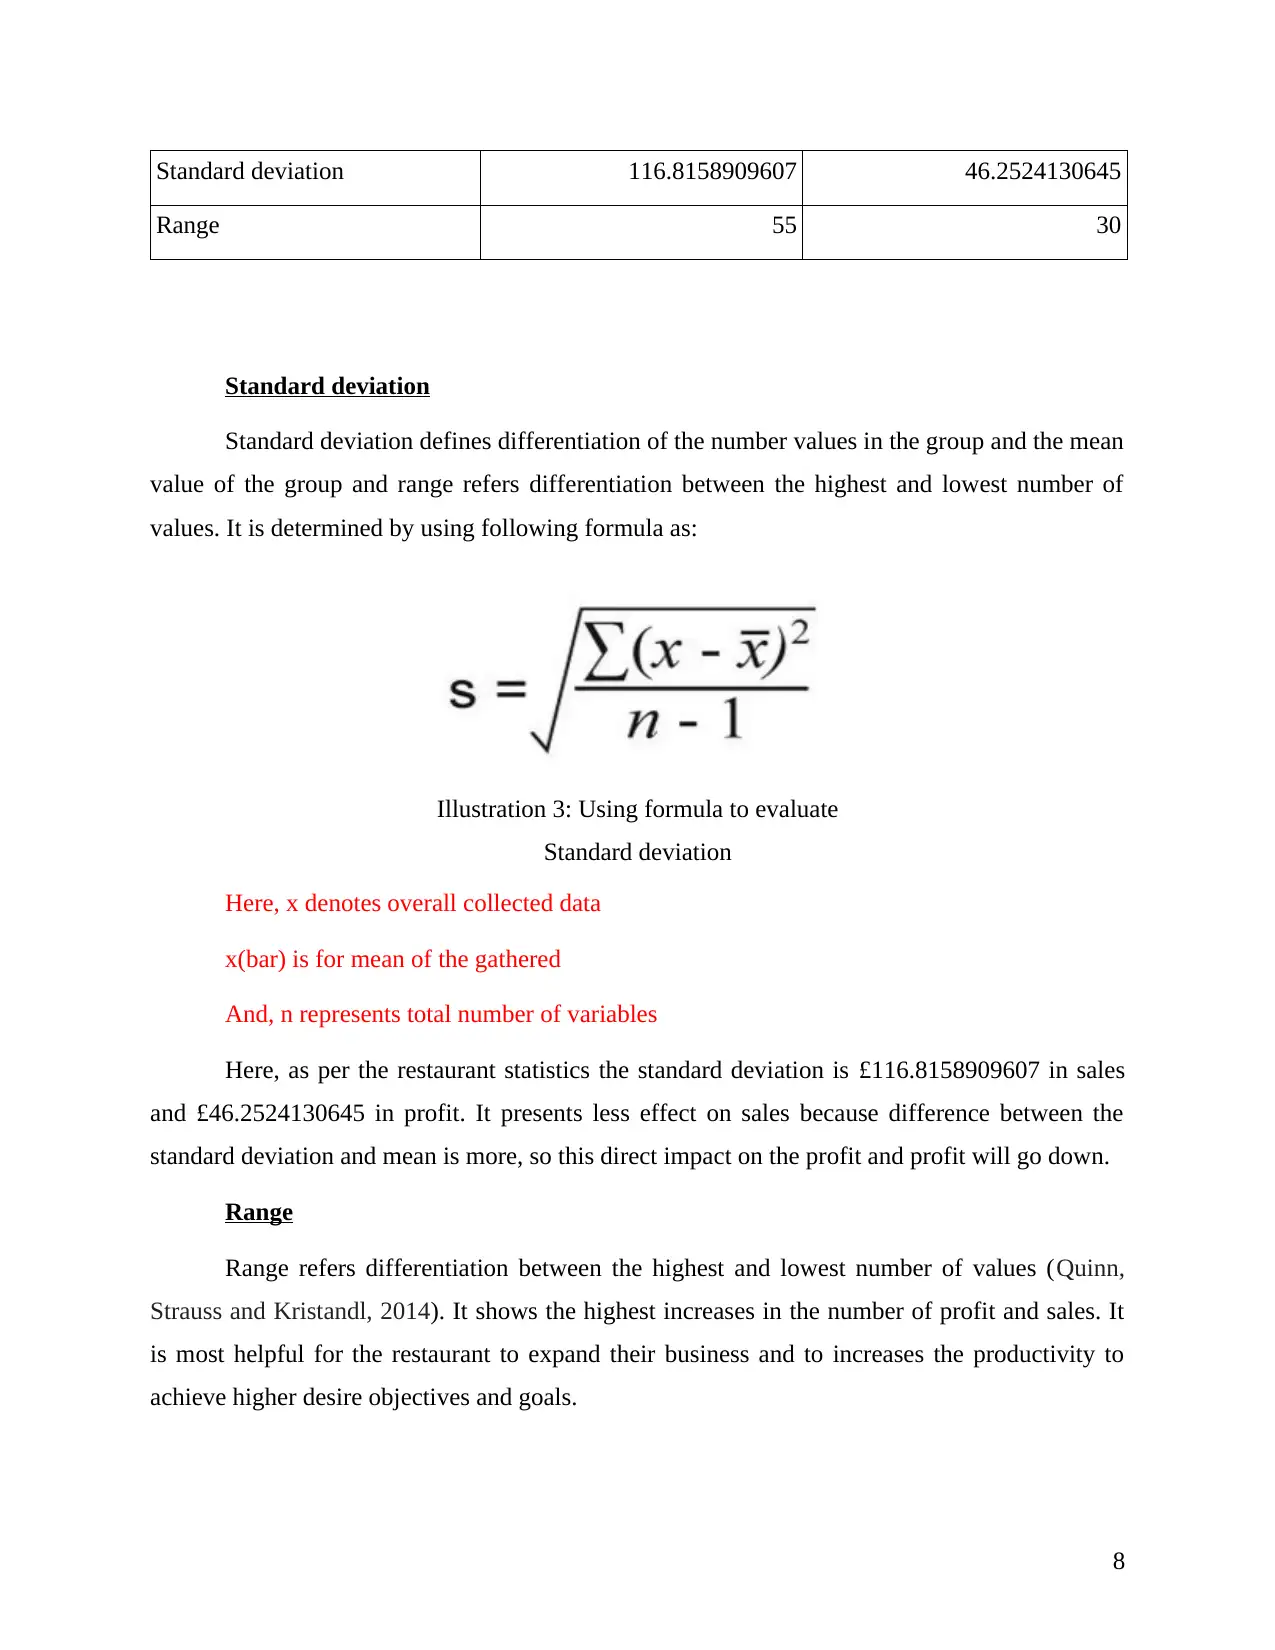
Standard deviation 116.8158909607 46.2524130645
Range 55 30
Standard deviation
Standard deviation defines differentiation of the number values in the group and the mean
value of the group and range refers differentiation between the highest and lowest number of
values. It is determined by using following formula as:
Illustration 3: Using formula to evaluate
Standard deviation
Here, x denotes overall collected data
x(bar) is for mean of the gathered
And, n represents total number of variables
Here, as per the restaurant statistics the standard deviation is £116.8158909607 in sales
and £46.2524130645 in profit. It presents less effect on sales because difference between the
standard deviation and mean is more, so this direct impact on the profit and profit will go down.
Range
Range refers differentiation between the highest and lowest number of values (Quinn,
Strauss and Kristandl, 2014). It shows the highest increases in the number of profit and sales. It
is most helpful for the restaurant to expand their business and to increases the productivity to
achieve higher desire objectives and goals.
8
⊘ This is a preview!⊘
Do you want full access?
Subscribe today to unlock all pages.
Trusted by 1+ million students worldwide
1 out of 27
Related Documents


Your All-in-One AI-Powered Toolkit for Academic Success.
+13062052269
info@desklib.com
Available 24*7 on WhatsApp / Email
![[object Object]](/_next/static/media/star-bottom.7253800d.svg)
Unlock your academic potential
Copyright © 2020–2026 A2Z Services. All Rights Reserved. Developed and managed by ZUCOL.