Business Analysis and Planning: Luxury Residential Care Home in UK
VerifiedAdded on 2020/06/06
|24
|4721
|26
Report
AI Summary
This report provides a comprehensive analysis of the UK care home market, focusing on the potential for a luxury residential care home in Cambridgeshire. It begins with an introduction to the market, highlighting its value and growth potential. The report details a data collection strategy that includes both primary (surveys) and secondary research methods. The primary data analysis utilizes SPSS to analyze survey results, focusing on resident preferences for accommodation, food, and services. Statistical findings, including descriptive statistics, frequency distributions, and a regression model, are presented to identify key factors influencing resident satisfaction. The report also addresses risk management, covering risk identification, analysis, and mitigation strategies. A literature review is included to support the analysis. The report concludes with a summary of findings and recommendations for the proposed care home, emphasizing the importance of high-quality accommodation, nutritional food, and personalized services to meet the needs of the elderly population.

BUSINESS ANALYSIS AND PLANNING
Paraphrase This Document
Need a fresh take? Get an instant paraphrase of this document with our AI Paraphraser
Table of Contents
INTRODUCTION...........................................................................................................................1
DATA COLLECTION STRATEGY..............................................................................................1
Primary data collection................................................................................................................1
Secondary data collection............................................................................................................2
USE SOFTWARE FOR DECISION MAKING.............................................................................2
IDENTIFICATION.......................................................................................................................10
OBJECTIVE..................................................................................................................................12
RATIONALE................................................................................................................................12
RISK MANAGEMENT................................................................................................................12
Risk identification..................................................................................................................13
Risk analysis and evaluation..................................................................................................14
Risk matrix.............................................................................................................................14
Risk mitigation: Treatment and monitoring...........................................................................15
LITERATURE REVIEW..............................................................................................................15
CONCLUSION..............................................................................................................................16
REFERENCES..............................................................................................................................18
APPENDIX....................................................................................................................................19
INTRODUCTION
UK care home sector worth around £15.9 billion in a year with 410,000 residents.
Currently, there are around 11,300 care service providers operating care home for the older
people. Among these, 95% is owned by the private sector and charitable providers. With the
rising number of aging population, the market demand for the sector continuous to grow. Office
for National Statistics (ONS) projected 36% growing aging population from 1.5 to 2 million by
2015-2025, which substantially increase demand. The sector presents a strong opportunity to the
new entrepreneurs to Open Luxury Residential Care Home in the Cambridgeshire. Thus, the
research paper will examine the current trends of Care Home market in London and analyze that,
to what extent the project will be worthy and deliver good profitability or not. It will be done
through collecting data from both the primary and secondary sources and analyze through
suitable method. Apart from this, various risks will be identified and accordingly plan would be
design to mitigate their occurrence.
DATA COLLECTION STRATEGY
Before planning and establishing a new business unit in the competitive and uncertain
market era, investor needs to collect required information by different sources, including both
primary and secondary. For the planned investment in UK care home market, data gathering plan
is constructed below:
Primary data collection
As name itself, it is the information collected for the first time by the researcher
himself/herself. Thus, it require investigator to carry out a real market research of the target
respondents to obtain specific details. No-doubt, it is a costlier way of data gathering and takes
lot of time, still, excessively used in the real business practice to collect authentic and reliable
information (Sullivan-Bolyai, Bova and Singh, 2014). Survey, observation, focus group,
interview and others are several popular tools of primary data collection, among all;
questionnaire survey is one of the great tools that carry out market survey of the selected
participants to determine people’ preferences, desires and other factors that affect the growth of
care home.
1 | P a g e
⊘ This is a preview!⊘
Do you want full access?
Subscribe today to unlock all pages.
Trusted by 1+ million students worldwide
For the purpose of the business plan, elderly people preferences can be know through
surveying them. Questionnaire is the best way and useful for surveying people, in which, they
will be asked with the certain key questions regarding all the care home facilities like
accommodation, chargeable fees, social activities and other aspects. By the help of this, gap will
be determined prevailing in the sector so as to open a new luxurious house that will satisfy
people requirement in the best manner (Matthews and Ross, 2014). As UK has vast population of
elderly people, therefore, it is not possible to survey universe. Thus, it is decided to survey 50
people who are currently living in a care home. All the people will be randomly selected at no
biasness to assure data authenticity. It will be a field survey, in which, selected target
respondents will be asked with framed questions and their responses will be generated. In order
to assure high rate of response, all the people will be asked for their voluntary participation in the
survey.
Secondary data collection
Secondary dataset collects information that is already available for use and do not
requires an original investigation. The data set may be either available in the published form or
sources which are not published like reports published by regulatory authorities, previous
research studies, online material, academicians research and others (Orkin, 2014). The key
benefit associated with the method is that it is very fast way of data gathering, however,
sometimes information may be outdated. Besides this, limited quantum of secondary resources is
a major drawback of it.
In order to establish a new Luxury Residential Care Home in Cambridgeshire, secondary
information can be acquired to know current trends in the care home market, staff wages,
property costs, average weekly rental charges and others. For the purpose of current research,
care home market reports, online material and academic literatures will be used for secondary
survey (Best and Kahn, 2016). It will help to analyse growth drivers for the care home operators,
critical business challenges and various strategies to gain strong success in the market.
USE SOFTWARE FOR DECISION MAKING
After obtaining required data set, it needs to be analyzed thoroughly applying the best
tool and technique. It may be of different types such as quantitative and qualitative. For the given
2 | P a g e
Paraphrase This Document
Need a fresh take? Get an instant paraphrase of this document with our AI Paraphraser
research, as 50 care home service users will be surveyed through questionnaire, thus, it will use
quantitative information that will be analyzed and examined through Statistical Package (SPSS).
Using this, necessary statistical calculations will be performed including correlation, descriptive
statistics, frequency table and regression to judge impact of different factors on Luxury Care
Home market success (Mayers, 2013). In addition, necessary charts for the graphical
presentation will be made such as pie chart and column chart.
Primary data analysis
Gender
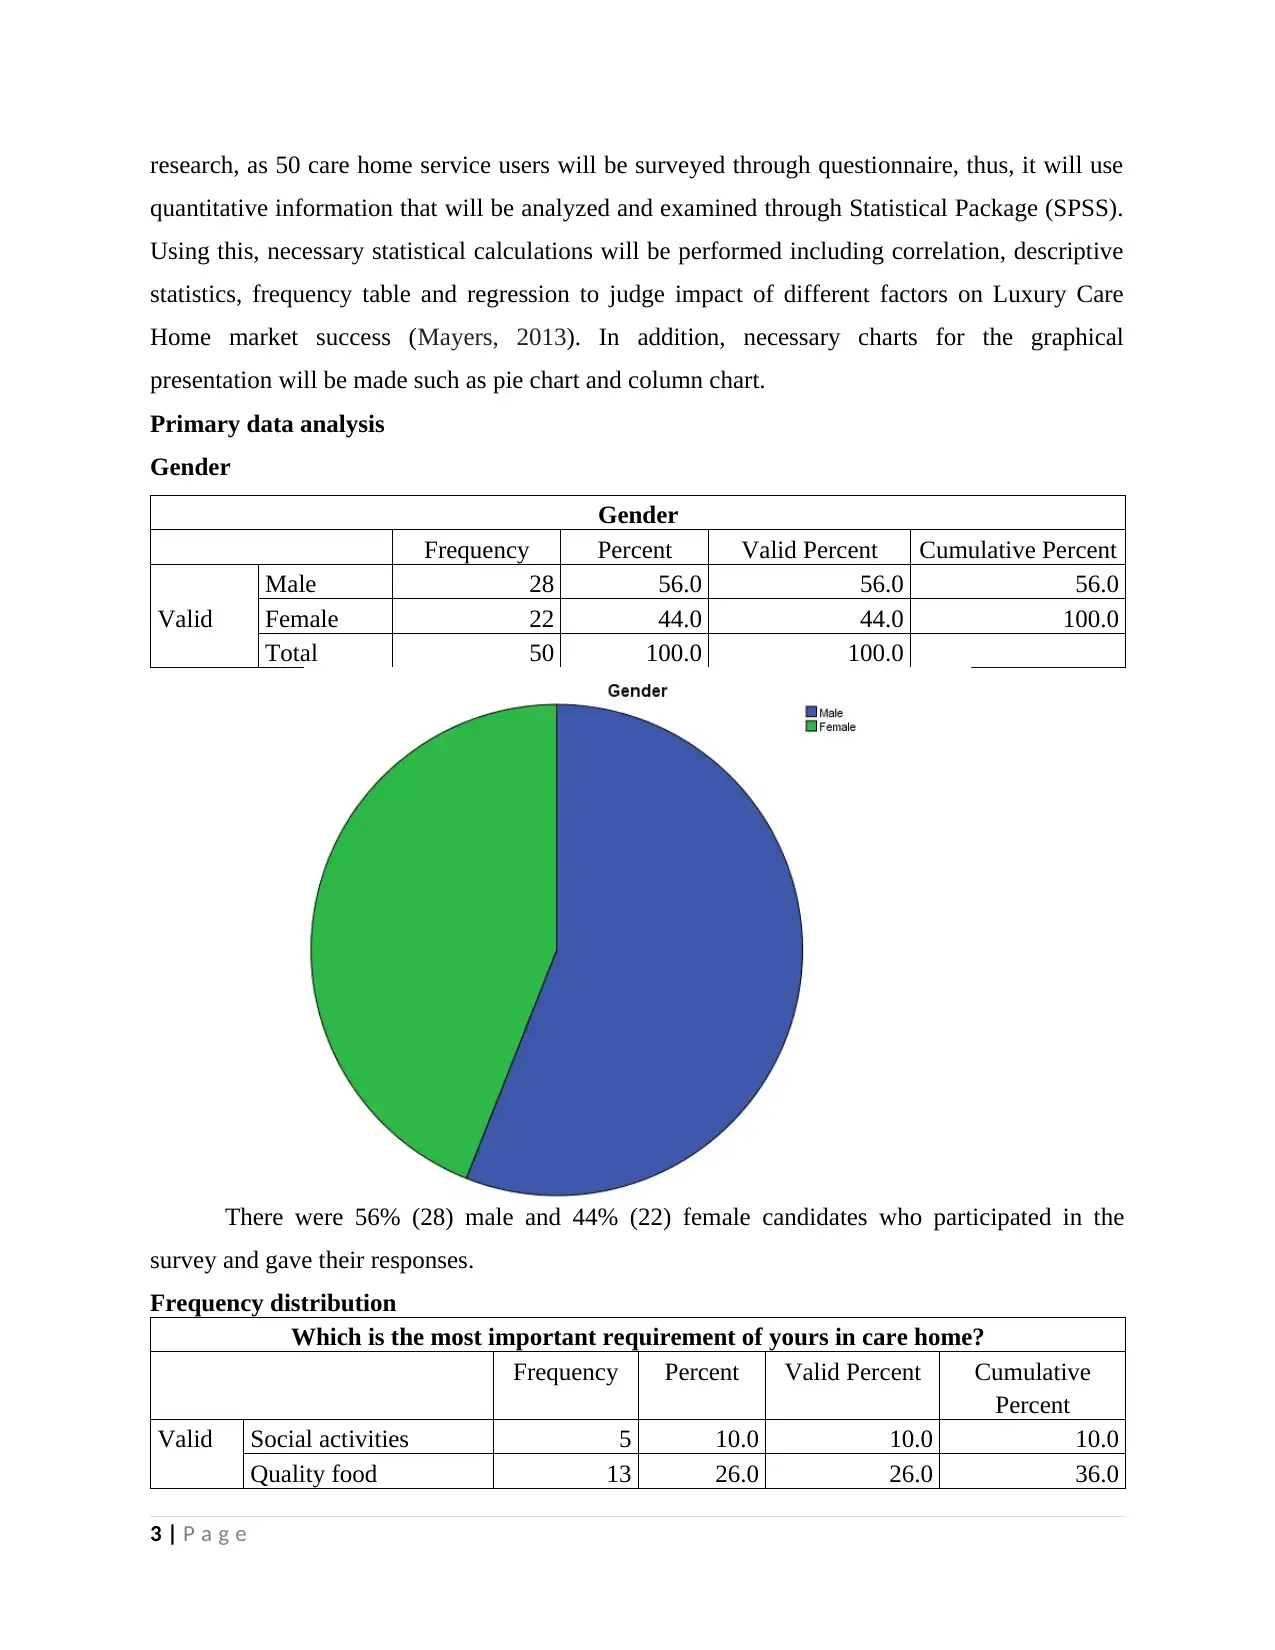
Gender
Frequency Percent Valid Percent Cumulative Percent
Valid
Male 28 56.0 56.0 56.0
Female 22 44.0 44.0 100.0
Total 50 100.0 100.0
There were 56% (28) male and 44% (22) female candidates who participated in the
survey and gave their responses.
Frequency distribution
Which is the most important requirement of yours in care home?
Frequency Percent Valid Percent Cumulative
Percent
Valid Social activities 5 10.0 10.0 10.0
Quality food 13 26.0 26.0 36.0
3 | P a g e
quantitative information that will be analyzed and examined through Statistical Package (SPSS).
Using this, necessary statistical calculations will be performed including correlation, descriptive
statistics, frequency table and regression to judge impact of different factors on Luxury Care
Home market success (Mayers, 2013). In addition, necessary charts for the graphical
presentation will be made such as pie chart and column chart.
Primary data analysis
Gender
Gender
Frequency Percent Valid Percent Cumulative Percent
Valid
Male 28 56.0 56.0 56.0
Female 22 44.0 44.0 100.0
Total 50 100.0 100.0
There were 56% (28) male and 44% (22) female candidates who participated in the
survey and gave their responses.
Frequency distribution
Which is the most important requirement of yours in care home?
Frequency Percent Valid Percent Cumulative
Percent
Valid Social activities 5 10.0 10.0 10.0
Quality food 13 26.0 26.0 36.0
3 | P a g e
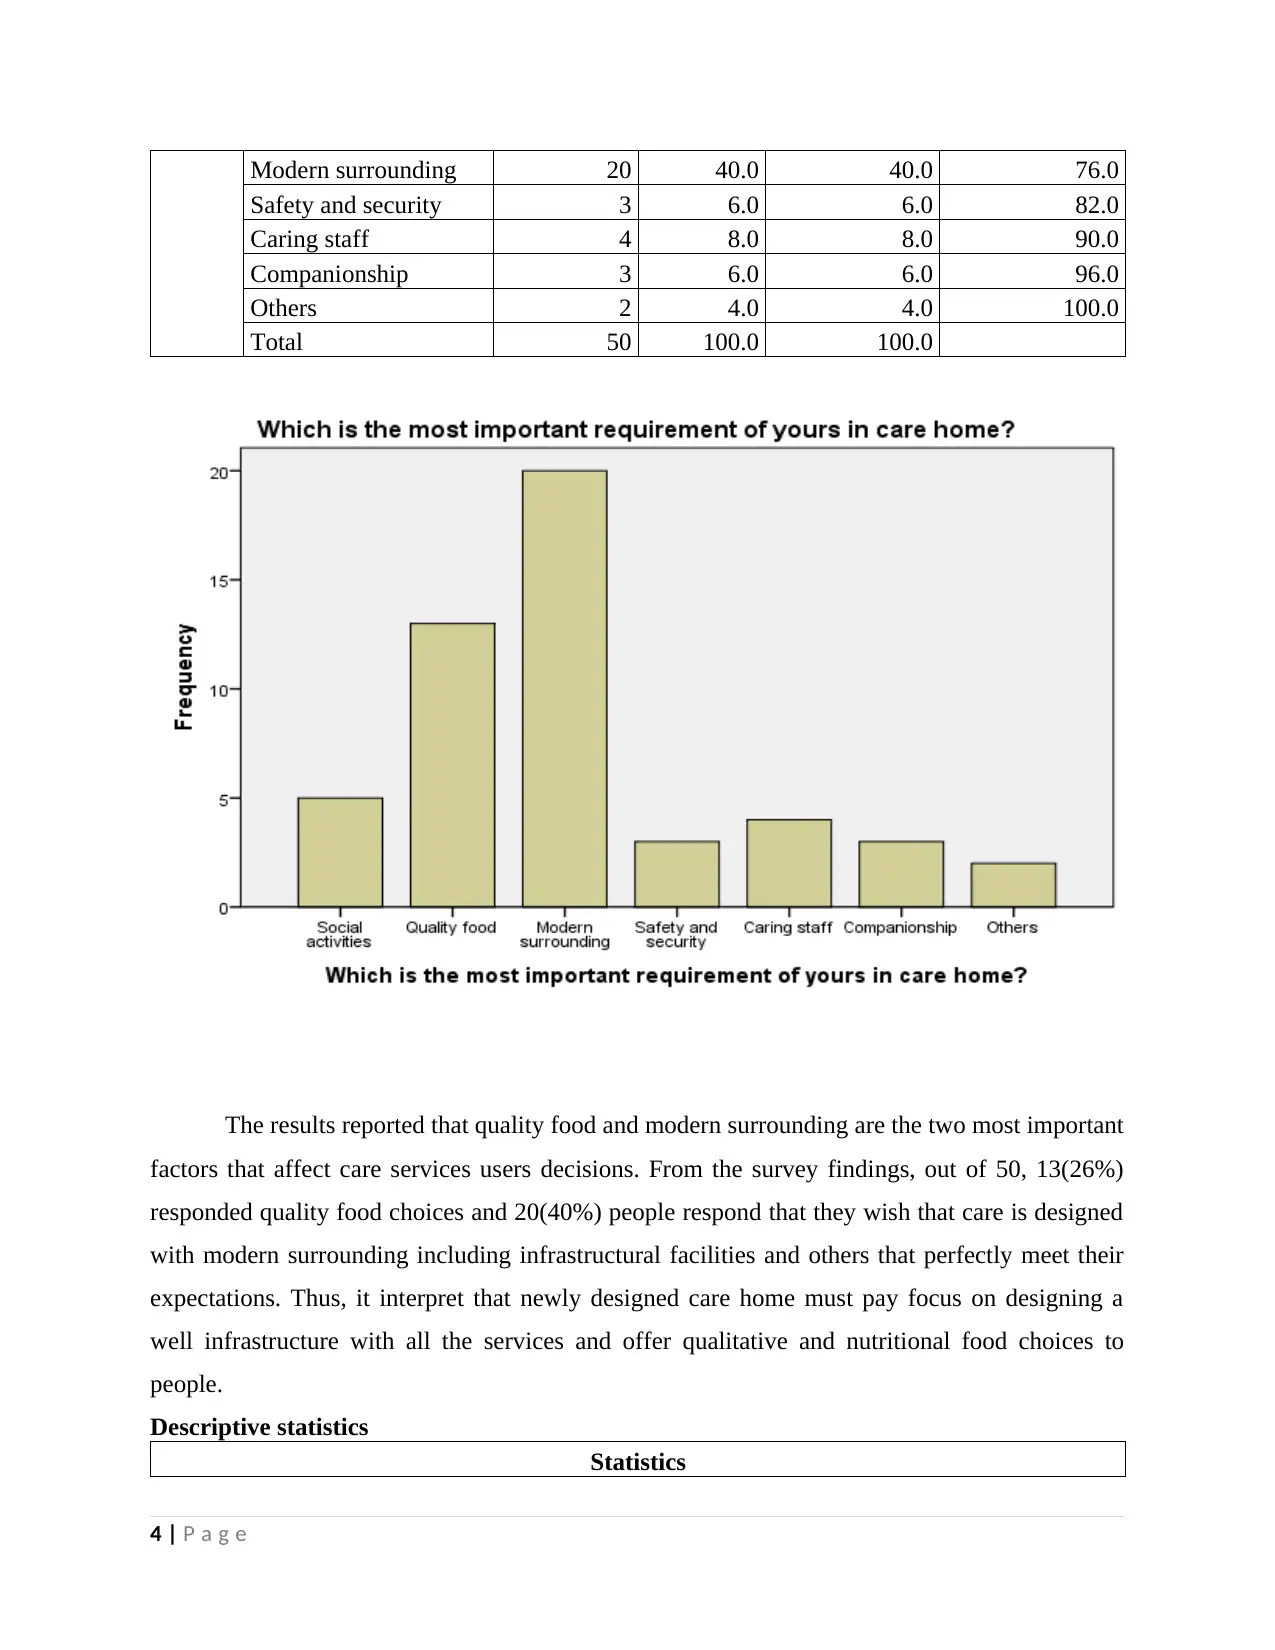
Modern surrounding 20 40.0 40.0 76.0
Safety and security 3 6.0 6.0 82.0
Caring staff 4 8.0 8.0 90.0
Companionship 3 6.0 6.0 96.0
Others 2 4.0 4.0 100.0
Total 50 100.0 100.0
The results reported that quality food and modern surrounding are the two most important
factors that affect care services users decisions. From the survey findings, out of 50, 13(26%)
responded quality food choices and 20(40%) people respond that they wish that care is designed
with modern surrounding including infrastructural facilities and others that perfectly meet their
expectations. Thus, it interpret that newly designed care home must pay focus on designing a
well infrastructure with all the services and offer qualitative and nutritional food choices to
people.
Descriptive statistics
Statistics
4 | P a g e
⊘ This is a preview!⊘
Do you want full access?
Subscribe today to unlock all pages.
Trusted by 1+ million students worldwide
How well do you feel
satisfied with the care
and support services
provided to you?
Q: How would you
like to rate the quality
of life at care home?
Q: Are you currently
offered with the
nutritional food and
beverage facilities at
the care home?
N Valid 50 50 50
Missing 0 0 0
Mean 1.84 2.24 1.94
Median 2.00 2.00 2.00
Mode 1 2 2
Std. Deviation .955 .916 .620
Variance .913 .839 .384
Range 3 4 2
Survey found that majority of people is satisfied with the services they are receiving
currently and rated quality of life just as “Good”. However, as earlier analysis said that
nutritional food is the main factor affecting their decisions. It can be evident through the
findings, in which, majority to people (31 , 62%) responded that they are getting nutritional food
to a very little extent. It shows that the offering nutritional and healthier food choices as per
customer need and expectations are the main requirement needs to be satisfied properly to attract
more proportion of elderly population.
How well do you feel satisfied with the care and support services provided to you?
Frequency Percent Valid Percent Cumulative
Percent
Valid
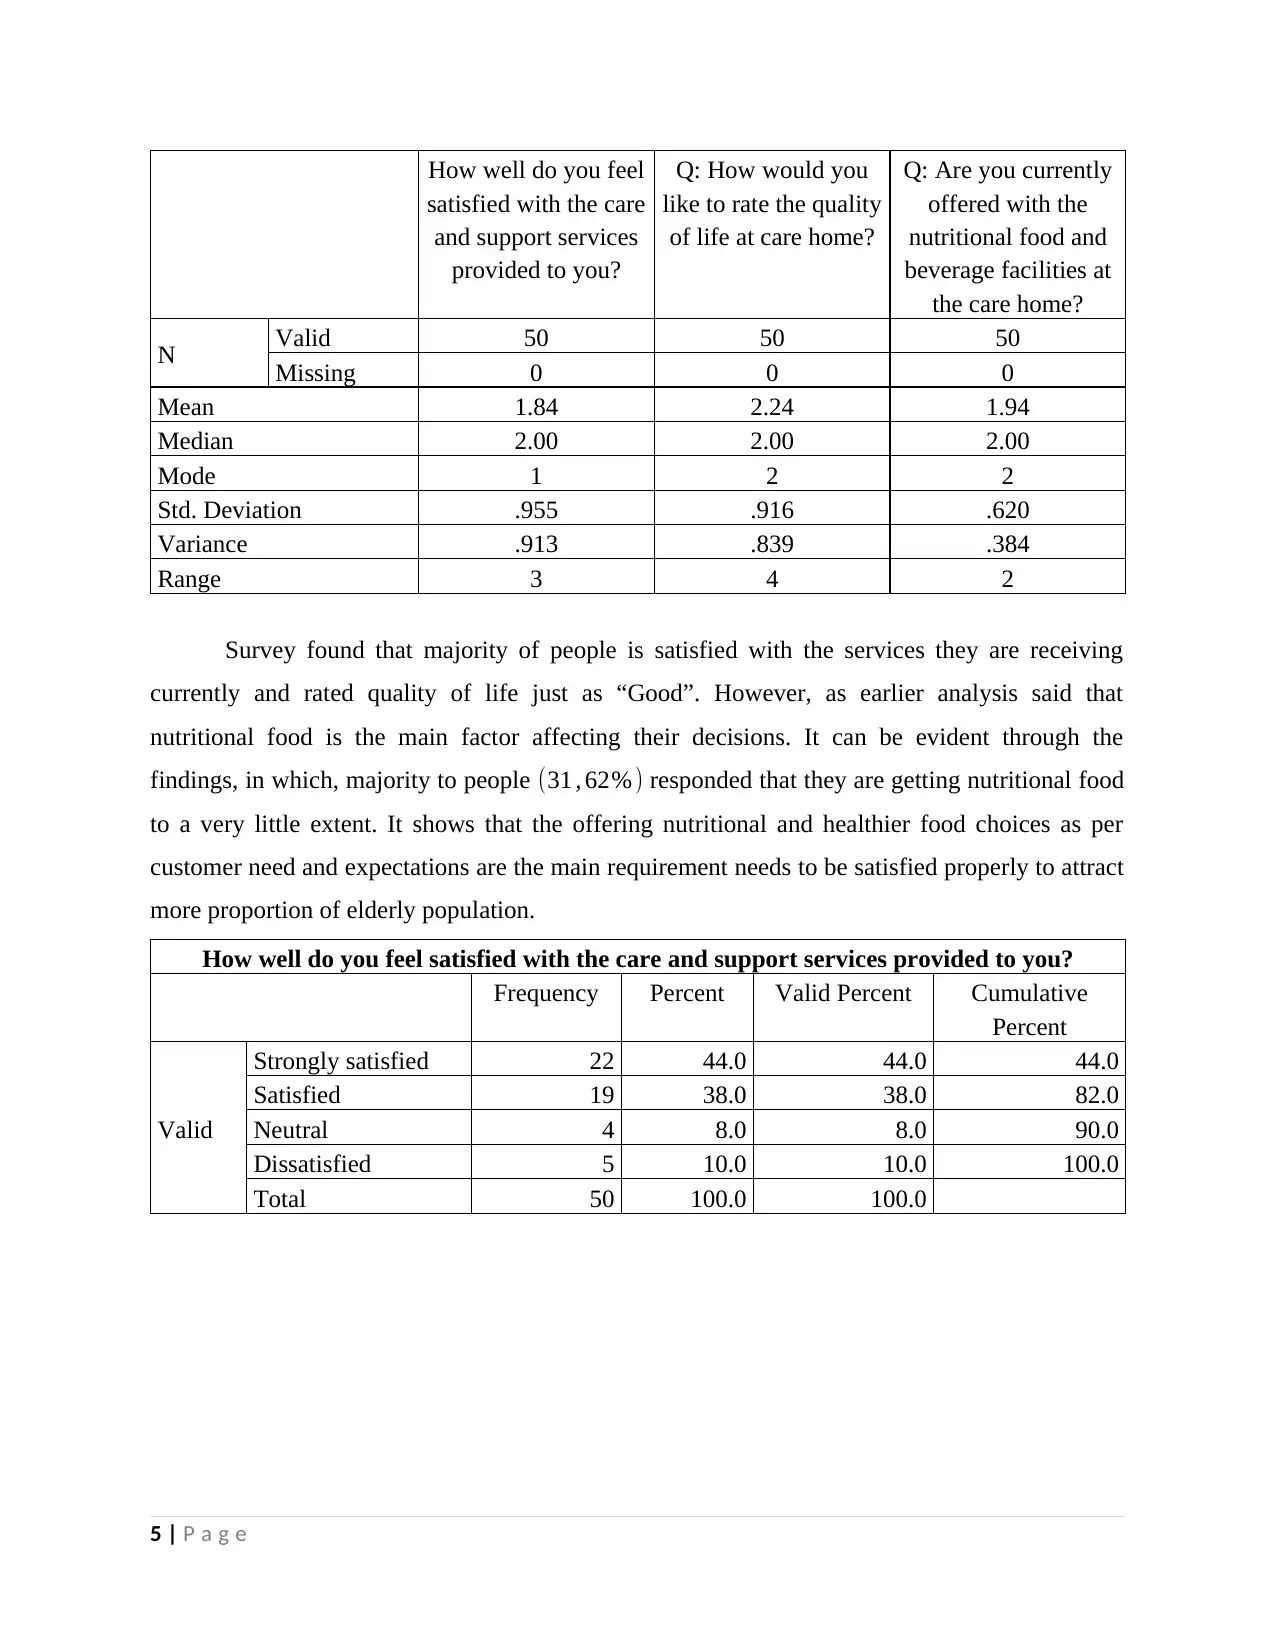
Strongly satisfied 22 44.0 44.0 44.0
Satisfied 19 38.0 38.0 82.0
Neutral 4 8.0 8.0 90.0
Dissatisfied 5 10.0 10.0 100.0
Total 50 100.0 100.0
5 | P a g e
satisfied with the care
and support services
provided to you?
Q: How would you
like to rate the quality
of life at care home?
Q: Are you currently
offered with the
nutritional food and
beverage facilities at
the care home?
N Valid 50 50 50
Missing 0 0 0
Mean 1.84 2.24 1.94
Median 2.00 2.00 2.00
Mode 1 2 2
Std. Deviation .955 .916 .620
Variance .913 .839 .384
Range 3 4 2
Survey found that majority of people is satisfied with the services they are receiving
currently and rated quality of life just as “Good”. However, as earlier analysis said that
nutritional food is the main factor affecting their decisions. It can be evident through the
findings, in which, majority to people (31 , 62%) responded that they are getting nutritional food
to a very little extent. It shows that the offering nutritional and healthier food choices as per
customer need and expectations are the main requirement needs to be satisfied properly to attract
more proportion of elderly population.
How well do you feel satisfied with the care and support services provided to you?
Frequency Percent Valid Percent Cumulative
Percent
Valid
Strongly satisfied 22 44.0 44.0 44.0
Satisfied 19 38.0 38.0 82.0
Neutral 4 8.0 8.0 90.0
Dissatisfied 5 10.0 10.0 100.0
Total 50 100.0 100.0
5 | P a g e
Paraphrase This Document
Need a fresh take? Get an instant paraphrase of this document with our AI Paraphraser
Above bar graph reflects that majority of the audience base (22, 44%) are strongly
satisfied and 19, 38% are just satisfied with the services offered to them, however, only 5(10%)
are dissatisfied.
Q: How would you like to rate the quality of life at care home?
Frequency Percent Valid Percent Cumulative
Percent
Valid
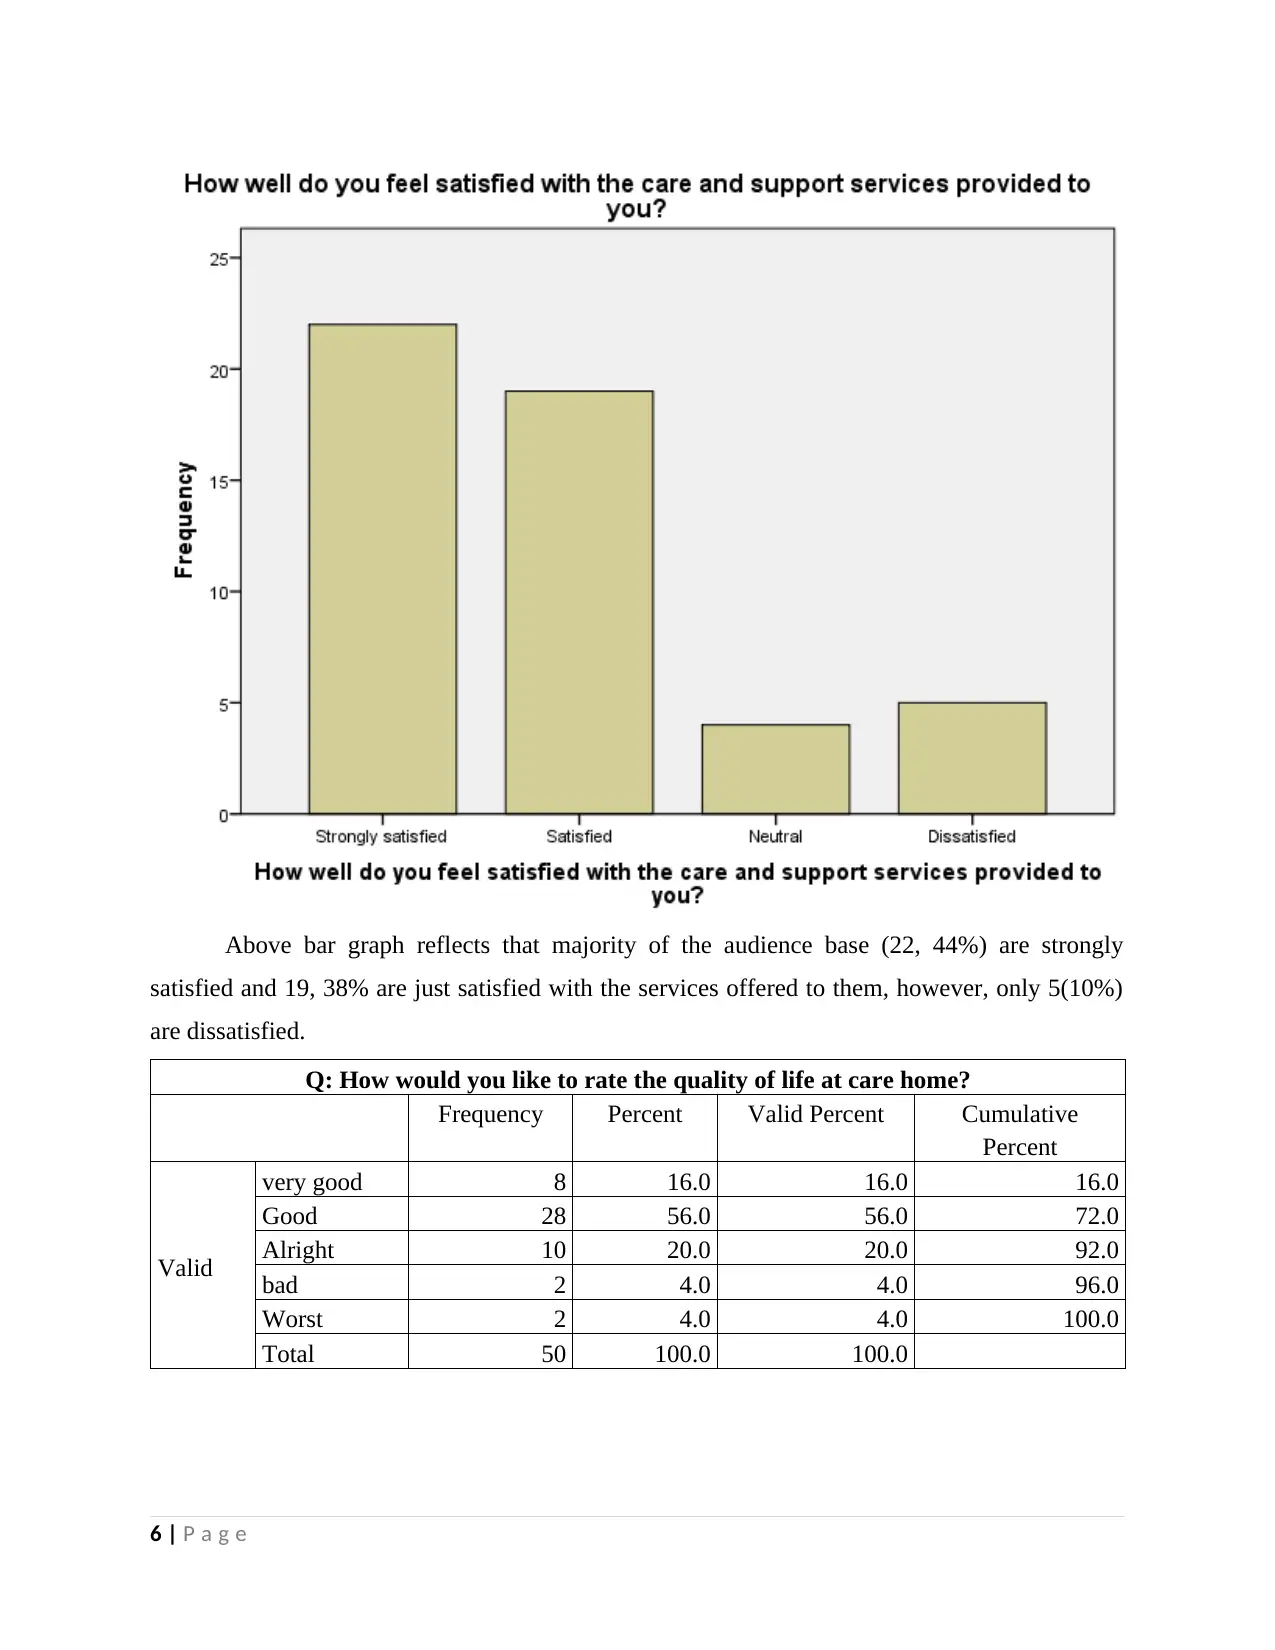
very good 8 16.0 16.0 16.0
Good 28 56.0 56.0 72.0
Alright 10 20.0 20.0 92.0
bad 2 4.0 4.0 96.0
Worst 2 4.0 4.0 100.0
Total 50 100.0 100.0
6 | P a g e
satisfied and 19, 38% are just satisfied with the services offered to them, however, only 5(10%)
are dissatisfied.
Q: How would you like to rate the quality of life at care home?
Frequency Percent Valid Percent Cumulative
Percent
Valid
very good 8 16.0 16.0 16.0
Good 28 56.0 56.0 72.0
Alright 10 20.0 20.0 92.0
bad 2 4.0 4.0 96.0
Worst 2 4.0 4.0 100.0
Total 50 100.0 100.0
6 | P a g e
Majority of surveyed people (28, 56%) rated their quality of life at care home to “Good”
and very little number of people rated it as “very good”. It may be possible because, few of their
choices and preferences are perfectly satisfied while others are not well-satisfied and resultant
dissatisfaction among people.
Q: Are you currently offered with the nutritional food and beverage facilities at the care
home?
Frequency Percent Valid Percent Cumulative
Percent
Valid
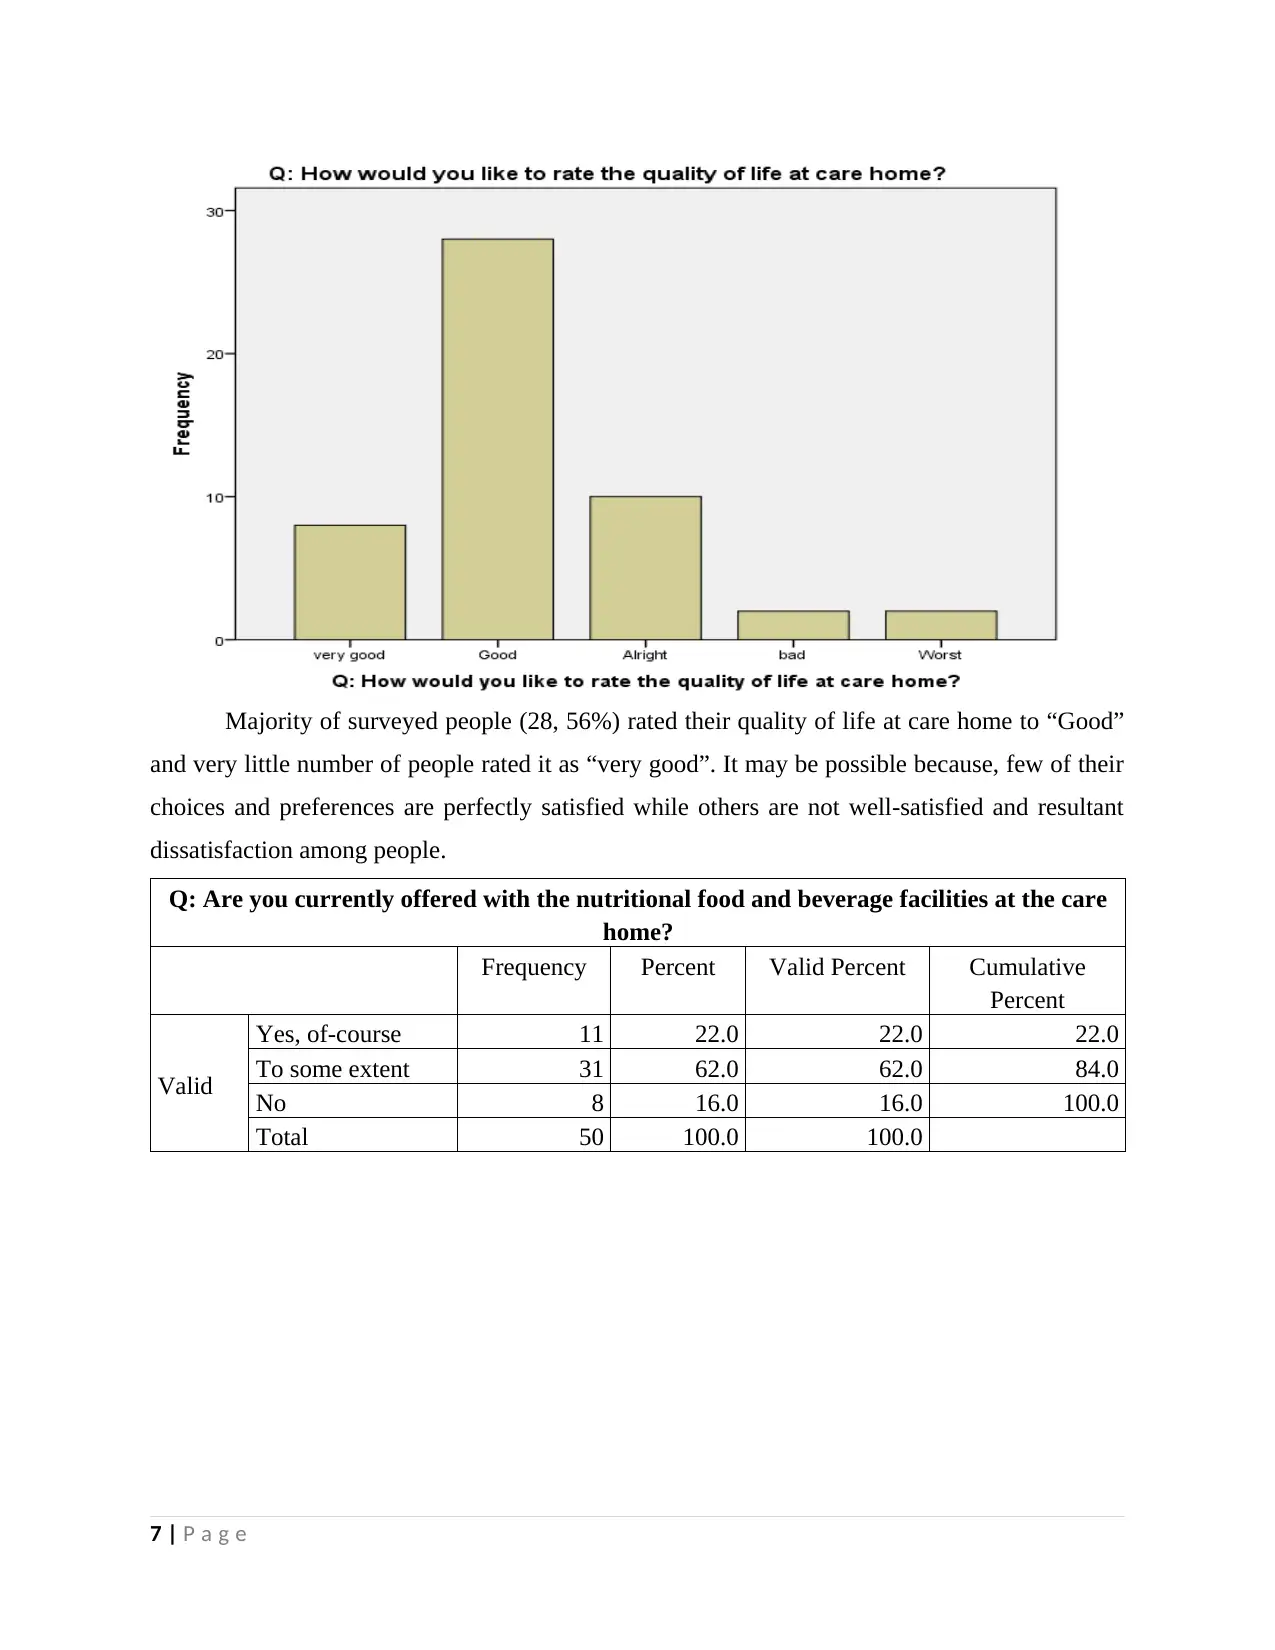
Yes, of-course 11 22.0 22.0 22.0
To some extent 31 62.0 62.0 84.0
No 8 16.0 16.0 100.0
Total 50 100.0 100.0
7 | P a g e
and very little number of people rated it as “very good”. It may be possible because, few of their
choices and preferences are perfectly satisfied while others are not well-satisfied and resultant
dissatisfaction among people.
Q: Are you currently offered with the nutritional food and beverage facilities at the care
home?
Frequency Percent Valid Percent Cumulative
Percent
Valid
Yes, of-course 11 22.0 22.0 22.0
To some extent 31 62.0 62.0 84.0
No 8 16.0 16.0 100.0
Total 50 100.0 100.0
7 | P a g e
⊘ This is a preview!⊘
Do you want full access?
Subscribe today to unlock all pages.
Trusted by 1+ million students worldwide
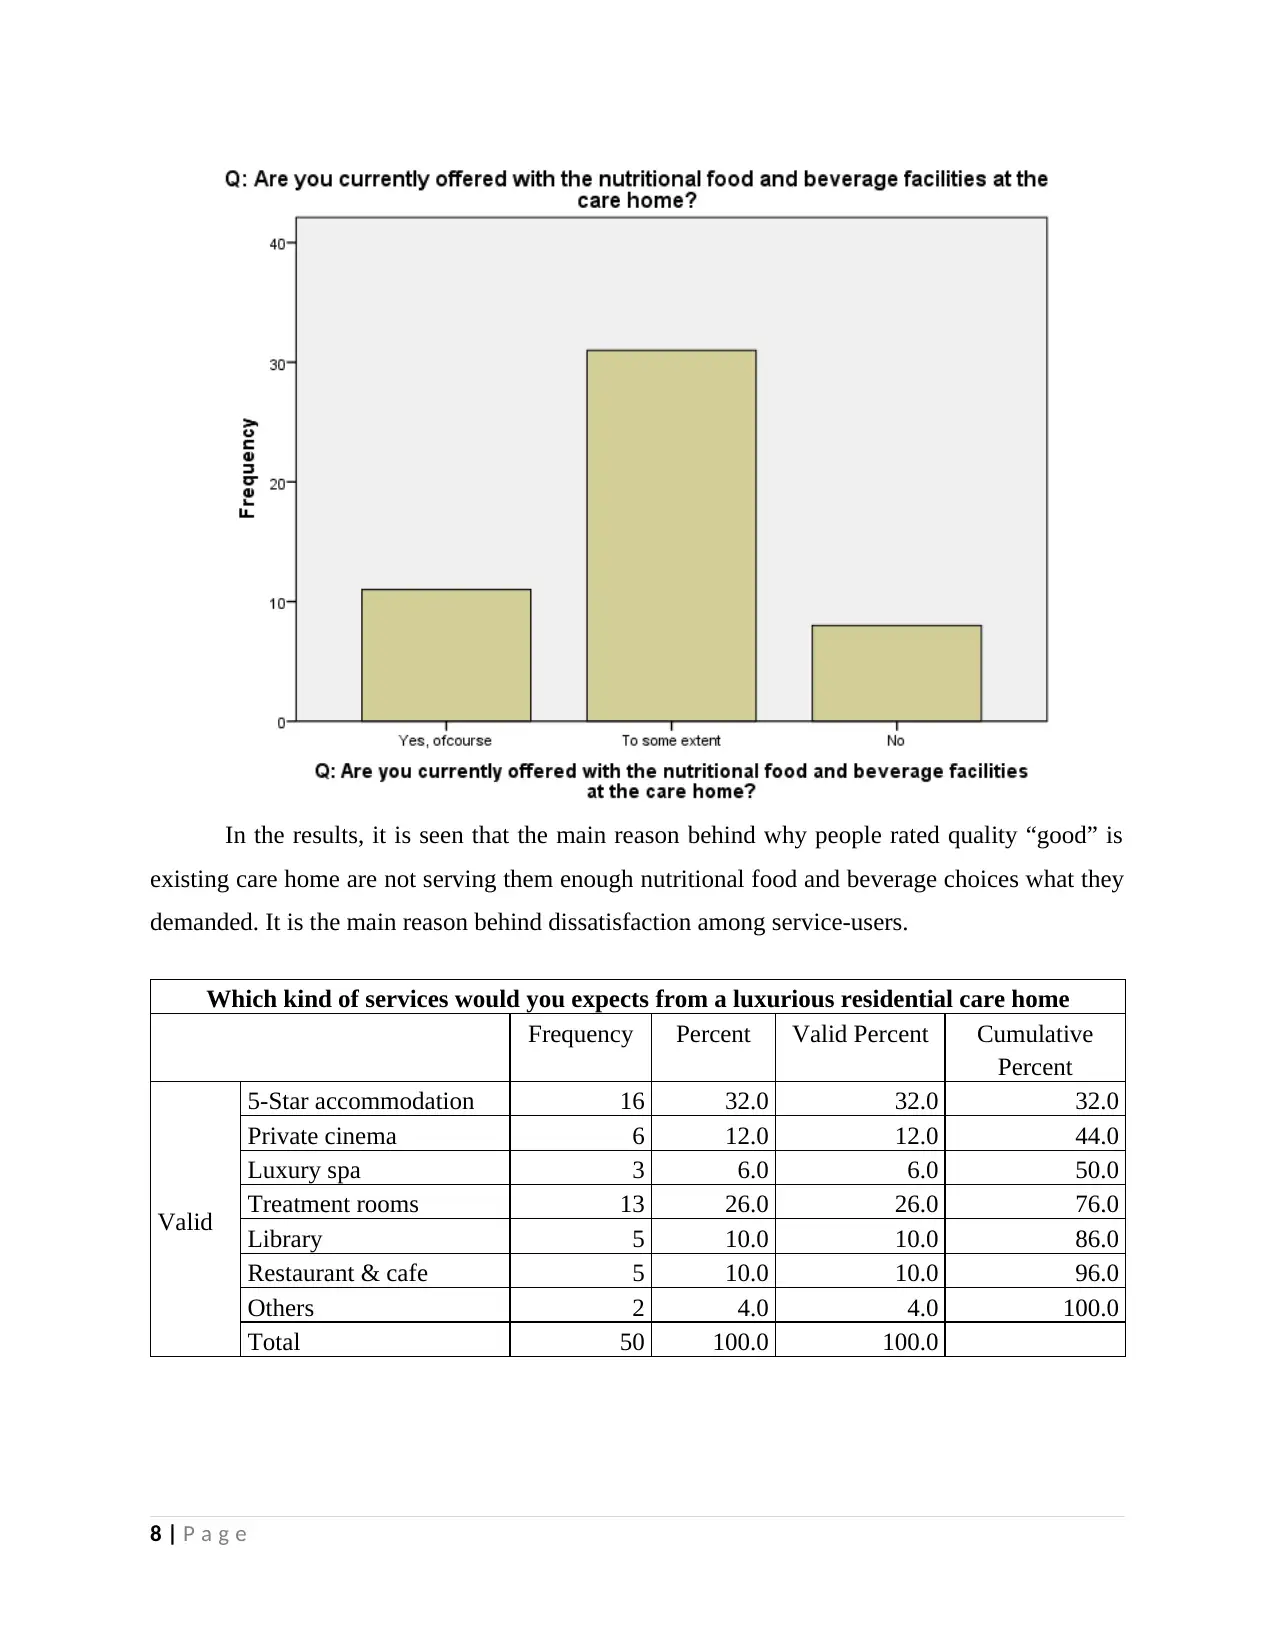
In the results, it is seen that the main reason behind why people rated quality “good” is
existing care home are not serving them enough nutritional food and beverage choices what they
demanded. It is the main reason behind dissatisfaction among service-users.
Which kind of services would you expects from a luxurious residential care home
Frequency Percent Valid Percent Cumulative
Percent
Valid
5-Star accommodation 16 32.0 32.0 32.0
Private cinema 6 12.0 12.0 44.0
Luxury spa 3 6.0 6.0 50.0
Treatment rooms 13 26.0 26.0 76.0
Library 5 10.0 10.0 86.0
Restaurant & cafe 5 10.0 10.0 96.0
Others 2 4.0 4.0 100.0
Total 50 100.0 100.0
8 | P a g e
Paraphrase This Document
Need a fresh take? Get an instant paraphrase of this document with our AI Paraphraser
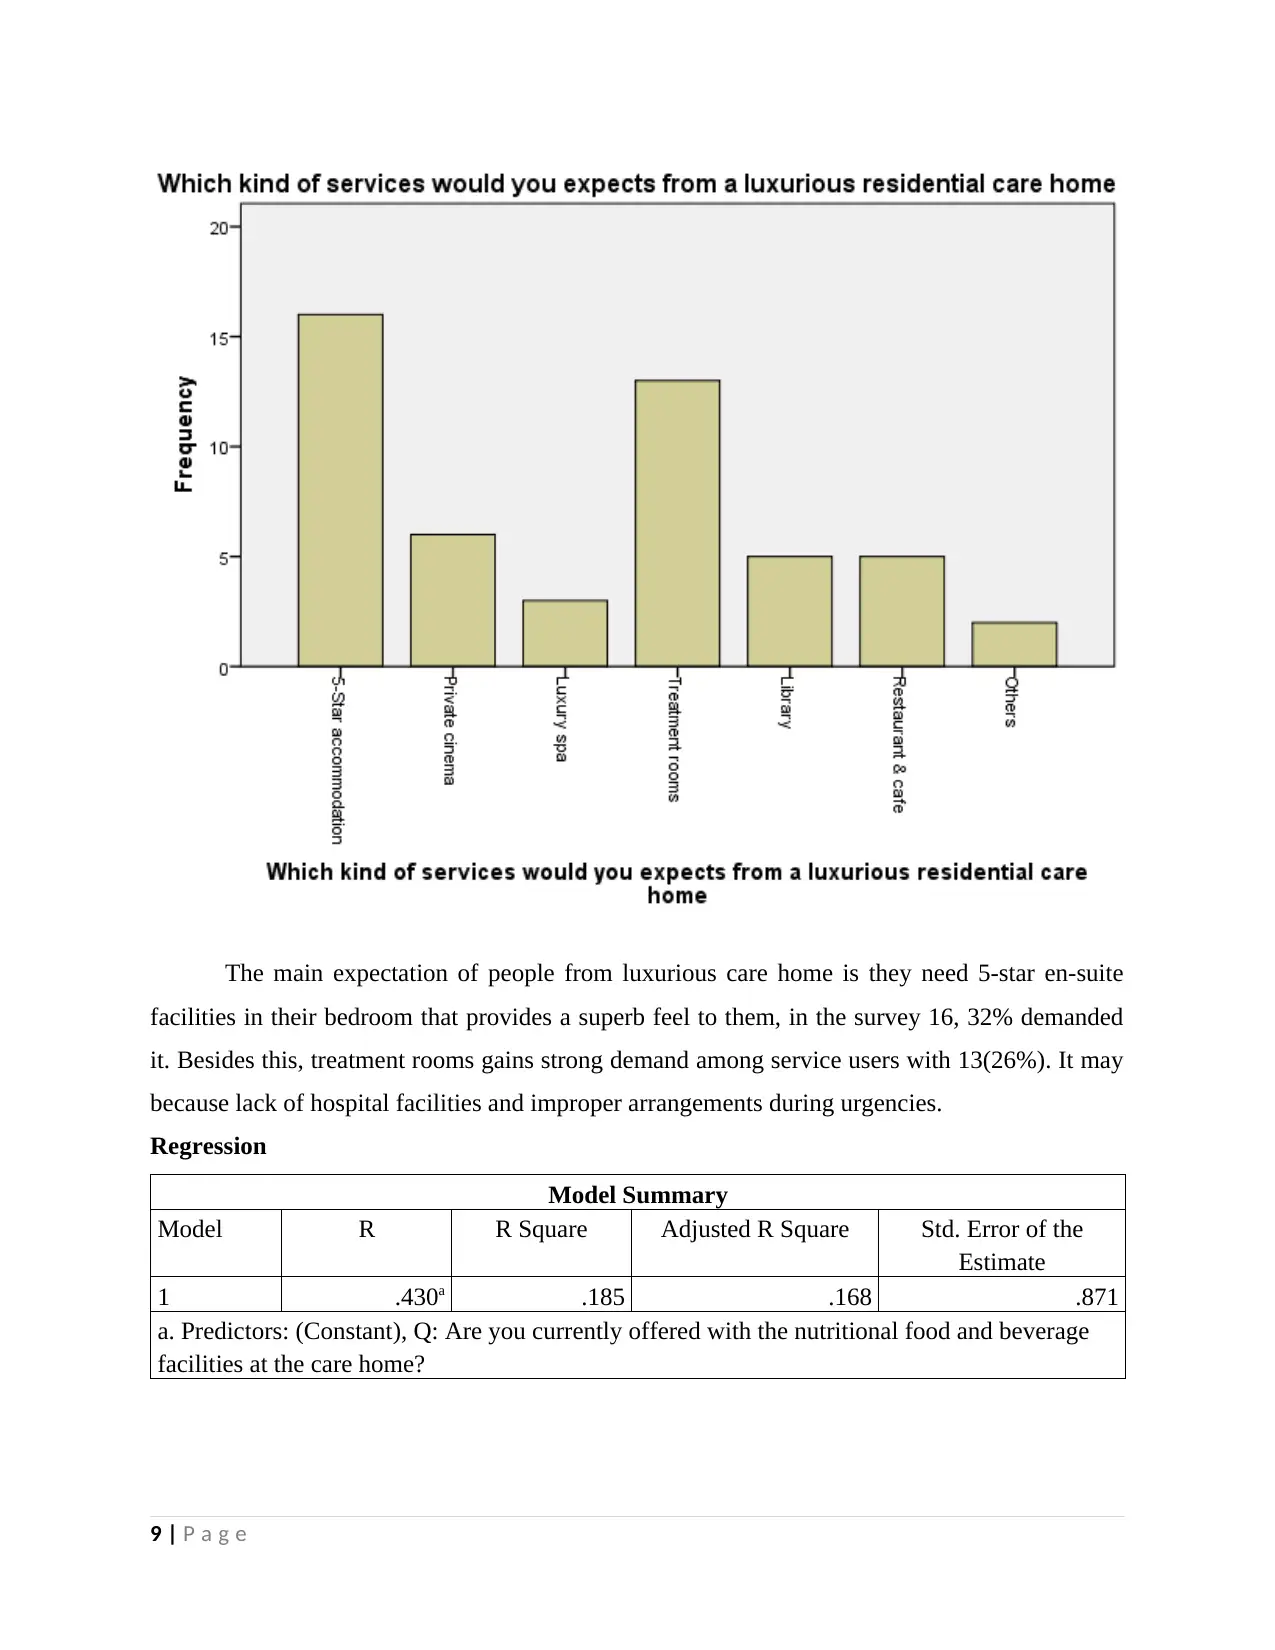
The main expectation of people from luxurious care home is they need 5-star en-suite
facilities in their bedroom that provides a superb feel to them, in the survey 16, 32% demanded
it. Besides this, treatment rooms gains strong demand among service users with 13(26%). It may
because lack of hospital facilities and improper arrangements during urgencies.
Regression
Model Summary
Model R R Square Adjusted R Square Std. Error of the
Estimate
1 .430a .185 .168 .871
a. Predictors: (Constant), Q: Are you currently offered with the nutritional food and beverage
facilities at the care home?
9 | P a g e
Nutritional food and service availability has moderate relationship with the satisfaction
level of the users at a correlation of 0.430. Thus, it can be suggest that by offering quality and
healthier food choices, residential care homes can satisfy people accordingly.
ANOVAa
Model Sum of Squares df Mean Square F Sig.
1
Regression 8.276 1 8.276 10.900 .002b
Residual 36.444 48 .759
Total 44.720 49
a. Dependent Variable: How well do you feel satisfied with the care and support services
provided to you?
b. Predictors: (Constant), Q: Are you currently offered with the nutritional food and beverage
facilities at the care home?
Coefficientsa
Model Unstandardized
Coefficients
Standardized
Coefficients
t Sig.
B Std. Error Beta
1
(Constant) 3.126 .409 7.650 .000
Q: Are you currently
offered with the
nutritional food and
beverage facilities at
the care home?
-.663 .201 -.430 -3.301 .002
a. Dependent Variable: How well do you feel satisfied with the care and support services
provided to you?
According to the “ANOVA” results, sig. value is 0.002 that is below 0.005 shows that
availability of tailored and customized food deliveries influence individual to a major extent. If
people are able to get nutritional, food and beverage, any time whenever they need, then, they
will really feel satisfy and enable entity to achieve growth.
IDENTIFICATION
The new Luxury Residential Care Home in Cambridgeshire will be a five-star residential
care home with luxurious settings which provide a feel to residential as if they are living at their
own home. The care home bedrooms will be designed with the en-suite facilities, enough spaces,
private gardens and peaceful surrounding to provide really an amazing feel to the residents.
Serving people with the superb accommodation and food facilities will enable entity to satisfy all
10 | P a g e
⊘ This is a preview!⊘
Do you want full access?
Subscribe today to unlock all pages.
Trusted by 1+ million students worldwide
1 out of 24
Related Documents


Your All-in-One AI-Powered Toolkit for Academic Success.
+13062052269
info@desklib.com
Available 24*7 on WhatsApp / Email
![[object Object]](/_next/static/media/star-bottom.7253800d.svg)
Unlock your academic potential
Copyright © 2020–2026 A2Z Services. All Rights Reserved. Developed and managed by ZUCOL.