University Research Project: Climate Change and Business Strategies
VerifiedAdded on 2020/05/11
|18
|4005
|735
Report
AI Summary
This research project investigates the relationship between integrating climate change strategies in businesses and their voluntary disclosure scores on the CDP survey. The study formulates a null and alternative hypothesis, analyzing data from 60 companies, using inferential data analysis and SPSS to test the hypothesis. The research examines descriptive statistics, including mean, median, mode, skewness, and kurtosis, and presents bin data and plots to understand data distribution. The report also conducts a paired samples t-test and discusses the findings in relation to agency theory, exploring potential conflicts of interest in adopting sustainable business models. The project aims to determine if there is a significant relationship between a company's climate change strategy integration and its willingness to disclose related information, offering insights into the impact of climate change on business practices and environmental responsibility.
Running head: RESEARCH PROJECT
Research Project: Hypothesis Testing
Name of the Student:
Name of the University:
Author note:
Research Project: Hypothesis Testing
Name of the Student:
Name of the University:
Author note:
Paraphrase This Document
Need a fresh take? Get an instant paraphrase of this document with our AI Paraphraser
1RESEARCH PROJECT
Hypothesis testing
The purpose of this research paper is to test a hypothesis if it is right or wrong. A
hypothesis represents a particular statement for forecasting. It represents the expectation from a
study. It helps in assessing a situation in the field of research and through data analysis, the result
should be tested. Depending on the probability value, the hypothesis is ether accepted or rejected
(Murphy, Myors and Wolach 2014). The hypothesis is designed through many ways, but it is
usually a process of inductive reasoning, where observations results in the formation of a theory.
Through many deductive methods, the hypotheses are tested for acceptance or rejection. This
testifies the result of the research study. Testing of hypothesis always includes one null
hypothesis and an alternative hypothesis. The null hypothesis refers to the situation to be tested.
The alternative hypothesis is the opposite result in case the null hypothesis does not hold true
(Barr et al. 2013).
In this case, the hypothesis to be tested is as follows:
H0: there is no significant relationship between an integration of climate change in the business
and voluntary disclosure score on the cdp survey (null hypothesis).
H1: there is significant relationship between an integration of climate change in the business and
voluntary disclosure score on the cdp survey. That means H1 is accepted (p value)
Here, H0 is the null hypothesis and H1 is the alternative hypothesis. The objective is to find out
the relation between integration of climate change strategy in the business and the voluntary
disclosure score of the businesses on the CDP survey. The survey was conducted to know the
status of the businesses whether they have integrated any climate change strategy in their
businesses and if they are disclosing it.
2RESEARCH PROJECT
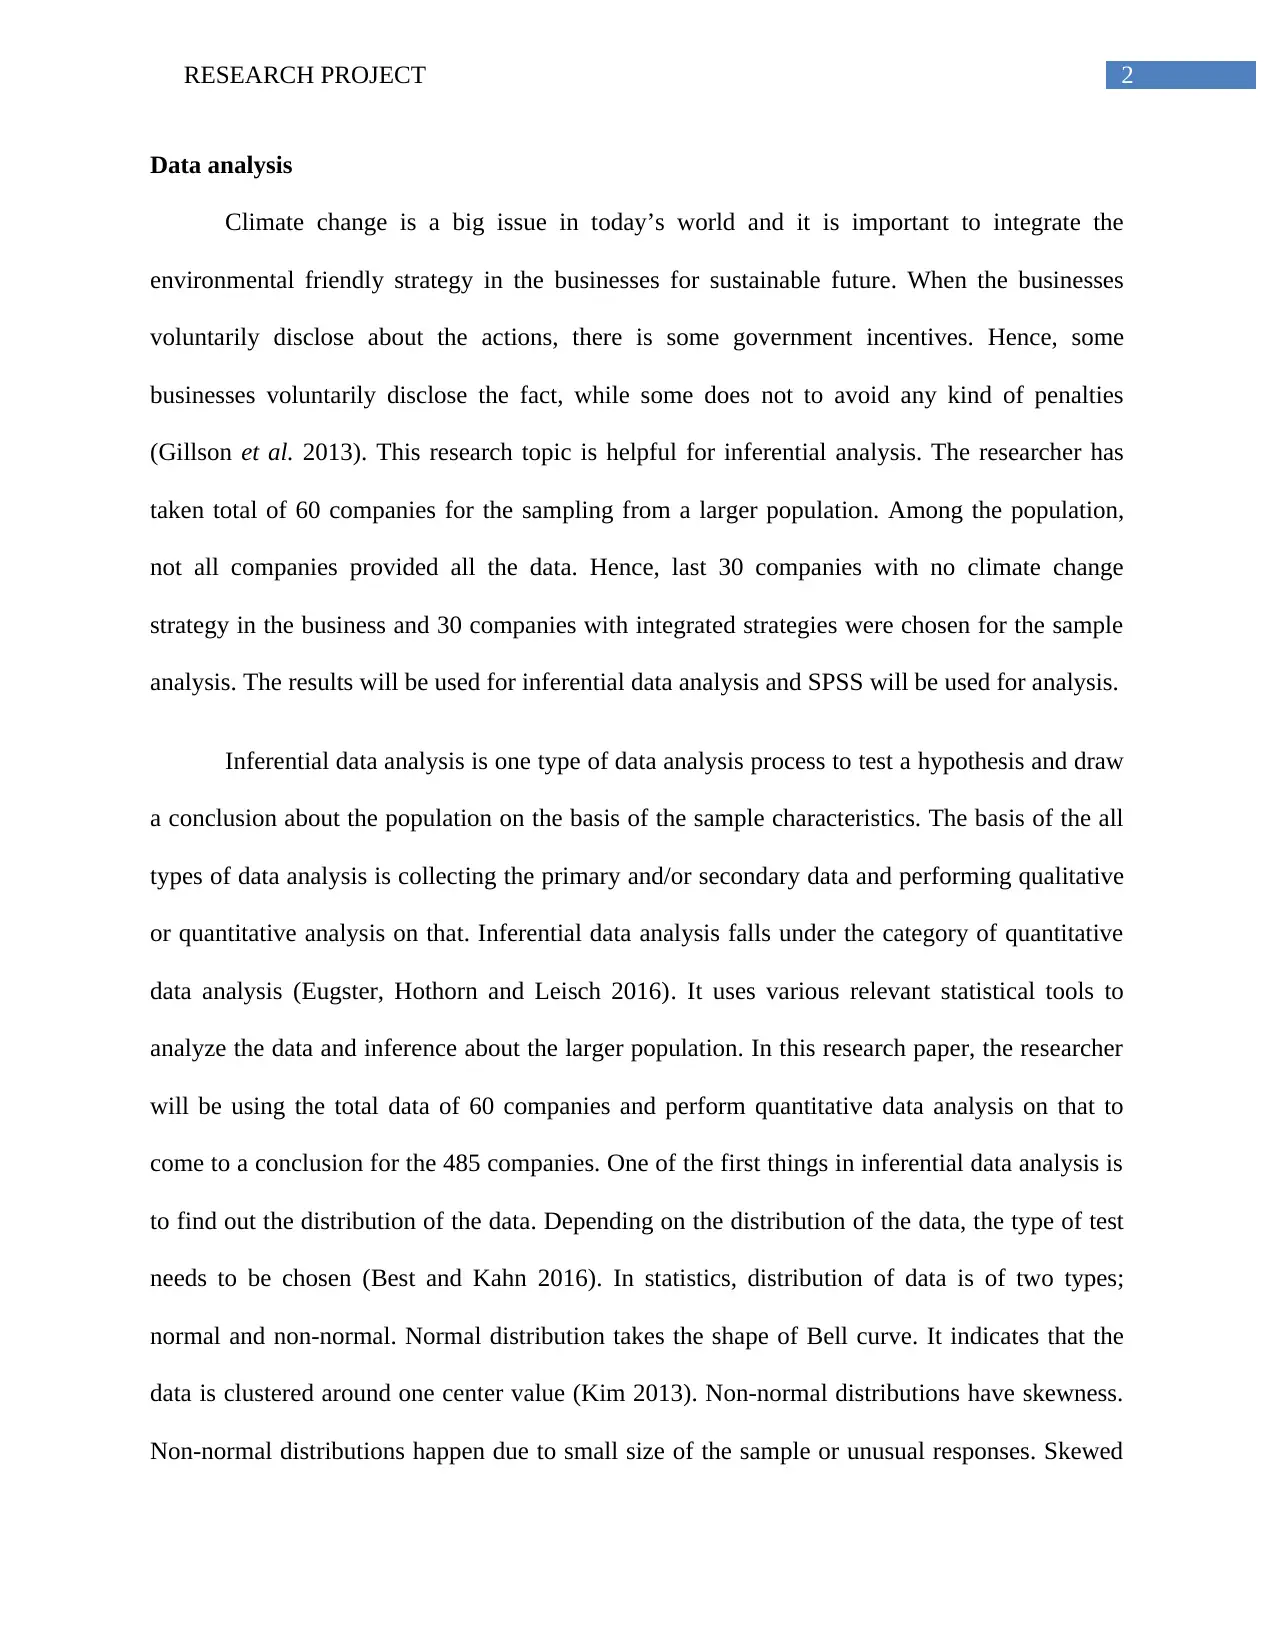
Data analysis
Climate change is a big issue in today’s world and it is important to integrate the
environmental friendly strategy in the businesses for sustainable future. When the businesses
voluntarily disclose about the actions, there is some government incentives. Hence, some
businesses voluntarily disclose the fact, while some does not to avoid any kind of penalties
(Gillson et al. 2013). This research topic is helpful for inferential analysis. The researcher has
taken total of 60 companies for the sampling from a larger population. Among the population,
not all companies provided all the data. Hence, last 30 companies with no climate change
strategy in the business and 30 companies with integrated strategies were chosen for the sample
analysis. The results will be used for inferential data analysis and SPSS will be used for analysis.
Inferential data analysis is one type of data analysis process to test a hypothesis and draw
a conclusion about the population on the basis of the sample characteristics. The basis of the all
types of data analysis is collecting the primary and/or secondary data and performing qualitative
or quantitative analysis on that. Inferential data analysis falls under the category of quantitative
data analysis (Eugster, Hothorn and Leisch 2016). It uses various relevant statistical tools to
analyze the data and inference about the larger population. In this research paper, the researcher
will be using the total data of 60 companies and perform quantitative data analysis on that to
come to a conclusion for the 485 companies. One of the first things in inferential data analysis is
to find out the distribution of the data. Depending on the distribution of the data, the type of test
needs to be chosen (Best and Kahn 2016). In statistics, distribution of data is of two types;
normal and non-normal. Normal distribution takes the shape of Bell curve. It indicates that the
data is clustered around one center value (Kim 2013). Non-normal distributions have skewness.
Non-normal distributions happen due to small size of the sample or unusual responses. Skewed
⊘ This is a preview!⊘
Do you want full access?
Subscribe today to unlock all pages.
Trusted by 1+ million students worldwide
3RESEARCH PROJECT
data is the main reason for non-normal distribution. The data can be positively or negatively
skewed. When the data is skewed towards the right, it is negatively skewed and when it is
skewed towards the left, it is positively skewed. Kurtosis is another attribute of non-normal
distribution. It represents the peakness of the data. It says if the data is too peaked or too flat
(Vdorhees 2017).
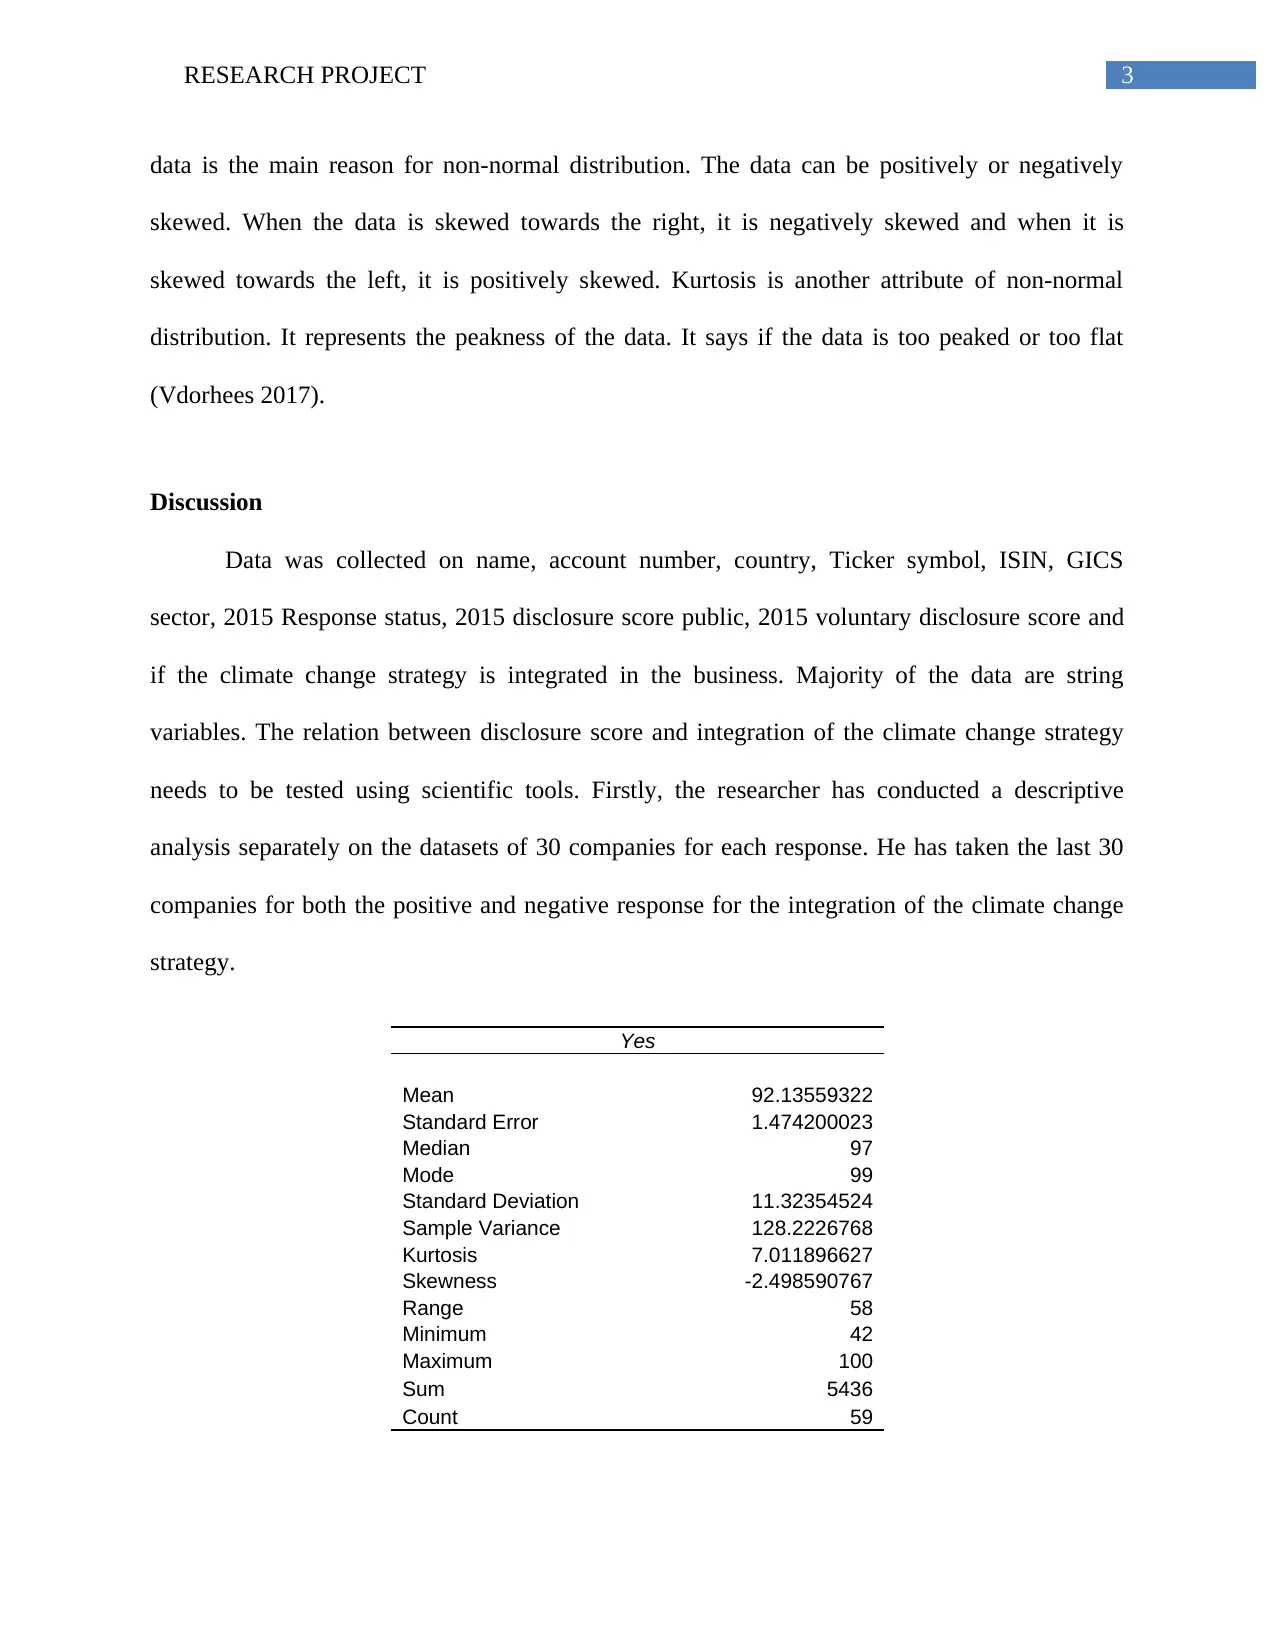
Discussion
Data was collected on name, account number, country, Ticker symbol, ISIN, GICS
sector, 2015 Response status, 2015 disclosure score public, 2015 voluntary disclosure score and
if the climate change strategy is integrated in the business. Majority of the data are string
variables. The relation between disclosure score and integration of the climate change strategy
needs to be tested using scientific tools. Firstly, the researcher has conducted a descriptive
analysis separately on the datasets of 30 companies for each response. He has taken the last 30
companies for both the positive and negative response for the integration of the climate change
strategy.
Yes
Mean 92.13559322
Standard Error 1.474200023
Median 97
Mode 99
Standard Deviation 11.32354524
Sample Variance 128.2226768
Kurtosis 7.011896627
Skewness -2.498590767
Range 58
Minimum 42
Maximum 100
Sum 5436
Count 59
data is the main reason for non-normal distribution. The data can be positively or negatively
skewed. When the data is skewed towards the right, it is negatively skewed and when it is
skewed towards the left, it is positively skewed. Kurtosis is another attribute of non-normal
distribution. It represents the peakness of the data. It says if the data is too peaked or too flat
(Vdorhees 2017).
Discussion
Data was collected on name, account number, country, Ticker symbol, ISIN, GICS
sector, 2015 Response status, 2015 disclosure score public, 2015 voluntary disclosure score and
if the climate change strategy is integrated in the business. Majority of the data are string
variables. The relation between disclosure score and integration of the climate change strategy
needs to be tested using scientific tools. Firstly, the researcher has conducted a descriptive
analysis separately on the datasets of 30 companies for each response. He has taken the last 30
companies for both the positive and negative response for the integration of the climate change
strategy.
Yes
Mean 92.13559322
Standard Error 1.474200023
Median 97
Mode 99
Standard Deviation 11.32354524
Sample Variance 128.2226768
Kurtosis 7.011896627
Skewness -2.498590767
Range 58
Minimum 42
Maximum 100
Sum 5436
Count 59
Paraphrase This Document
Need a fresh take? Get an instant paraphrase of this document with our AI Paraphraser
4RESEARCH PROJECT
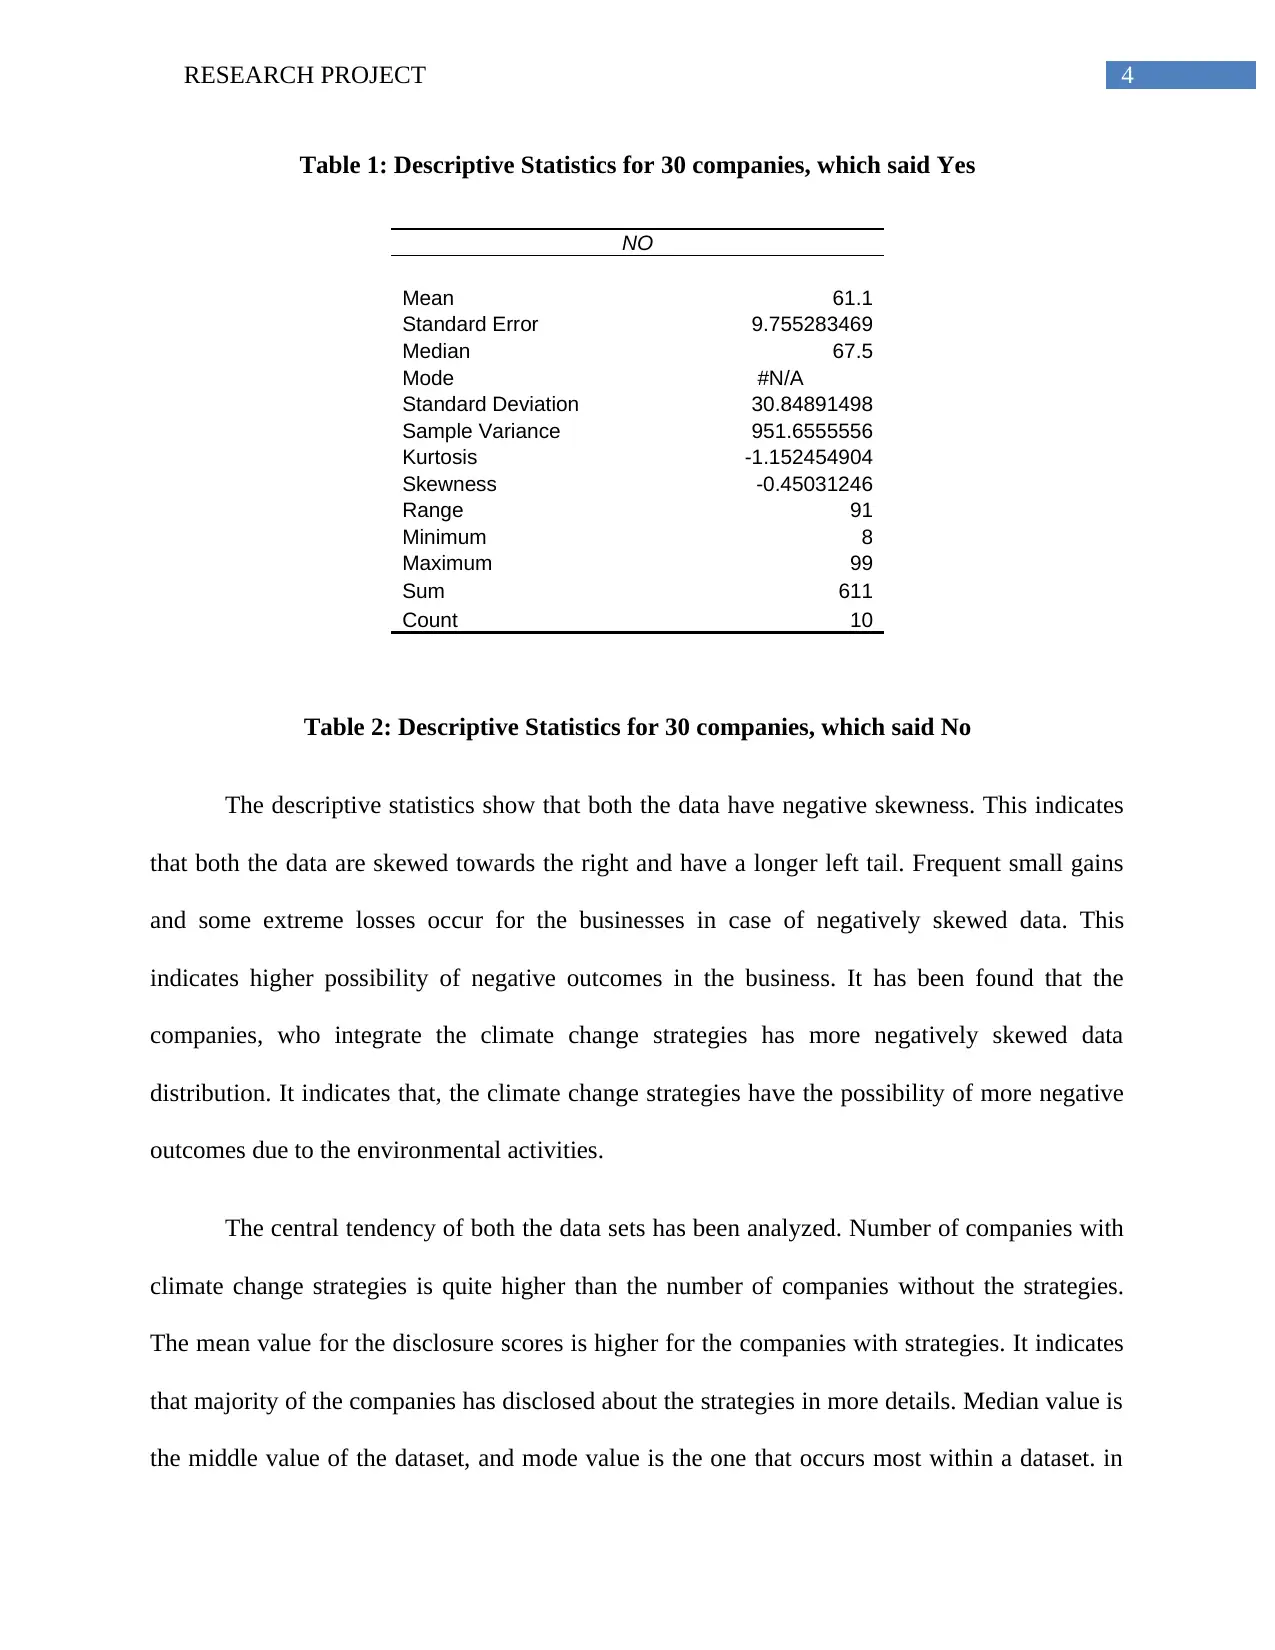
Table 1: Descriptive Statistics for 30 companies, which said Yes
NO
Mean 61.1
Standard Error 9.755283469
Median 67.5
Mode #N/A
Standard Deviation 30.84891498
Sample Variance 951.6555556
Kurtosis -1.152454904
Skewness -0.45031246
Range 91
Minimum 8
Maximum 99
Sum 611
Count 10
Table 2: Descriptive Statistics for 30 companies, which said No
The descriptive statistics show that both the data have negative skewness. This indicates
that both the data are skewed towards the right and have a longer left tail. Frequent small gains
and some extreme losses occur for the businesses in case of negatively skewed data. This
indicates higher possibility of negative outcomes in the business. It has been found that the
companies, who integrate the climate change strategies has more negatively skewed data
distribution. It indicates that, the climate change strategies have the possibility of more negative
outcomes due to the environmental activities.
The central tendency of both the data sets has been analyzed. Number of companies with
climate change strategies is quite higher than the number of companies without the strategies.
The mean value for the disclosure scores is higher for the companies with strategies. It indicates
that majority of the companies has disclosed about the strategies in more details. Median value is
the middle value of the dataset, and mode value is the one that occurs most within a dataset. in
5RESEARCH PROJECT
this case, both the median and mode values are higher for the companies who agreed to have
climate change strategies (Barato and Seifert 2015).
Kurtosis refers to the degree of peak of a data distribution. With a value of 3, kurtosis
represents a normal distribution of the data. If the value is less than 3, it is flatter and if more
than 3, the data has excess peak. In case of companies with climate change strategies has a
kurtosis value of 7 and the other category has a value of -1. Hence, the companies with climate
change strategies has peak in the disclosure data, and companies without climate change
strategies has a flatter curve for disclosure data. With a positive kurtosis value, the distribution
has heavier tails. The sample size affects the kurtosis value. The kurtosis values in the above
tables show that, response values have heavier tails for the companies with climate change
strategy (Blanca et al. 2013).
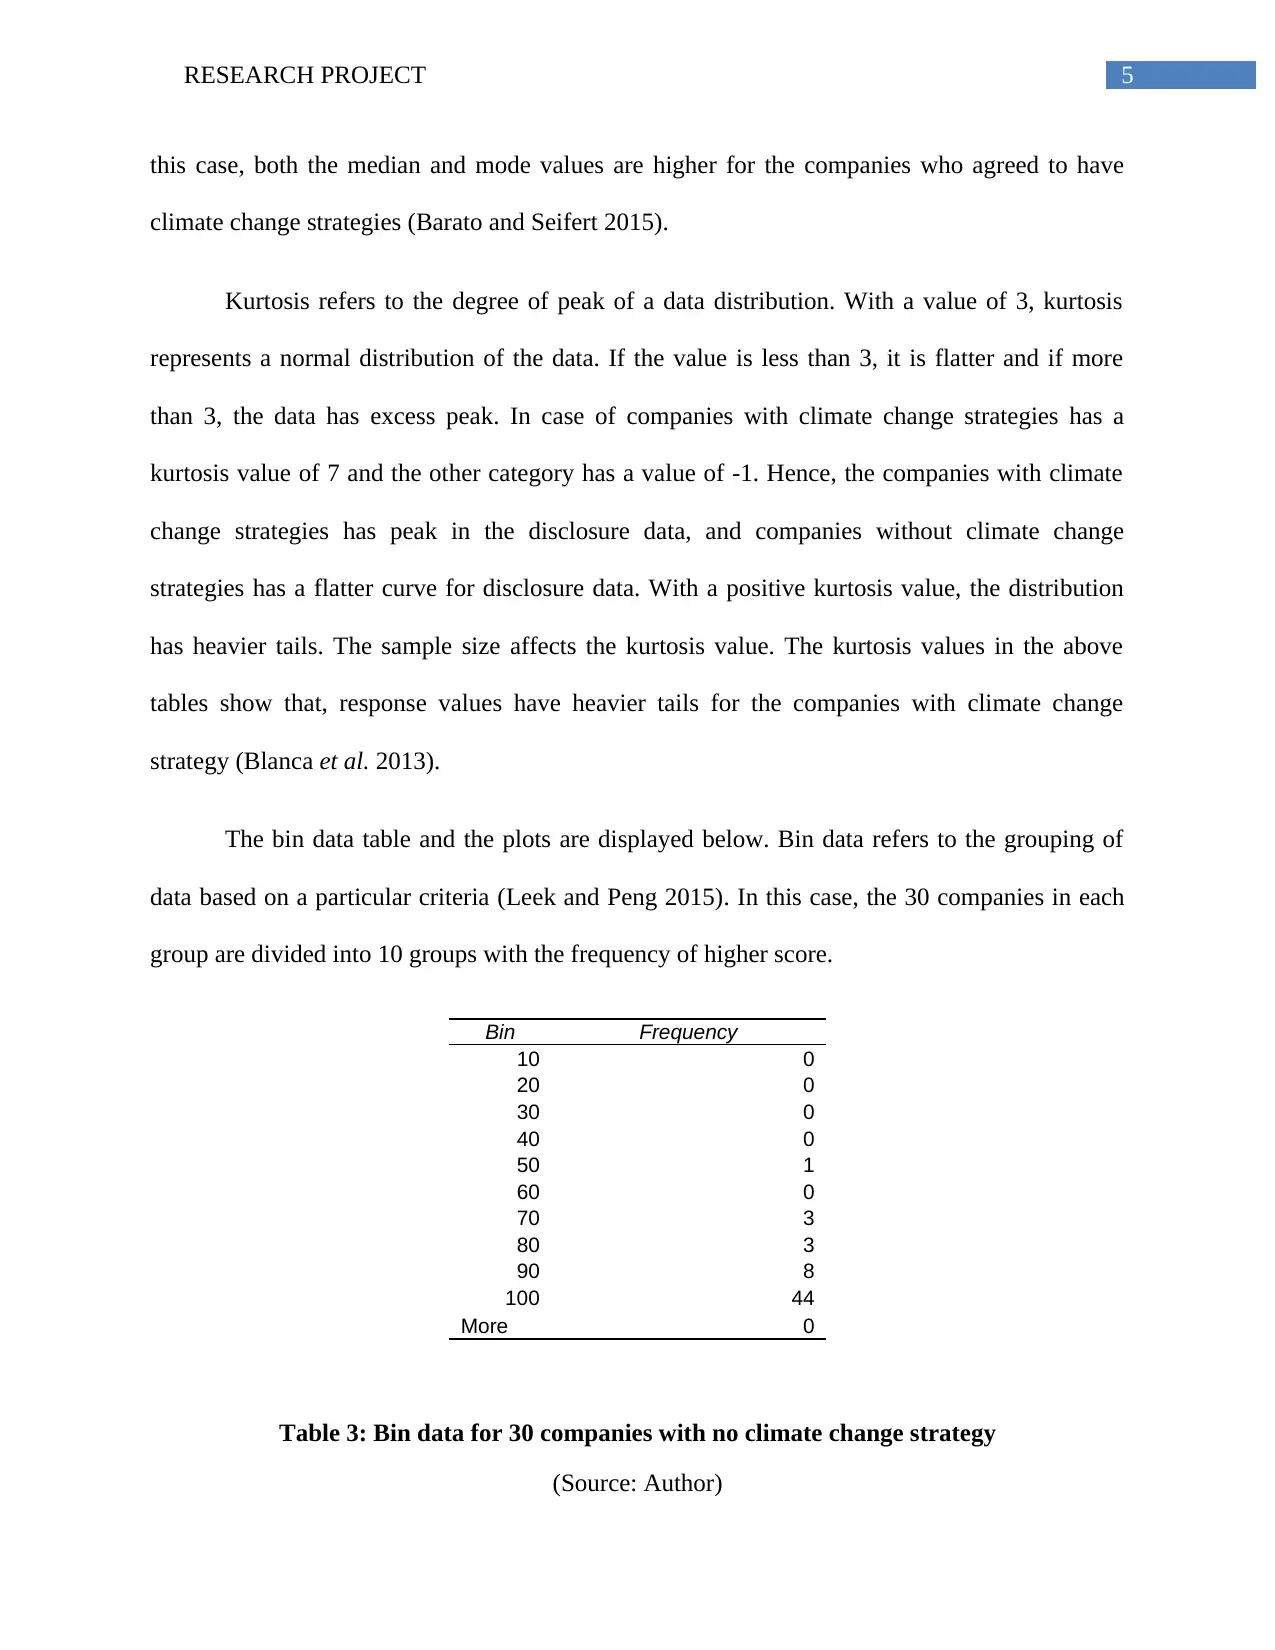
The bin data table and the plots are displayed below. Bin data refers to the grouping of
data based on a particular criteria (Leek and Peng 2015). In this case, the 30 companies in each
group are divided into 10 groups with the frequency of higher score.
Bin Frequency
10 0
20 0
30 0
40 0
50 1
60 0
70 3
80 3
90 8
100 44
More 0
Table 3: Bin data for 30 companies with no climate change strategy
(Source: Author)
this case, both the median and mode values are higher for the companies who agreed to have
climate change strategies (Barato and Seifert 2015).
Kurtosis refers to the degree of peak of a data distribution. With a value of 3, kurtosis
represents a normal distribution of the data. If the value is less than 3, it is flatter and if more
than 3, the data has excess peak. In case of companies with climate change strategies has a
kurtosis value of 7 and the other category has a value of -1. Hence, the companies with climate
change strategies has peak in the disclosure data, and companies without climate change
strategies has a flatter curve for disclosure data. With a positive kurtosis value, the distribution
has heavier tails. The sample size affects the kurtosis value. The kurtosis values in the above
tables show that, response values have heavier tails for the companies with climate change
strategy (Blanca et al. 2013).
The bin data table and the plots are displayed below. Bin data refers to the grouping of
data based on a particular criteria (Leek and Peng 2015). In this case, the 30 companies in each
group are divided into 10 groups with the frequency of higher score.
Bin Frequency
10 0
20 0
30 0
40 0
50 1
60 0
70 3
80 3
90 8
100 44
More 0
Table 3: Bin data for 30 companies with no climate change strategy
(Source: Author)
⊘ This is a preview!⊘
Do you want full access?
Subscribe today to unlock all pages.
Trusted by 1+ million students worldwide
6RESEARCH PROJECT
10
20
30
40
50
60
70
80
90
100
More
0
10
20
30
40
50
YES
Frequency
Bin
Frequency
Figure 1: Bin data for 30 companies with no climate change strategy
(Source: Author)
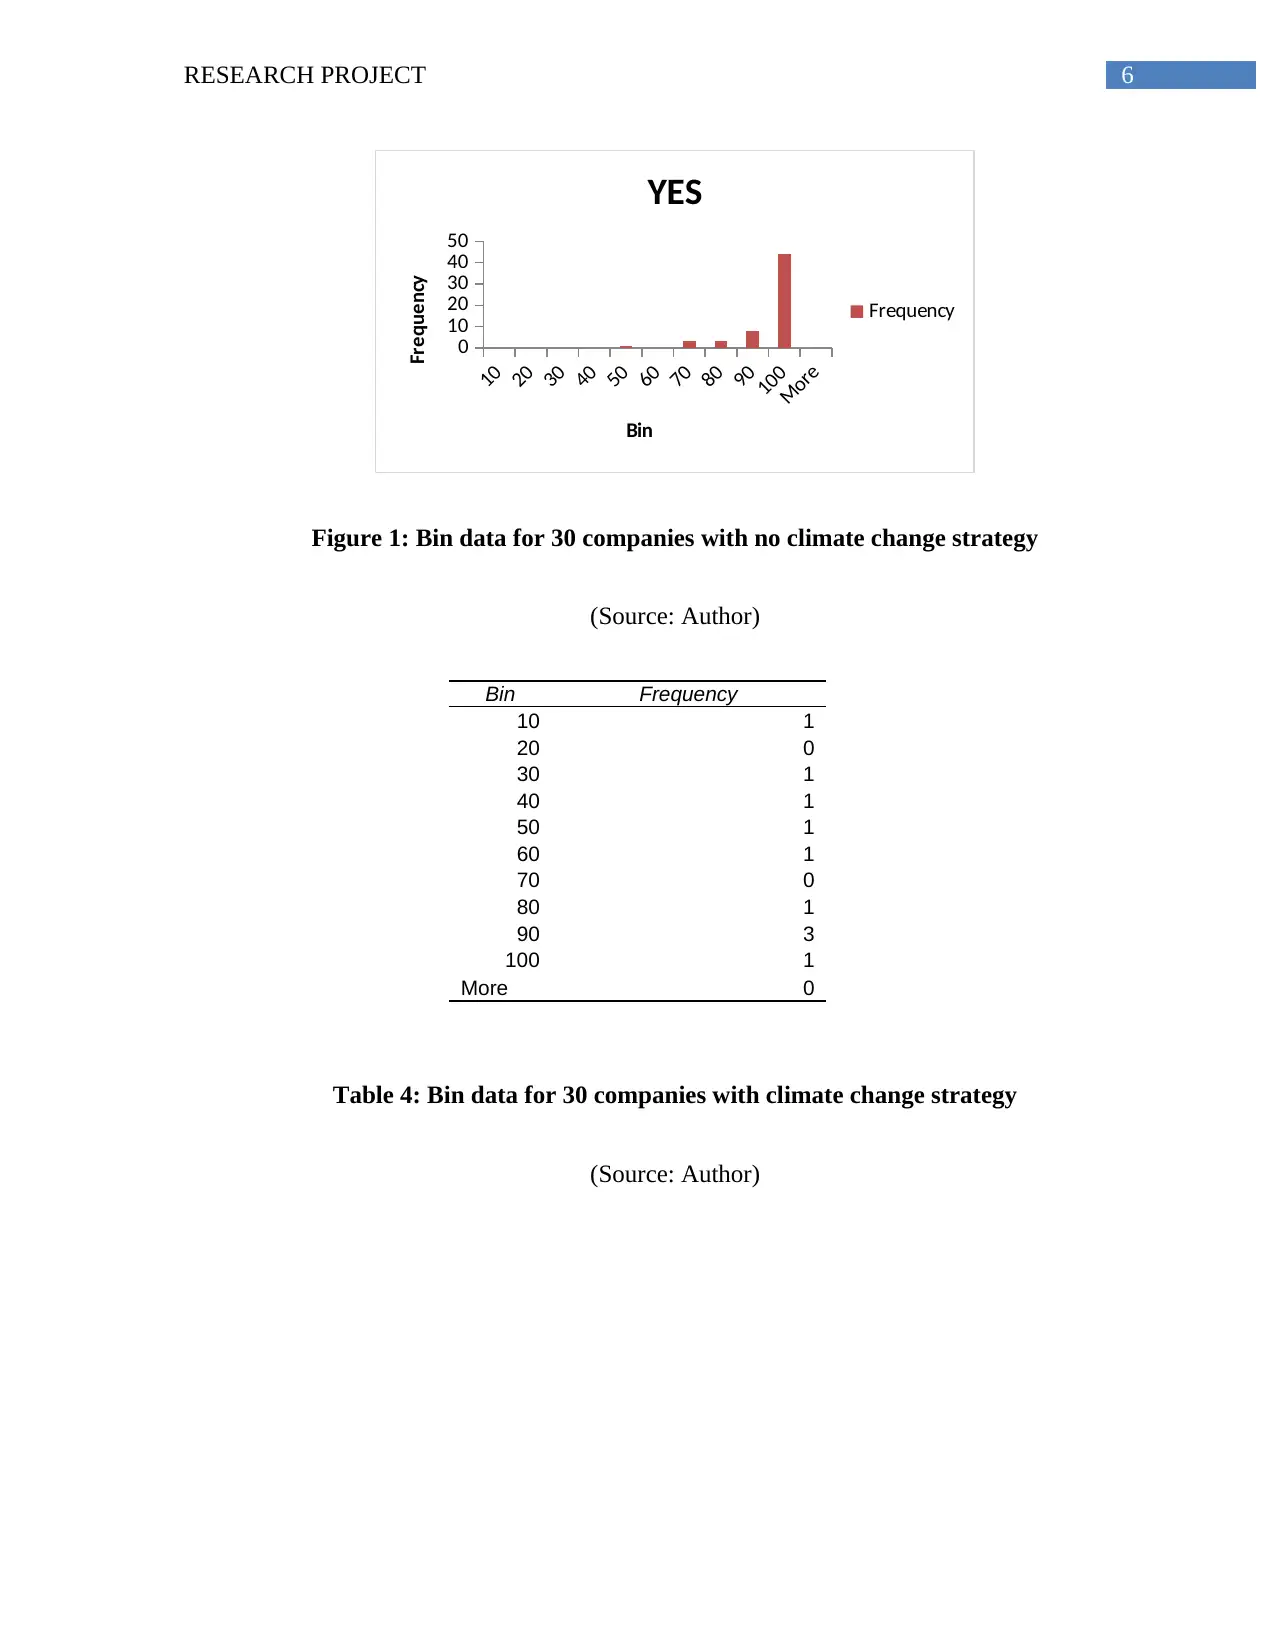
Bin Frequency
10 1
20 0
30 1
40 1
50 1
60 1
70 0
80 1
90 3
100 1
More 0
Table 4: Bin data for 30 companies with climate change strategy
(Source: Author)
10
20
30
40
50
60
70
80
90
100
More
0
10
20
30
40
50
YES
Frequency
Bin
Frequency
Figure 1: Bin data for 30 companies with no climate change strategy
(Source: Author)
Bin Frequency
10 1
20 0
30 1
40 1
50 1
60 1
70 0
80 1
90 3
100 1
More 0
Table 4: Bin data for 30 companies with climate change strategy
(Source: Author)
Paraphrase This Document
Need a fresh take? Get an instant paraphrase of this document with our AI Paraphraser
7RESEARCH PROJECT
10
20
30
40
50
60
70
80
90
100
More
0
2
4
NO
Frequency
Bin
Frequency
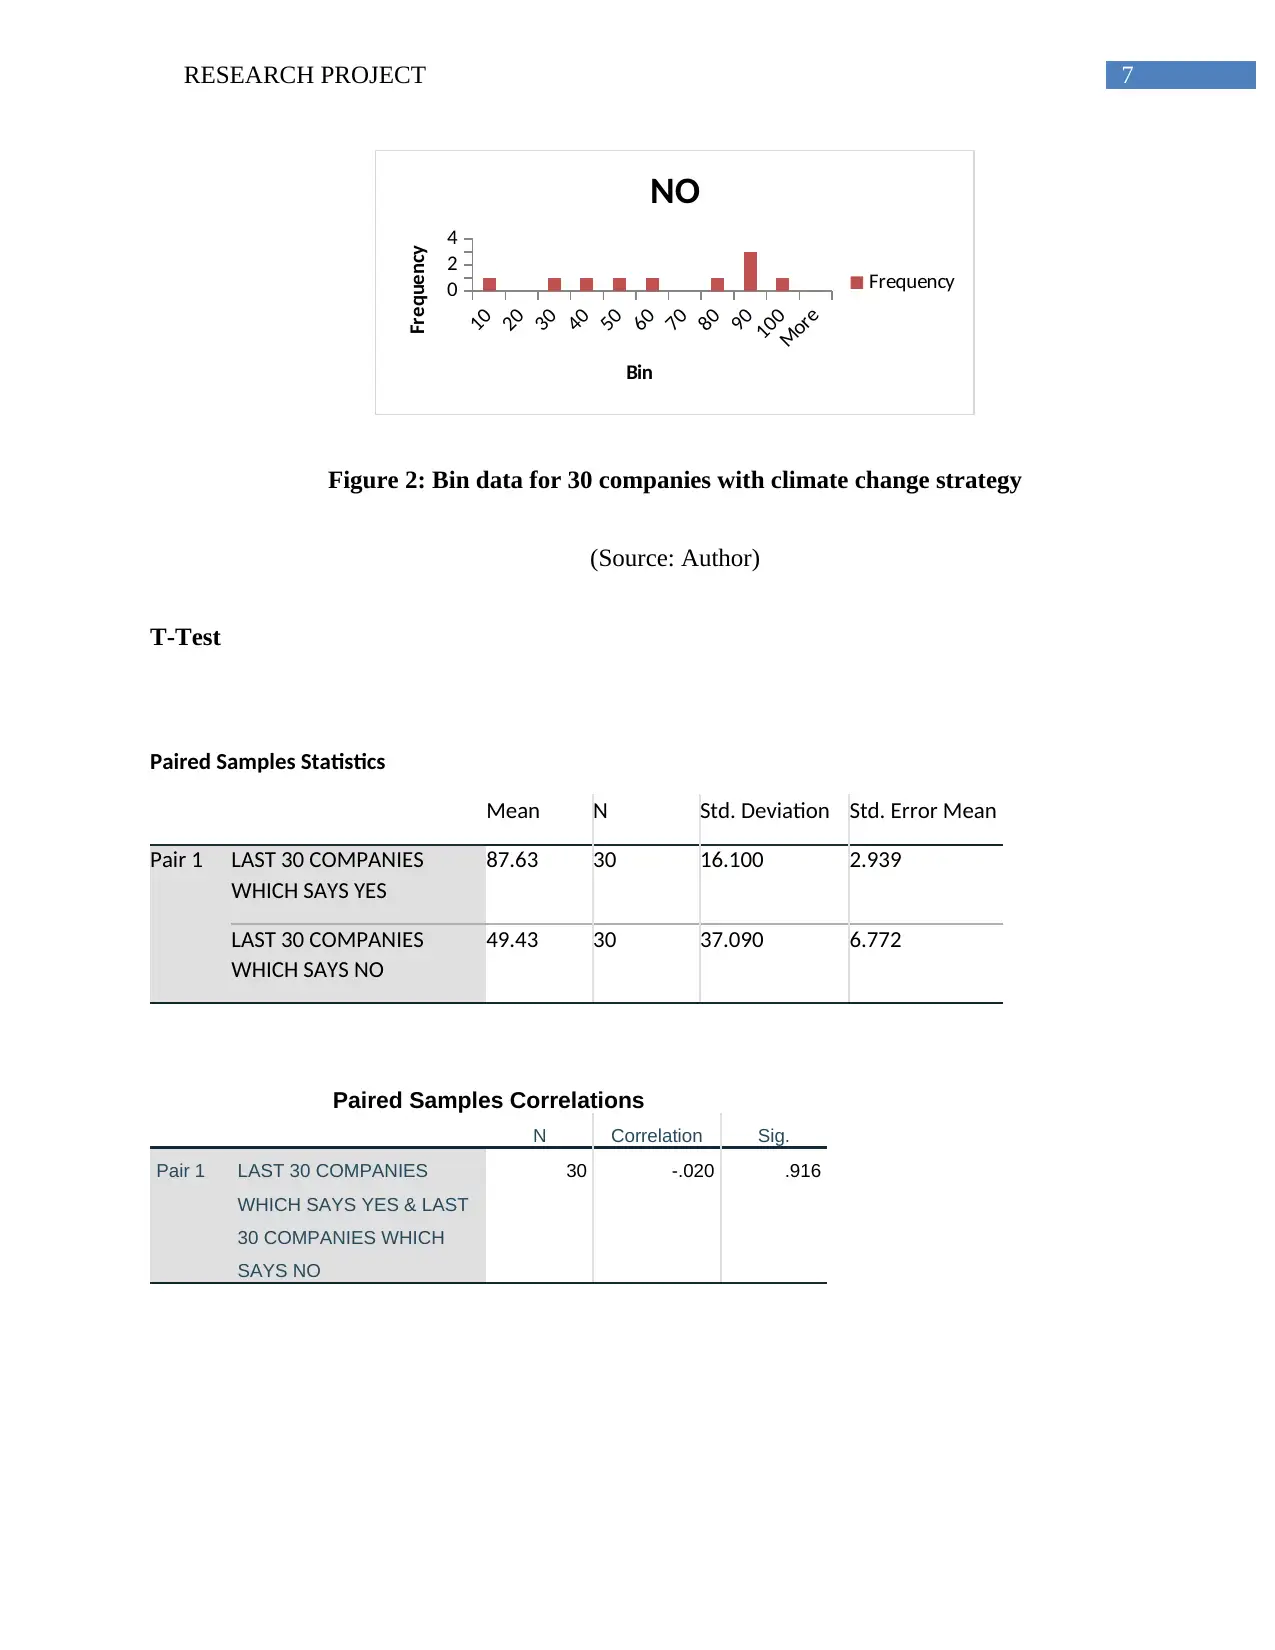
Figure 2: Bin data for 30 companies with climate change strategy
(Source: Author)
T-Test
Paired Samples Statistics
Mean N Std. Deviation Std. Error Mean
Pair 1 LAST 30 COMPANIES
WHICH SAYS YES
87.63 30 16.100 2.939
LAST 30 COMPANIES
WHICH SAYS NO
49.43 30 37.090 6.772
Paired Samples Correlations
N Correlation Sig.
Pair 1 LAST 30 COMPANIES
WHICH SAYS YES & LAST
30 COMPANIES WHICH
SAYS NO
30 -.020 .916
10
20
30
40
50
60
70
80
90
100
More
0
2
4
NO
Frequency
Bin
Frequency
Figure 2: Bin data for 30 companies with climate change strategy
(Source: Author)
T-Test
Paired Samples Statistics
Mean N Std. Deviation Std. Error Mean
Pair 1 LAST 30 COMPANIES
WHICH SAYS YES
87.63 30 16.100 2.939
LAST 30 COMPANIES
WHICH SAYS NO
49.43 30 37.090 6.772
Paired Samples Correlations
N Correlation Sig.
Pair 1 LAST 30 COMPANIES
WHICH SAYS YES & LAST
30 COMPANIES WHICH
SAYS NO
30 -.020 .916
8RESEARCH PROJECT
Paired Samples Test
Paired Differences
t df
Sig. (2-
tailed)Mean
Std.
Deviation
Std. Error
Mean
95% Confidence Interval
of the Difference
Lower Upper
Pair
1
LAST 30
COMPANIES
WHICH SAYS YES
- LAST 30
COMPANIES
WHICH SAYS NO
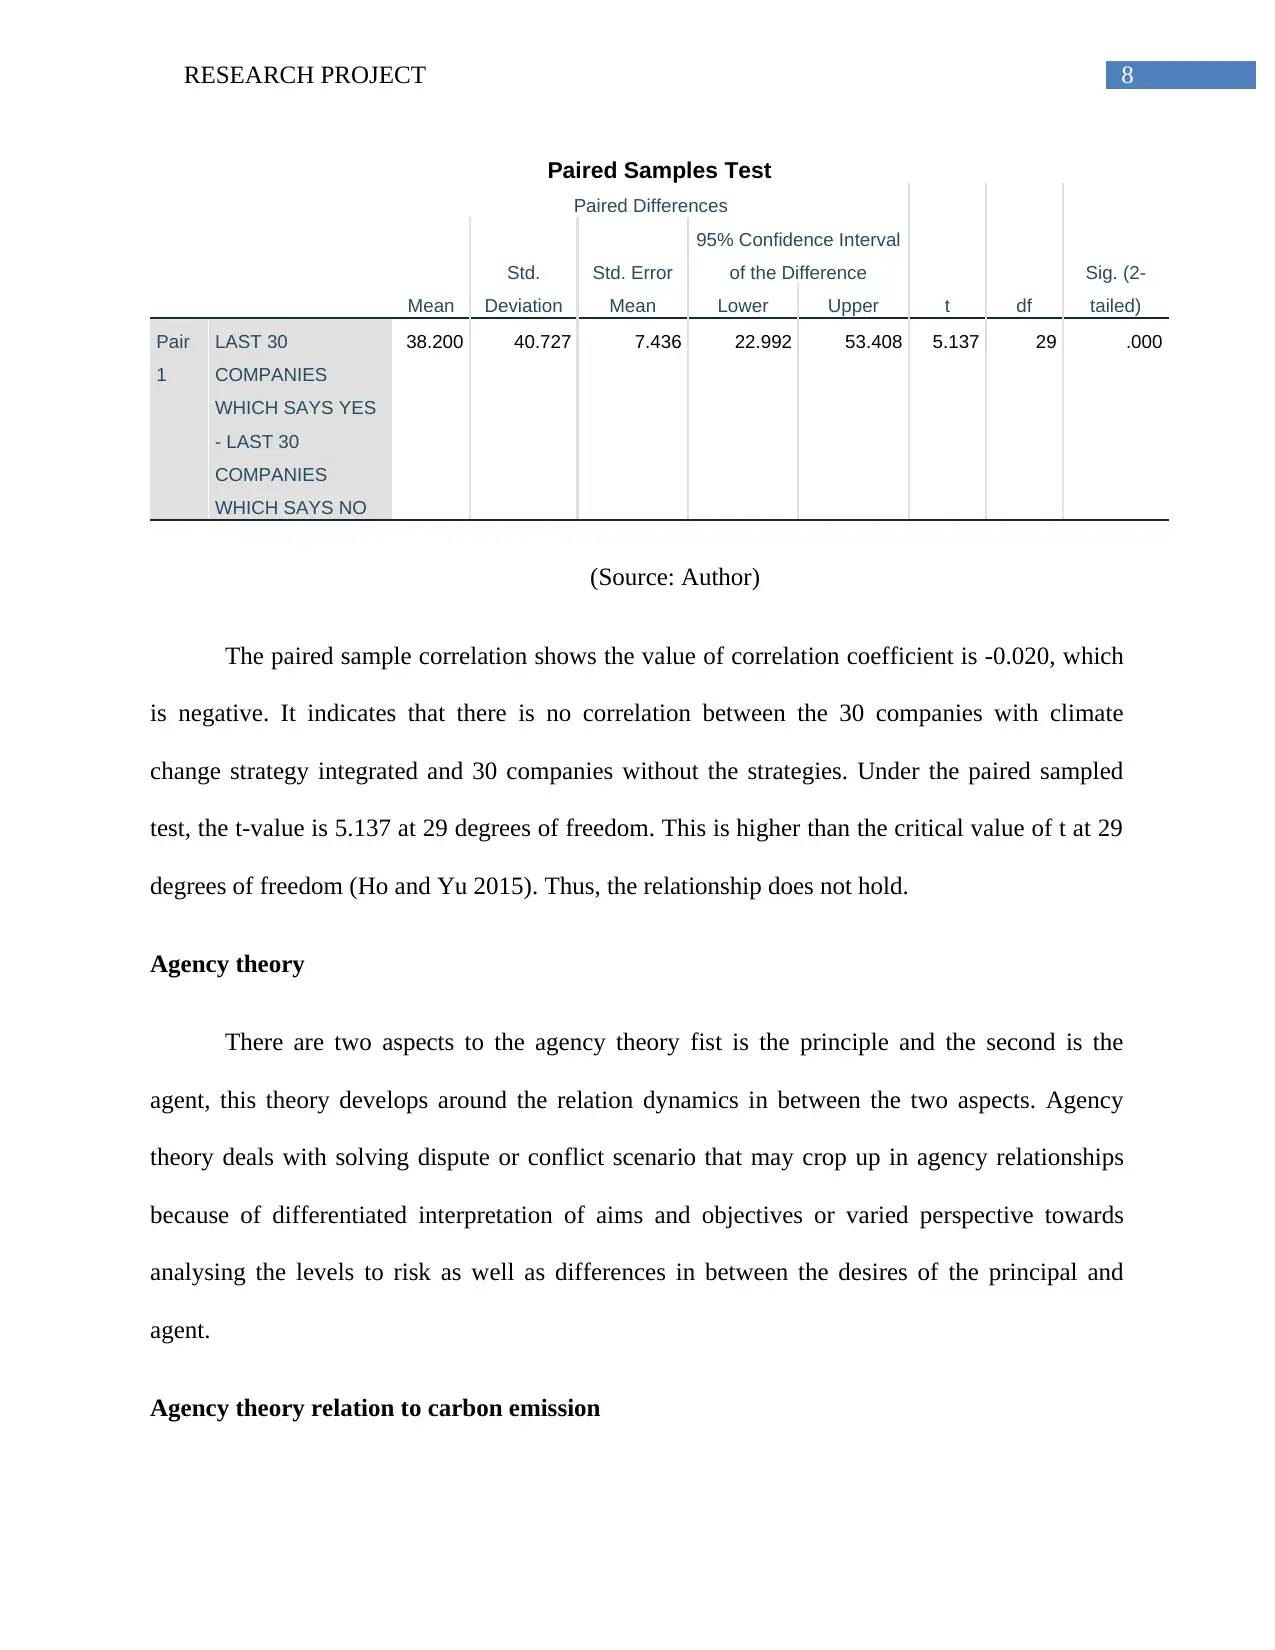
38.200 40.727 7.436 22.992 53.408 5.137 29 .000
(Source: Author)
The paired sample correlation shows the value of correlation coefficient is -0.020, which
is negative. It indicates that there is no correlation between the 30 companies with climate
change strategy integrated and 30 companies without the strategies. Under the paired sampled
test, the t-value is 5.137 at 29 degrees of freedom. This is higher than the critical value of t at 29
degrees of freedom (Ho and Yu 2015). Thus, the relationship does not hold.
Agency theory
There are two aspects to the agency theory fist is the principle and the second is the
agent, this theory develops around the relation dynamics in between the two aspects. Agency
theory deals with solving dispute or conflict scenario that may crop up in agency relationships
because of differentiated interpretation of aims and objectives or varied perspective towards
analysing the levels to risk as well as differences in between the desires of the principal and
agent.
Agency theory relation to carbon emission
Paired Samples Test
Paired Differences
t df
Sig. (2-
tailed)Mean
Std.
Deviation
Std. Error
Mean
95% Confidence Interval
of the Difference
Lower Upper
Pair
1
LAST 30
COMPANIES
WHICH SAYS YES
- LAST 30
COMPANIES
WHICH SAYS NO
38.200 40.727 7.436 22.992 53.408 5.137 29 .000
(Source: Author)
The paired sample correlation shows the value of correlation coefficient is -0.020, which
is negative. It indicates that there is no correlation between the 30 companies with climate
change strategy integrated and 30 companies without the strategies. Under the paired sampled
test, the t-value is 5.137 at 29 degrees of freedom. This is higher than the critical value of t at 29
degrees of freedom (Ho and Yu 2015). Thus, the relationship does not hold.
Agency theory
There are two aspects to the agency theory fist is the principle and the second is the
agent, this theory develops around the relation dynamics in between the two aspects. Agency
theory deals with solving dispute or conflict scenario that may crop up in agency relationships
because of differentiated interpretation of aims and objectives or varied perspective towards
analysing the levels to risk as well as differences in between the desires of the principal and
agent.
Agency theory relation to carbon emission
⊘ This is a preview!⊘
Do you want full access?
Subscribe today to unlock all pages.
Trusted by 1+ million students worldwide
9RESEARCH PROJECT
Here in this case the principle is the climate change and the agent is the corporate houses.
To take up the mantel of sustainability and to be more responsible towards the environment may
give rise to several conflicts in the management and daily operation of the business. There are
several industries that have carelessly used the natural resources and has polluted the
environment for years without contemplating on the consequences that the activities of the
business might have on the climate and the environment. Pertaining to sustainable option may be
expensive for a corporate, for many it is an added expense and investment which does not have
any enhanced return apart from creation of goodwill and hence there is a conflict of interest in
pertaining with the sustainable business model. Climate change not only have a significant
impact on the health conditions of the people it also has an impact on the overall global economy
as well, the formation of United Nation Framework Convention on Climate Change (UNFCCC)
and the Kyoto Protocol is one of the steps that has been taken towards combating the impacts of
climate change. One of the major factors that are held responsible for climate change and global
warming is the emission of greenhouse gases (GHG) emissions and this association has been
arranged in order to reduce the emission level. Carbon emission can be both natural and
artificial, it is important to maintain a balance of carbon in the atmosphere. Combustion of fossil
fuel like coal, natural gas and oil are the major sources of carbon emission in the atmosphere.
Corporate who have factories that use any of these to run equipment and machinery are bound to
emit carbon dioxide in large quantities to the atmosphere thereby disrupting the balance of nature
and causing changes in the climate. To adapt to eco friendly and favourable conditions of
operation the company will have to invest and usually the investment is huge and hence there is a
dispute of interest in sustainability. Business organisation in these cases should understand the
responsibility they have towards the society and environment and priorities the aims and goals
Paraphrase This Document
Need a fresh take? Get an instant paraphrase of this document with our AI Paraphraser
10RESEARCH PROJECT
according to the need of the hour. According to the triple bottom line concept of sustainability
business organisations should pay equal attention to 3Ps: Price, Planet and People. Creating
carbon sinks in order to reduce pollution can be one of the small steps that a company can take
towards sustainable development. It simply means afforestation as trees and plants are regarded
as a nature carbon accumulator.
Cross tabulation
GICS Sector (Company) * 2015 CC2.2. Is climate change integrated into your business strategy? Cross
tabulation
Count
2015 CC2.2. Is climate change integrated into
your business strategy?
Total
0 No Yes
GICS Sector (Company)
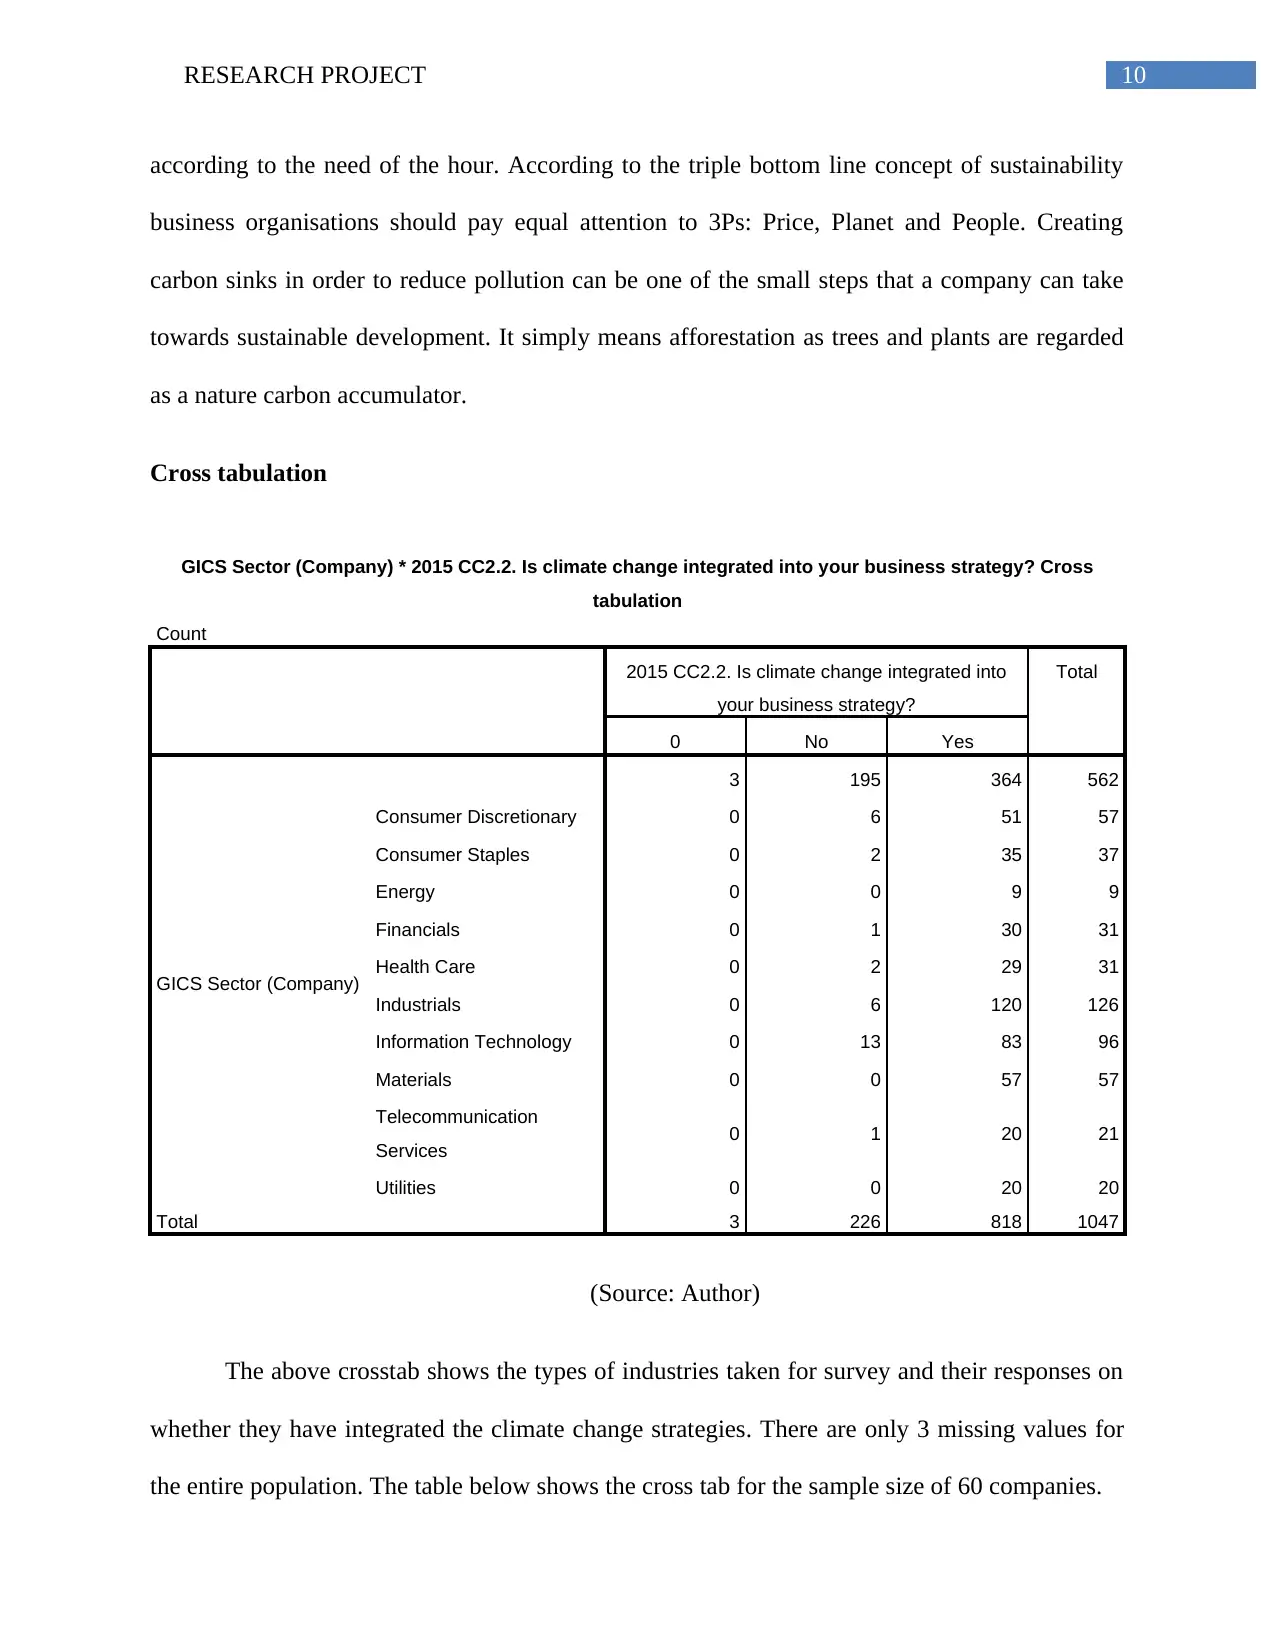
3 195 364 562
Consumer Discretionary 0 6 51 57
Consumer Staples 0 2 35 37
Energy 0 0 9 9
Financials 0 1 30 31
Health Care 0 2 29 31
Industrials 0 6 120 126
Information Technology 0 13 83 96
Materials 0 0 57 57
Telecommunication
Services 0 1 20 21
Utilities 0 0 20 20
Total 3 226 818 1047
(Source: Author)
The above crosstab shows the types of industries taken for survey and their responses on
whether they have integrated the climate change strategies. There are only 3 missing values for
the entire population. The table below shows the cross tab for the sample size of 60 companies.
according to the need of the hour. According to the triple bottom line concept of sustainability
business organisations should pay equal attention to 3Ps: Price, Planet and People. Creating
carbon sinks in order to reduce pollution can be one of the small steps that a company can take
towards sustainable development. It simply means afforestation as trees and plants are regarded
as a nature carbon accumulator.
Cross tabulation
GICS Sector (Company) * 2015 CC2.2. Is climate change integrated into your business strategy? Cross
tabulation
Count
2015 CC2.2. Is climate change integrated into
your business strategy?
Total
0 No Yes
GICS Sector (Company)
3 195 364 562
Consumer Discretionary 0 6 51 57
Consumer Staples 0 2 35 37
Energy 0 0 9 9
Financials 0 1 30 31
Health Care 0 2 29 31
Industrials 0 6 120 126
Information Technology 0 13 83 96
Materials 0 0 57 57
Telecommunication
Services 0 1 20 21
Utilities 0 0 20 20
Total 3 226 818 1047
(Source: Author)
The above crosstab shows the types of industries taken for survey and their responses on
whether they have integrated the climate change strategies. There are only 3 missing values for
the entire population. The table below shows the cross tab for the sample size of 60 companies.
11RESEARCH PROJECT
GICS Sector (Company) * 2015 CC2.2. Is climate change integrated into your business strategy?
Cross tabulation
Count
2015 CC2.2. Is climate change
integrated into your business
strategy?
Total
No Yes
GICS Sector (Company)
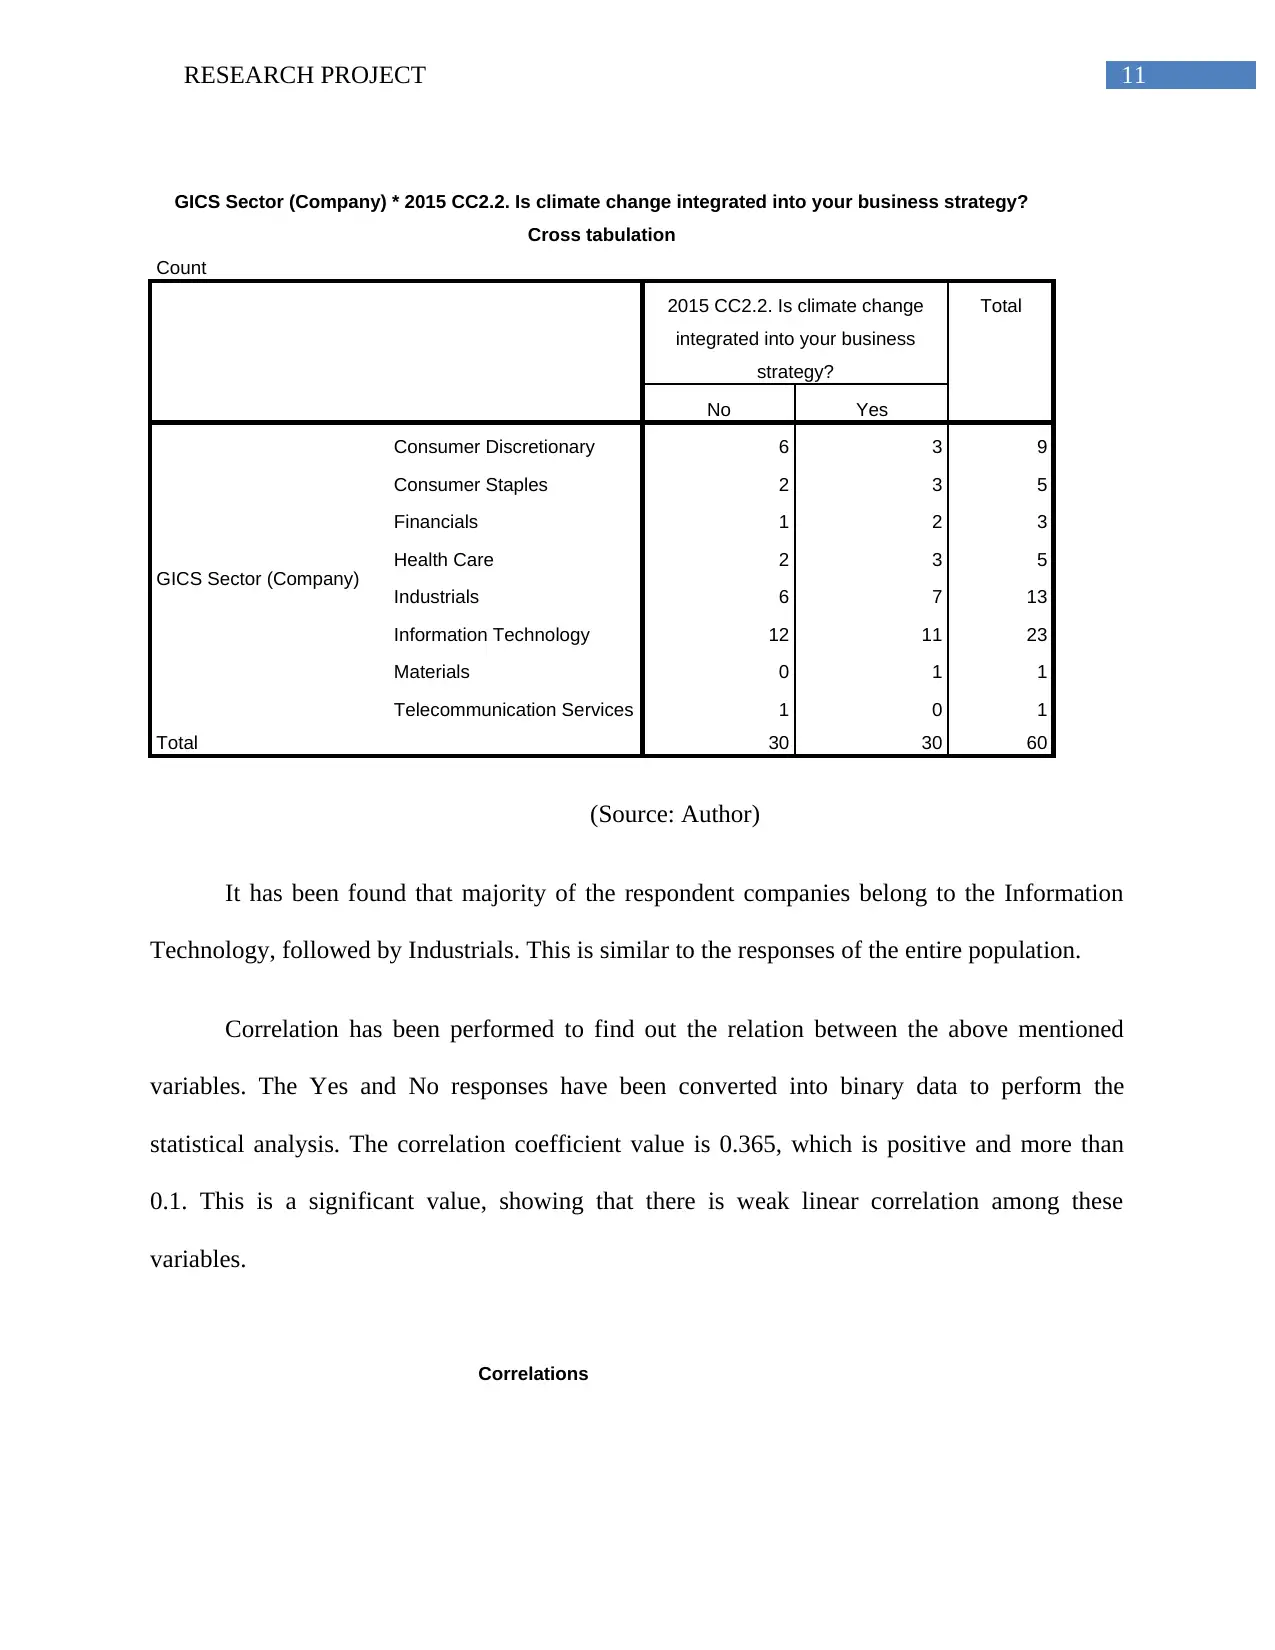
Consumer Discretionary 6 3 9
Consumer Staples 2 3 5
Financials 1 2 3
Health Care 2 3 5
Industrials 6 7 13
Information Technology 12 11 23
Materials 0 1 1
Telecommunication Services 1 0 1
Total 30 30 60
(Source: Author)
It has been found that majority of the respondent companies belong to the Information
Technology, followed by Industrials. This is similar to the responses of the entire population.
Correlation has been performed to find out the relation between the above mentioned
variables. The Yes and No responses have been converted into binary data to perform the
statistical analysis. The correlation coefficient value is 0.365, which is positive and more than
0.1. This is a significant value, showing that there is weak linear correlation among these
variables.
Correlations
GICS Sector (Company) * 2015 CC2.2. Is climate change integrated into your business strategy?
Cross tabulation
Count
2015 CC2.2. Is climate change
integrated into your business
strategy?
Total
No Yes
GICS Sector (Company)
Consumer Discretionary 6 3 9
Consumer Staples 2 3 5
Financials 1 2 3
Health Care 2 3 5
Industrials 6 7 13
Information Technology 12 11 23
Materials 0 1 1
Telecommunication Services 1 0 1
Total 30 30 60
(Source: Author)
It has been found that majority of the respondent companies belong to the Information
Technology, followed by Industrials. This is similar to the responses of the entire population.
Correlation has been performed to find out the relation between the above mentioned
variables. The Yes and No responses have been converted into binary data to perform the
statistical analysis. The correlation coefficient value is 0.365, which is positive and more than
0.1. This is a significant value, showing that there is weak linear correlation among these
variables.
Correlations
⊘ This is a preview!⊘
Do you want full access?
Subscribe today to unlock all pages.
Trusted by 1+ million students worldwide
1 out of 18
Related Documents


Your All-in-One AI-Powered Toolkit for Academic Success.
+13062052269
info@desklib.com
Available 24*7 on WhatsApp / Email
![[object Object]](/_next/static/media/star-bottom.7253800d.svg)
Unlock your academic potential
Copyright © 2020–2026 A2Z Services. All Rights Reserved. Developed and managed by ZUCOL.