Business Decision Making Project: Data Analysis and Recommendations
VerifiedAdded on 2020/07/23
|17
|4352
|32
Project
AI Summary
This project focuses on business decision-making for Murano restaurant, aiming to maximize operations through a new outlet. It details a plan for collecting primary and secondary data, including survey methodology and questionnaire design. The project involves creating and analyzing data, including statistical formulations, charts, and graphs, to provide insights for senior management. Task 1 covers data collection planning, survey design, and questionnaire creation. Task 2 focuses on data analysis, graph generation, and report writing for management. Task 3 emphasizes the use of information processing tools, project management planning, and financial tools for decision-making. The project provides a comprehensive analysis of the data, including measures of central tendency and dispersion, quartile analysis, and correlation coefficients, to support informed business decisions. The conclusion summarizes the findings and recommendations based on the collected data and analysis.
Business Decision Making
Paraphrase This Document
Need a fresh take? Get an instant paraphrase of this document with our AI Paraphraser
Table of Contents
INTRODUCTION...........................................................................................................................3
TASK 1............................................................................................................................................3
1.1 Plan for collecting primary and secondary data...............................................................3
1.2 Present the survey methodology and sampling frame used..............................................4
1.3 Design a questionnaire for given business problem.........................................................5
2.1 Creation of information....................................................................................................6
2.2 Analyse the result for drawing valid conclusion..............................................................7
2.3 Analysis of information through measure of dispersion..................................................8
2.4 Quartile and correlation coefficient in better decision making........................................9
TASK 2..........................................................................................................................................10
3.1 Produce graphs and spreadsheets for drawing valid conclusion....................................10
3.2 Create trend lines for future estimation..........................................................................11
3.3 Presentation for senior management..............................................................................12
3.4 Formal business report for management........................................................................12
TASK 3..........................................................................................................................................13
4.1 Use of appropriate information processing tool.............................................................13
4.2 Prepare a project management plan with critical path system.......................................13
4.3 Use of financial tools for decision making.....................................................................15
CONCLUSION..............................................................................................................................16
REFERENCES..............................................................................................................................17
INTRODUCTION
Judgement carried down an organisation towards positive direction so that efficiency
could be manage at workplace in an appropriate and suitable manner. Business decision making
depicts as a concept which signifies about management of carious working and operation in
order to maximise effectiveness (Barlett, 2016). This project is based on business decisions
making for Murano restaurant whom want to maximise their operation by opening another outlet.
For this aspect, they need to create a plan for collecting data and determine appropriate method
to organise a survey. Along with this, it will also reflect about use of statistical formulation of
table so that appropriate understanding get done. Although, various charts and graphs will going
to disseminate information clearly so that senior management could understand it properly and
promote ethical working. On the basis of software generated information organisation will going
to understand the things properly and make appropriate and valid decision as well.
TASK 1
1.1 Plan for collecting primary and secondary data
In a study, there is a need to use appropriate and suitable tool and technique to understand
various number of facts. Thus, it is a major thing to utilise appropriate and beneficial approach to
collate data properly so that effective gain could be promoted. Thus, various data collection tools
for Murano survey are:
Primary data: Every project need raw material to understand various facts and things in a
suitable manner. Primary data is helpful to understand the appropriate facts and things by
gathering new information so that better working and decision making get done. This
could be perform through questionnaire, live surveys via social media etc.
Secondary data: Another method for data collection is secondary source of information
in which already existed information get utilise to understand various appropriate and
suitable facts and figures. This get done on the basis of various books, journals, articles
etc.
For this project, primary data process get utilise which further assist in better understanding of
various respondents opinion in order to manage and maintain effectiveness and efficiency (Beach
and Lipshitz, 2017). The plan for collecting primary data signifies as follow:
Need to assess the flexibility of information and data collection process
⊘ This is a preview!⊘
Do you want full access?
Subscribe today to unlock all pages.
Trusted by 1+ million students worldwide
Determine and select the appropriate sample size on which investigation going to take
place which is 80 respondent
Identify the best approach or method for data collection which is questionnaire
Select best approach to analyse the outcome
1.2 Present the survey methodology and sampling frame used
Survey define as a process through which data get collected on any define and concern
problem or a issue (Blondel and Müller-Rommel, 2016). It is important to organise appropriate
and suitable survey for any define problem so that better and appropriate outcome could be gain.
There are various survey methodologies get identify in a study out of which Murano need to
adopt beneficial one:
Questionnaire: It is one of an appropriate technique to organise a survey so that personal
opinion of each and every individual could be gain. It enable in better and effective
judgement so that beneficial interpretation get done.
Personal interview: Another tool for survey is personal interview which aid in providing
better suited aspect in order to enhance and promote effectiveness.
Social media: As per the present time, social media depicts as an emerging source of
survey. It will assist in better and suitable gain so that efficiency and effectiveness could
be maximise as well as youth opinion could derive.
Out of all these tools, social media questionnaire distribution suppose to be determine as best
technique in order to collect responses from several individual (Drucker, 2017). This get done by
selecting respondent through company social media page followers and invite them at one place
in order to fill questionnaire form. Along with this, another thing which required to interpret in
working is sampling method. Major kinds of sampling tool for Murano research are:
Random sampling
Quota sampling
Strata sampling
Out of all of them, random sampling tool get utilise in which various respondents get selected
from different individuals through random sampling frame. This will going to support in order to
determine best suited results for better concerning one.
Paraphrase This Document
Need a fresh take? Get an instant paraphrase of this document with our AI Paraphraser
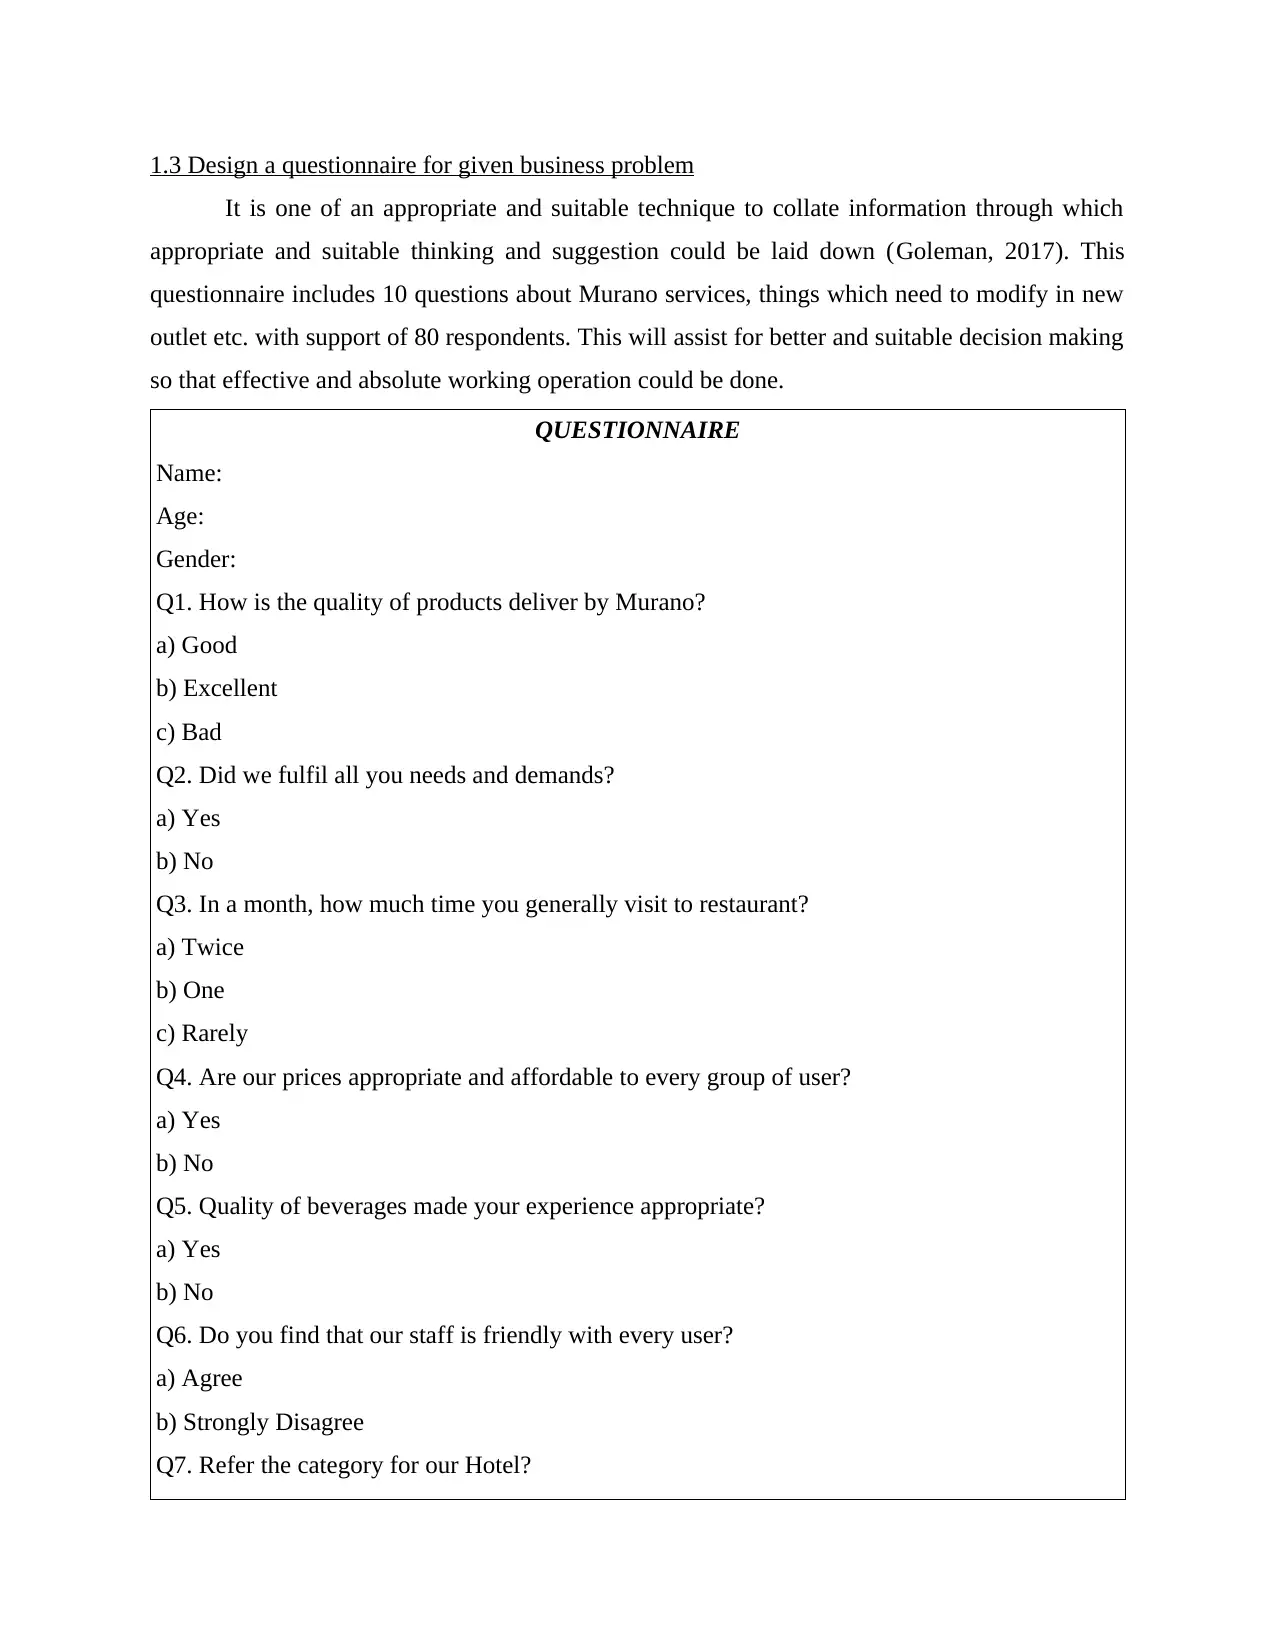
1.3 Design a questionnaire for given business problem
It is one of an appropriate and suitable technique to collate information through which
appropriate and suitable thinking and suggestion could be laid down (Goleman, 2017). This
questionnaire includes 10 questions about Murano services, things which need to modify in new
outlet etc. with support of 80 respondents. This will assist for better and suitable decision making
so that effective and absolute working operation could be done.
QUESTIONNAIRE
Name:
Age:
Gender:
Q1. How is the quality of products deliver by Murano?
a) Good
b) Excellent
c) Bad
Q2. Did we fulfil all you needs and demands?
a) Yes
b) No
Q3. In a month, how much time you generally visit to restaurant?
a) Twice
b) One
c) Rarely
Q4. Are our prices appropriate and affordable to every group of user?
a) Yes
b) No
Q5. Quality of beverages made your experience appropriate?
a) Yes
b) No
Q6. Do you find that our staff is friendly with every user?
a) Agree
b) Strongly Disagree
Q7. Refer the category for our Hotel?
a) Five star
b) Three star
c) Average
Q8. Does you ever refer Murano to others?
a) Yes
b) No
Q9. Which location is convenient for Murano new chain?
a) Near to sea side
b) Rooftop
Q10. Any further and appropriate suggestion...
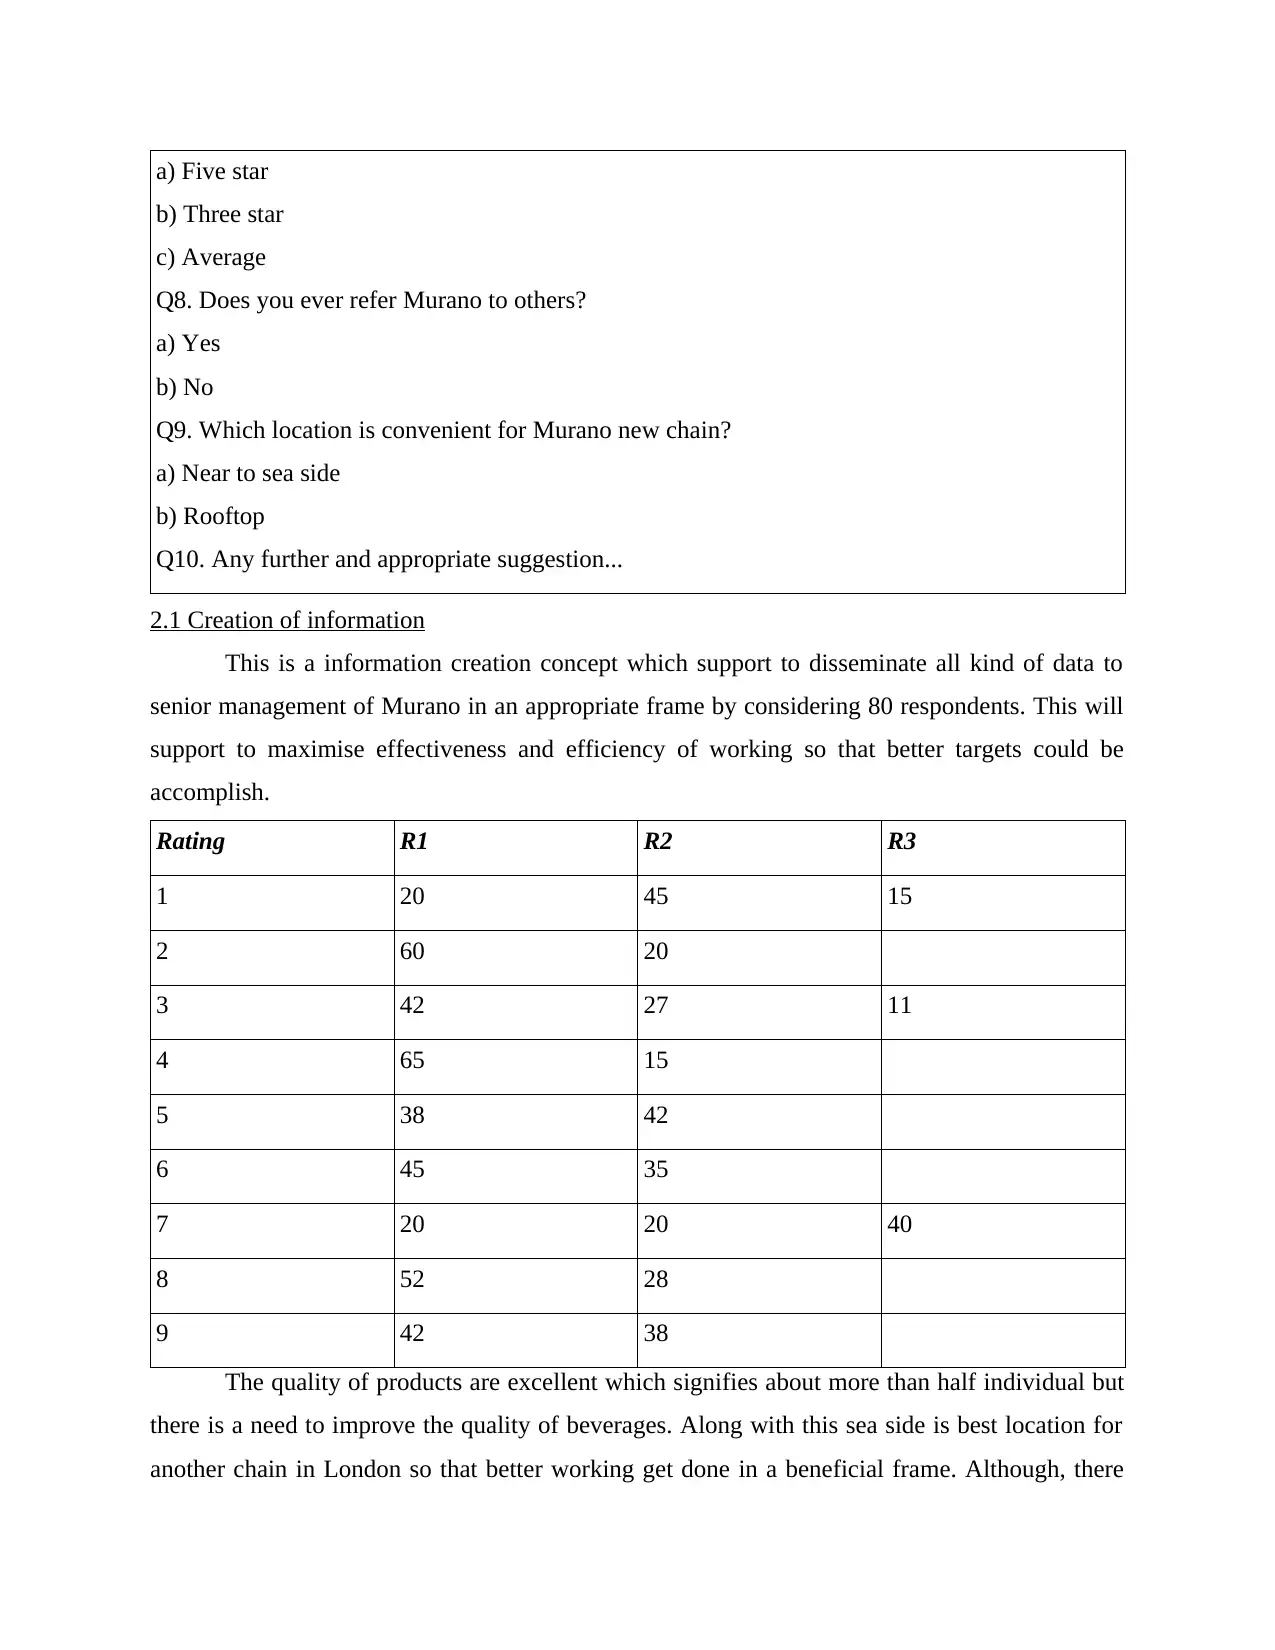
2.1 Creation of information
This is a information creation concept which support to disseminate all kind of data to
senior management of Murano in an appropriate frame by considering 80 respondents. This will
support to maximise effectiveness and efficiency of working so that better targets could be
accomplish.
Rating R1 R2 R3
1 20 45 15
2 60 20
3 42 27 11
4 65 15
5 38 42
6 45 35
7 20 20 40
8 52 28
9 42 38
The quality of products are excellent which signifies about more than half individual but
there is a need to improve the quality of beverages. Along with this sea side is best location for
another chain in London so that better working get done in a beneficial frame. Although, there
b) Three star
c) Average
Q8. Does you ever refer Murano to others?
a) Yes
b) No
Q9. Which location is convenient for Murano new chain?
a) Near to sea side
b) Rooftop
Q10. Any further and appropriate suggestion...
2.1 Creation of information
This is a information creation concept which support to disseminate all kind of data to
senior management of Murano in an appropriate frame by considering 80 respondents. This will
support to maximise effectiveness and efficiency of working so that better targets could be
accomplish.
Rating R1 R2 R3
1 20 45 15
2 60 20
3 42 27 11
4 65 15
5 38 42
6 45 35
7 20 20 40
8 52 28
9 42 38
The quality of products are excellent which signifies about more than half individual but
there is a need to improve the quality of beverages. Along with this sea side is best location for
another chain in London so that better working get done in a beneficial frame. Although, there
⊘ This is a preview!⊘
Do you want full access?
Subscribe today to unlock all pages.
Trusted by 1+ million students worldwide
are several number of considerations get articulated which need to improvise in define frame so
that better and appropriate results could be drawn.
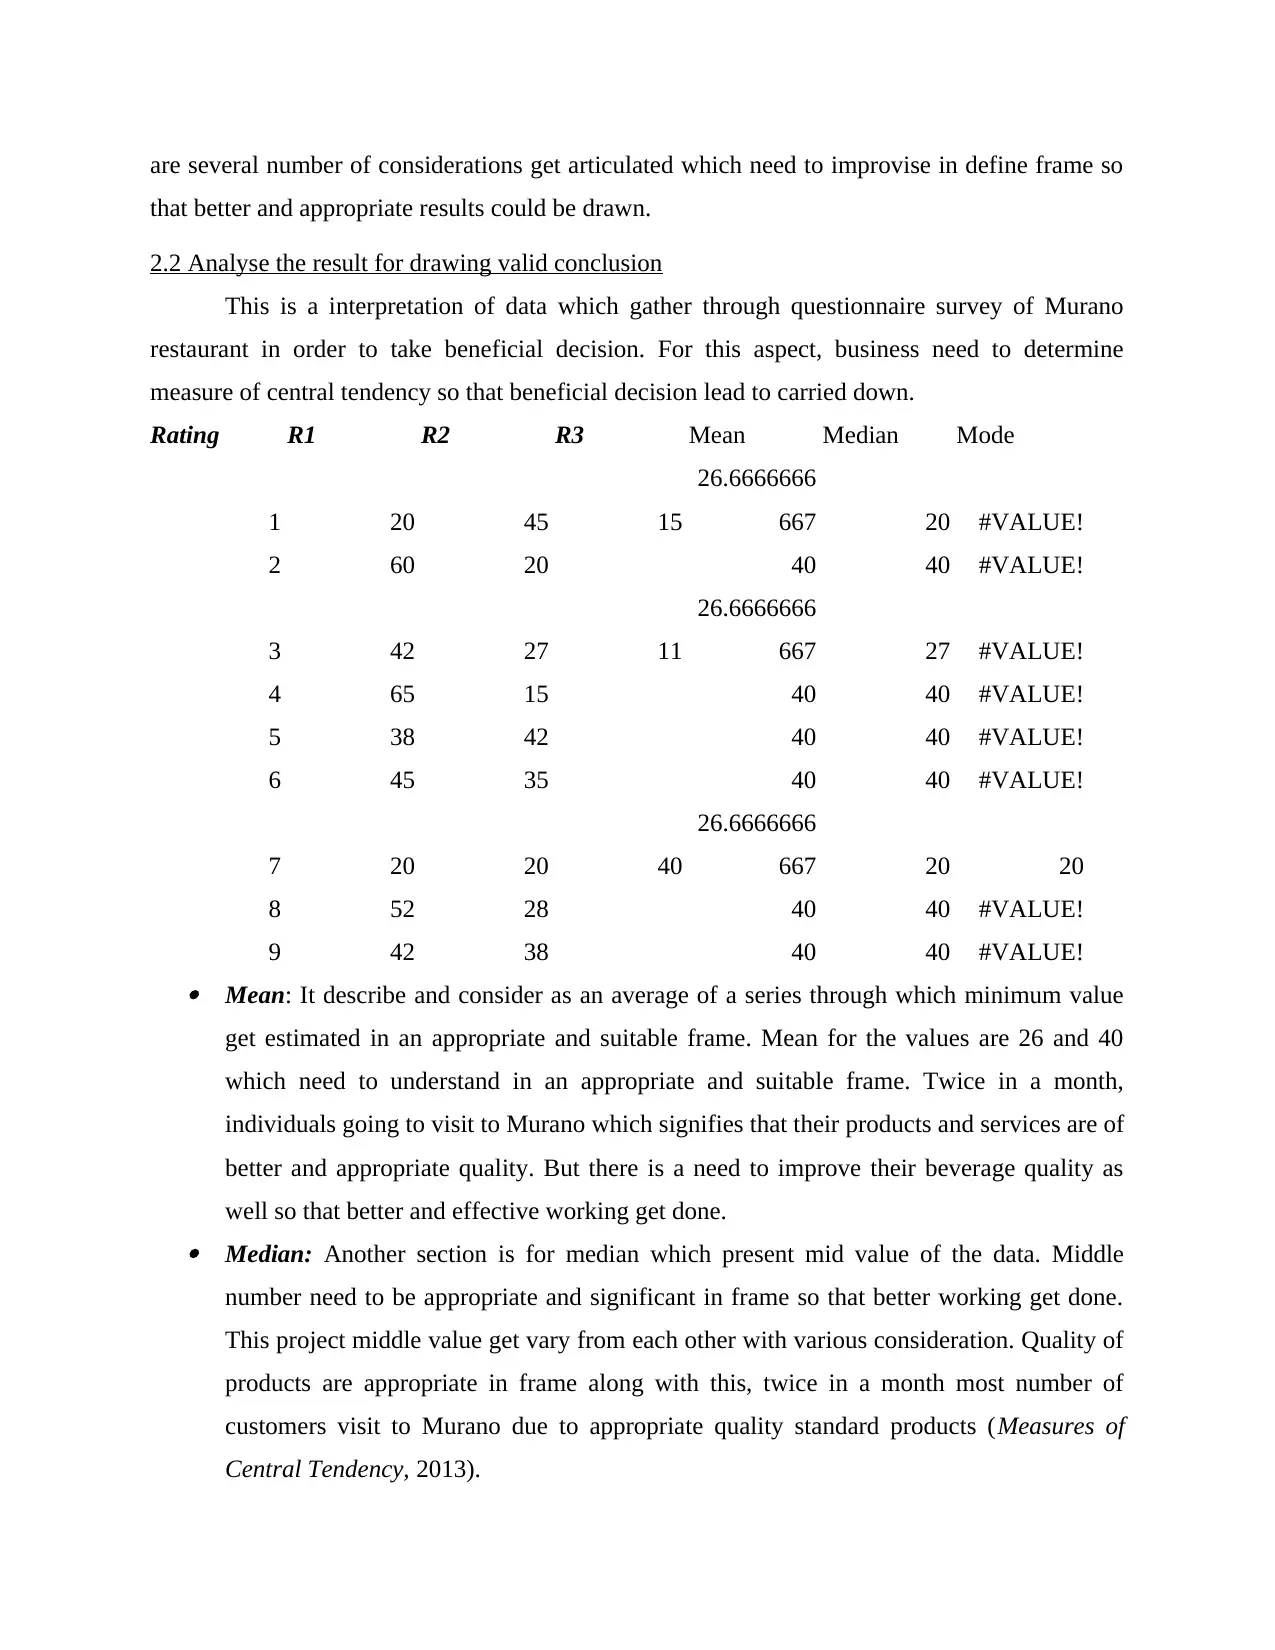
2.2 Analyse the result for drawing valid conclusion
This is a interpretation of data which gather through questionnaire survey of Murano
restaurant in order to take beneficial decision. For this aspect, business need to determine
measure of central tendency so that beneficial decision lead to carried down.
Rating R1 R2 R3 Mean Median Mode
1 20 45 15
26.6666666
667 20 #VALUE!
2 60 20 40 40 #VALUE!
3 42 27 11
26.6666666
667 27 #VALUE!
4 65 15 40 40 #VALUE!
5 38 42 40 40 #VALUE!
6 45 35 40 40 #VALUE!
7 20 20 40
26.6666666
667 20 20
8 52 28 40 40 #VALUE!
9 42 38 40 40 #VALUE! Mean: It describe and consider as an average of a series through which minimum value
get estimated in an appropriate and suitable frame. Mean for the values are 26 and 40
which need to understand in an appropriate and suitable frame. Twice in a month,
individuals going to visit to Murano which signifies that their products and services are of
better and appropriate quality. But there is a need to improve their beverage quality as
well so that better and effective working get done. Median: Another section is for median which present mid value of the data. Middle
number need to be appropriate and significant in frame so that better working get done.
This project middle value get vary from each other with various consideration. Quality of
products are appropriate in frame along with this, twice in a month most number of
customers visit to Murano due to appropriate quality standard products (Measures of
Central Tendency, 2013).
that better and appropriate results could be drawn.
2.2 Analyse the result for drawing valid conclusion
This is a interpretation of data which gather through questionnaire survey of Murano
restaurant in order to take beneficial decision. For this aspect, business need to determine
measure of central tendency so that beneficial decision lead to carried down.
Rating R1 R2 R3 Mean Median Mode
1 20 45 15
26.6666666
667 20 #VALUE!
2 60 20 40 40 #VALUE!
3 42 27 11
26.6666666
667 27 #VALUE!
4 65 15 40 40 #VALUE!
5 38 42 40 40 #VALUE!
6 45 35 40 40 #VALUE!
7 20 20 40
26.6666666
667 20 20
8 52 28 40 40 #VALUE!
9 42 38 40 40 #VALUE! Mean: It describe and consider as an average of a series through which minimum value
get estimated in an appropriate and suitable frame. Mean for the values are 26 and 40
which need to understand in an appropriate and suitable frame. Twice in a month,
individuals going to visit to Murano which signifies that their products and services are of
better and appropriate quality. But there is a need to improve their beverage quality as
well so that better and effective working get done. Median: Another section is for median which present mid value of the data. Middle
number need to be appropriate and significant in frame so that better working get done.
This project middle value get vary from each other with various consideration. Quality of
products are appropriate in frame along with this, twice in a month most number of
customers visit to Murano due to appropriate quality standard products (Measures of
Central Tendency, 2013).
Paraphrase This Document
Need a fresh take? Get an instant paraphrase of this document with our AI Paraphraser
Mode: Sometimes, few frequency arise arrives into the series again and again which
represent similar nature respondents. Although, most number of individuals stated by
considering quality of products and services that it is as per the Five star and three star
hotel. Thus, this will support to enhance customer base of a company.
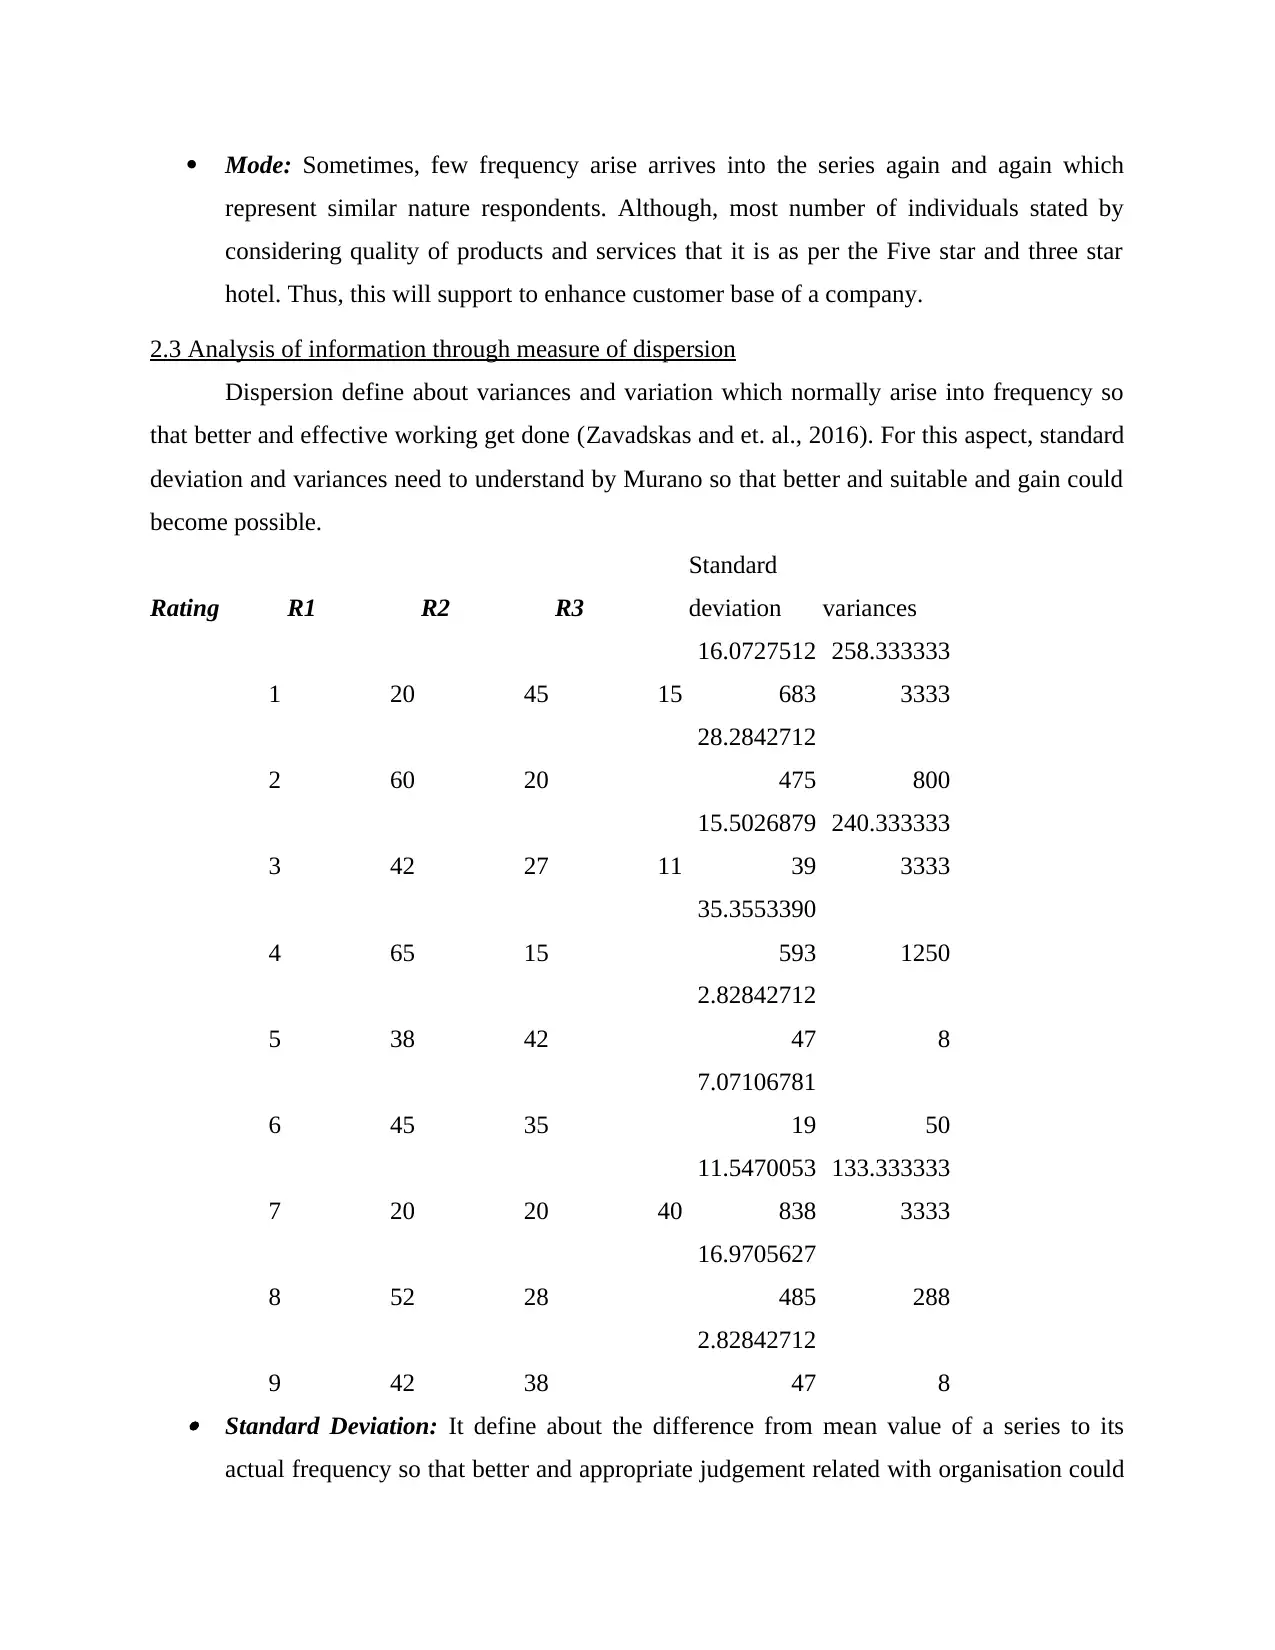
2.3 Analysis of information through measure of dispersion
Dispersion define about variances and variation which normally arise into frequency so
that better and effective working get done (Zavadskas and et. al., 2016). For this aspect, standard
deviation and variances need to understand by Murano so that better and suitable and gain could
become possible.
Rating R1 R2 R3
Standard
deviation variances
1 20 45 15
16.0727512
683
258.333333
3333
2 60 20
28.2842712
475 800
3 42 27 11
15.5026879
39
240.333333
3333
4 65 15
35.3553390
593 1250
5 38 42
2.82842712
47 8
6 45 35
7.07106781
19 50
7 20 20 40
11.5470053
838
133.333333
3333
8 52 28
16.9705627
485 288
9 42 38
2.82842712
47 8 Standard Deviation: It define about the difference from mean value of a series to its
actual frequency so that better and appropriate judgement related with organisation could
represent similar nature respondents. Although, most number of individuals stated by
considering quality of products and services that it is as per the Five star and three star
hotel. Thus, this will support to enhance customer base of a company.
2.3 Analysis of information through measure of dispersion
Dispersion define about variances and variation which normally arise into frequency so
that better and effective working get done (Zavadskas and et. al., 2016). For this aspect, standard
deviation and variances need to understand by Murano so that better and suitable and gain could
become possible.
Rating R1 R2 R3
Standard
deviation variances
1 20 45 15
16.0727512
683
258.333333
3333
2 60 20
28.2842712
475 800
3 42 27 11
15.5026879
39
240.333333
3333
4 65 15
35.3553390
593 1250
5 38 42
2.82842712
47 8
6 45 35
7.07106781
19 50
7 20 20 40
11.5470053
838
133.333333
3333
8 52 28
16.9705627
485 288
9 42 38
2.82842712
47 8 Standard Deviation: It define about the difference from mean value of a series to its
actual frequency so that better and appropriate judgement related with organisation could
be done (Zeng, Chen and Li, 2016). Deviation enable in determine the differences
between various values like some individual of Murano like product and services whether
some not. In this aspect, prices stated that affordable to every group of customer but
mainly management need to made their focus on staff behaviour which need appropriate
and suitable training and development event so that beneficial gain could be estimated.
Variances: Variations arise in every series or frequency distribution table which need to
underpin by management properly so that better and appropriate consideration could be
done. Most number of individual refer Murano to their friends and relatives which
support in make things correct and suitable in nature so that better and efficient gains
become possible.
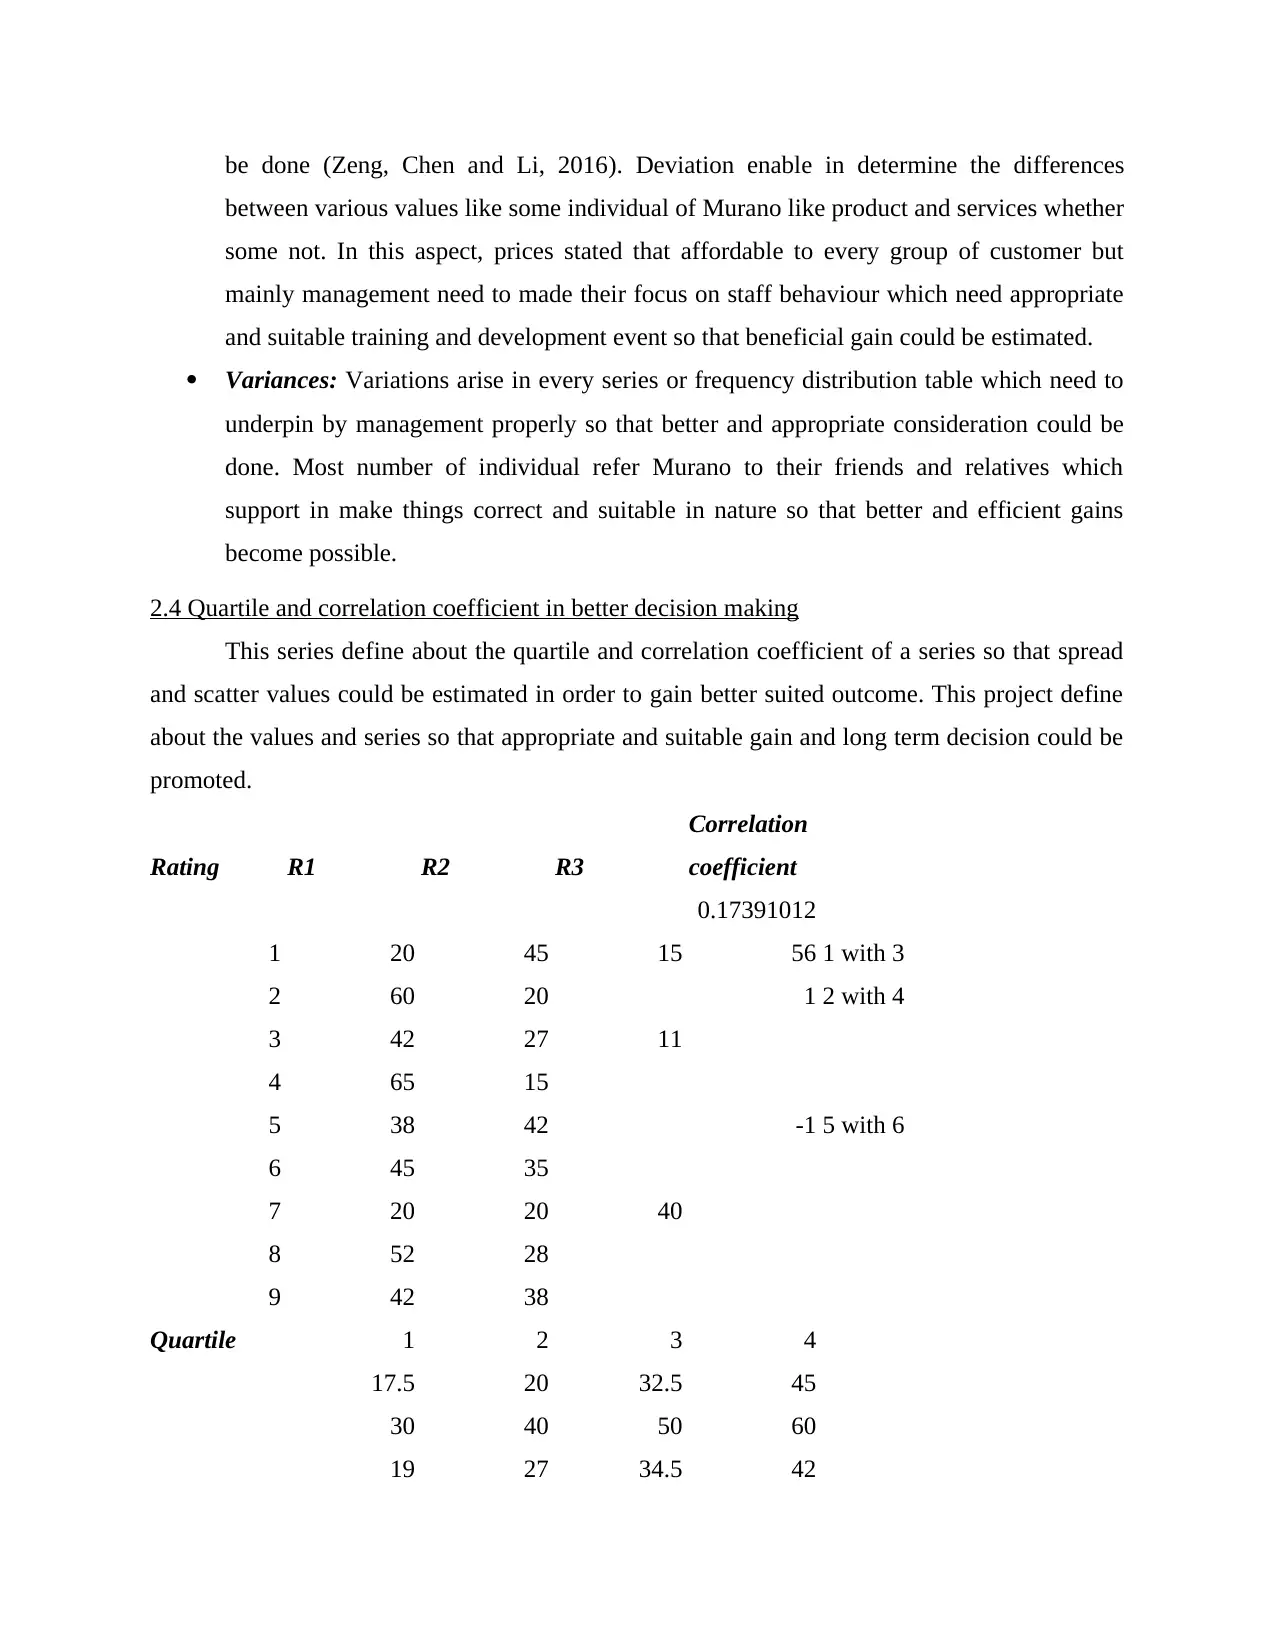
2.4 Quartile and correlation coefficient in better decision making
This series define about the quartile and correlation coefficient of a series so that spread
and scatter values could be estimated in order to gain better suited outcome. This project define
about the values and series so that appropriate and suitable gain and long term decision could be
promoted.
Rating R1 R2 R3
Correlation
coefficient
1 20 45 15
0.17391012
56 1 with 3
2 60 20 1 2 with 4
3 42 27 11
4 65 15
5 38 42 -1 5 with 6
6 45 35
7 20 20 40
8 52 28
9 42 38
Quartile 1 2 3 4
17.5 20 32.5 45
30 40 50 60
19 27 34.5 42
between various values like some individual of Murano like product and services whether
some not. In this aspect, prices stated that affordable to every group of customer but
mainly management need to made their focus on staff behaviour which need appropriate
and suitable training and development event so that beneficial gain could be estimated.
Variances: Variations arise in every series or frequency distribution table which need to
underpin by management properly so that better and appropriate consideration could be
done. Most number of individual refer Murano to their friends and relatives which
support in make things correct and suitable in nature so that better and efficient gains
become possible.
2.4 Quartile and correlation coefficient in better decision making
This series define about the quartile and correlation coefficient of a series so that spread
and scatter values could be estimated in order to gain better suited outcome. This project define
about the values and series so that appropriate and suitable gain and long term decision could be
promoted.
Rating R1 R2 R3
Correlation
coefficient
1 20 45 15
0.17391012
56 1 with 3
2 60 20 1 2 with 4
3 42 27 11
4 65 15
5 38 42 -1 5 with 6
6 45 35
7 20 20 40
8 52 28
9 42 38
Quartile 1 2 3 4
17.5 20 32.5 45
30 40 50 60
19 27 34.5 42
⊘ This is a preview!⊘
Do you want full access?
Subscribe today to unlock all pages.
Trusted by 1+ million students worldwide
27.5 40 52.5 65
39 40 41 42
37.5 40 42.5 45
20 20 30 40
34 40 46 52
39 40 41 42 Correlation coefficient: A major thing which need to do with the study is to determine
the relationship between tow or more variable so that better concerning decision or
judgement lead to carried down in order to enhance and maximise appropriateness.
Relationship between quality and visit stated that Murano deliver excellent quality
products whose reflection get underpin in number of visit by their customers. Thus, twice
in a month on an average individual visit to restaurant with their family or dear ones.
Quartile: A quartile divide various section into some measurable aspects through which
better and appropriate decision making get done. The four major quadrant divide each
and every section properly like smallest to highest, middle one divide two section etc.
Hence, business need to modify their working at some extent to get a tag of Five star
hotel as well as need to deliver proper training so that better efficiency could be manage
and maintain.
TASK 2
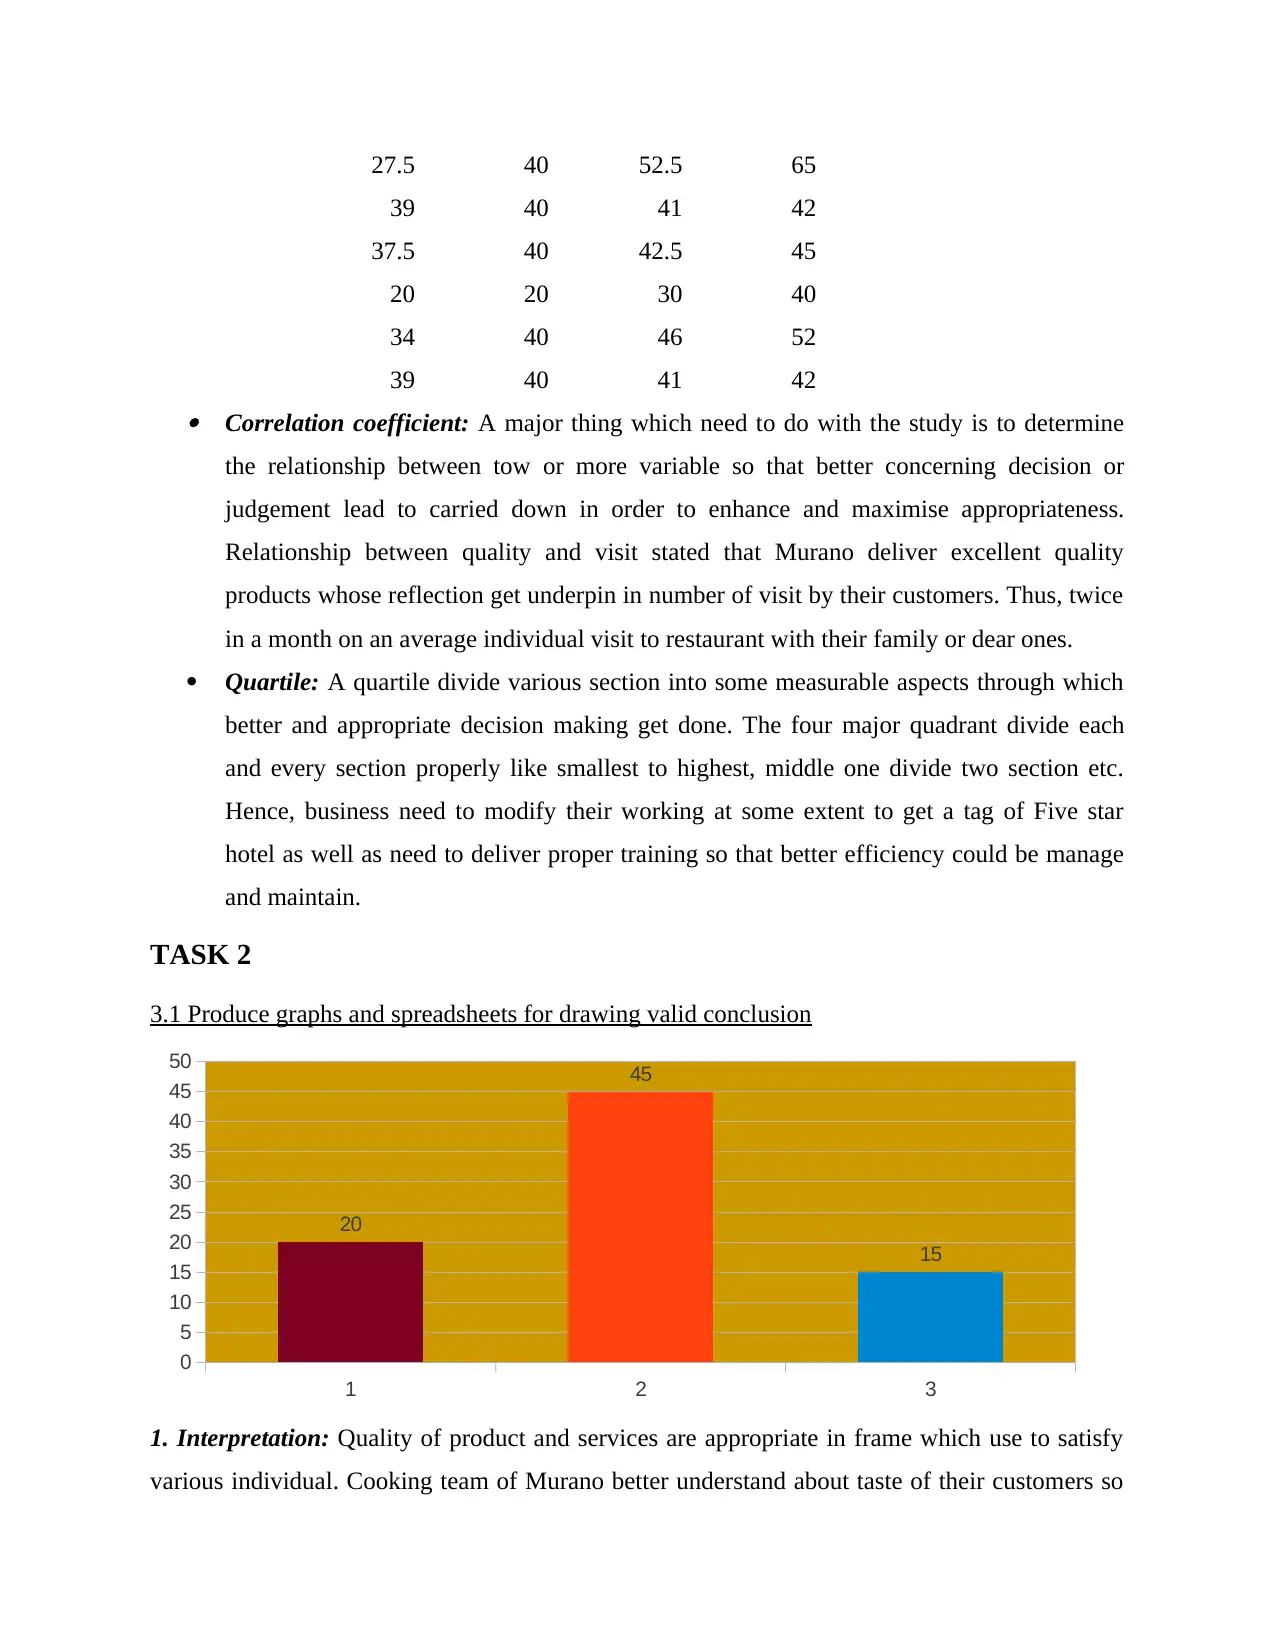
3.1 Produce graphs and spreadsheets for drawing valid conclusion
1 2 3
0
5
10
15
20
25
30
35
40
45
50
20
45
15
1. Interpretation: Quality of product and services are appropriate in frame which use to satisfy
various individual. Cooking team of Murano better understand about taste of their customers so
39 40 41 42
37.5 40 42.5 45
20 20 30 40
34 40 46 52
39 40 41 42 Correlation coefficient: A major thing which need to do with the study is to determine
the relationship between tow or more variable so that better concerning decision or
judgement lead to carried down in order to enhance and maximise appropriateness.
Relationship between quality and visit stated that Murano deliver excellent quality
products whose reflection get underpin in number of visit by their customers. Thus, twice
in a month on an average individual visit to restaurant with their family or dear ones.
Quartile: A quartile divide various section into some measurable aspects through which
better and appropriate decision making get done. The four major quadrant divide each
and every section properly like smallest to highest, middle one divide two section etc.
Hence, business need to modify their working at some extent to get a tag of Five star
hotel as well as need to deliver proper training so that better efficiency could be manage
and maintain.
TASK 2
3.1 Produce graphs and spreadsheets for drawing valid conclusion
1 2 3
0
5
10
15
20
25
30
35
40
45
50
20
45
15
1. Interpretation: Quality of product and services are appropriate in frame which use to satisfy
various individual. Cooking team of Murano better understand about taste of their customers so
Paraphrase This Document
Need a fresh take? Get an instant paraphrase of this document with our AI Paraphraser
that better and efficient gain could be estimated which further facilitate appropriate and effective
gain in order to maximise attracted users.
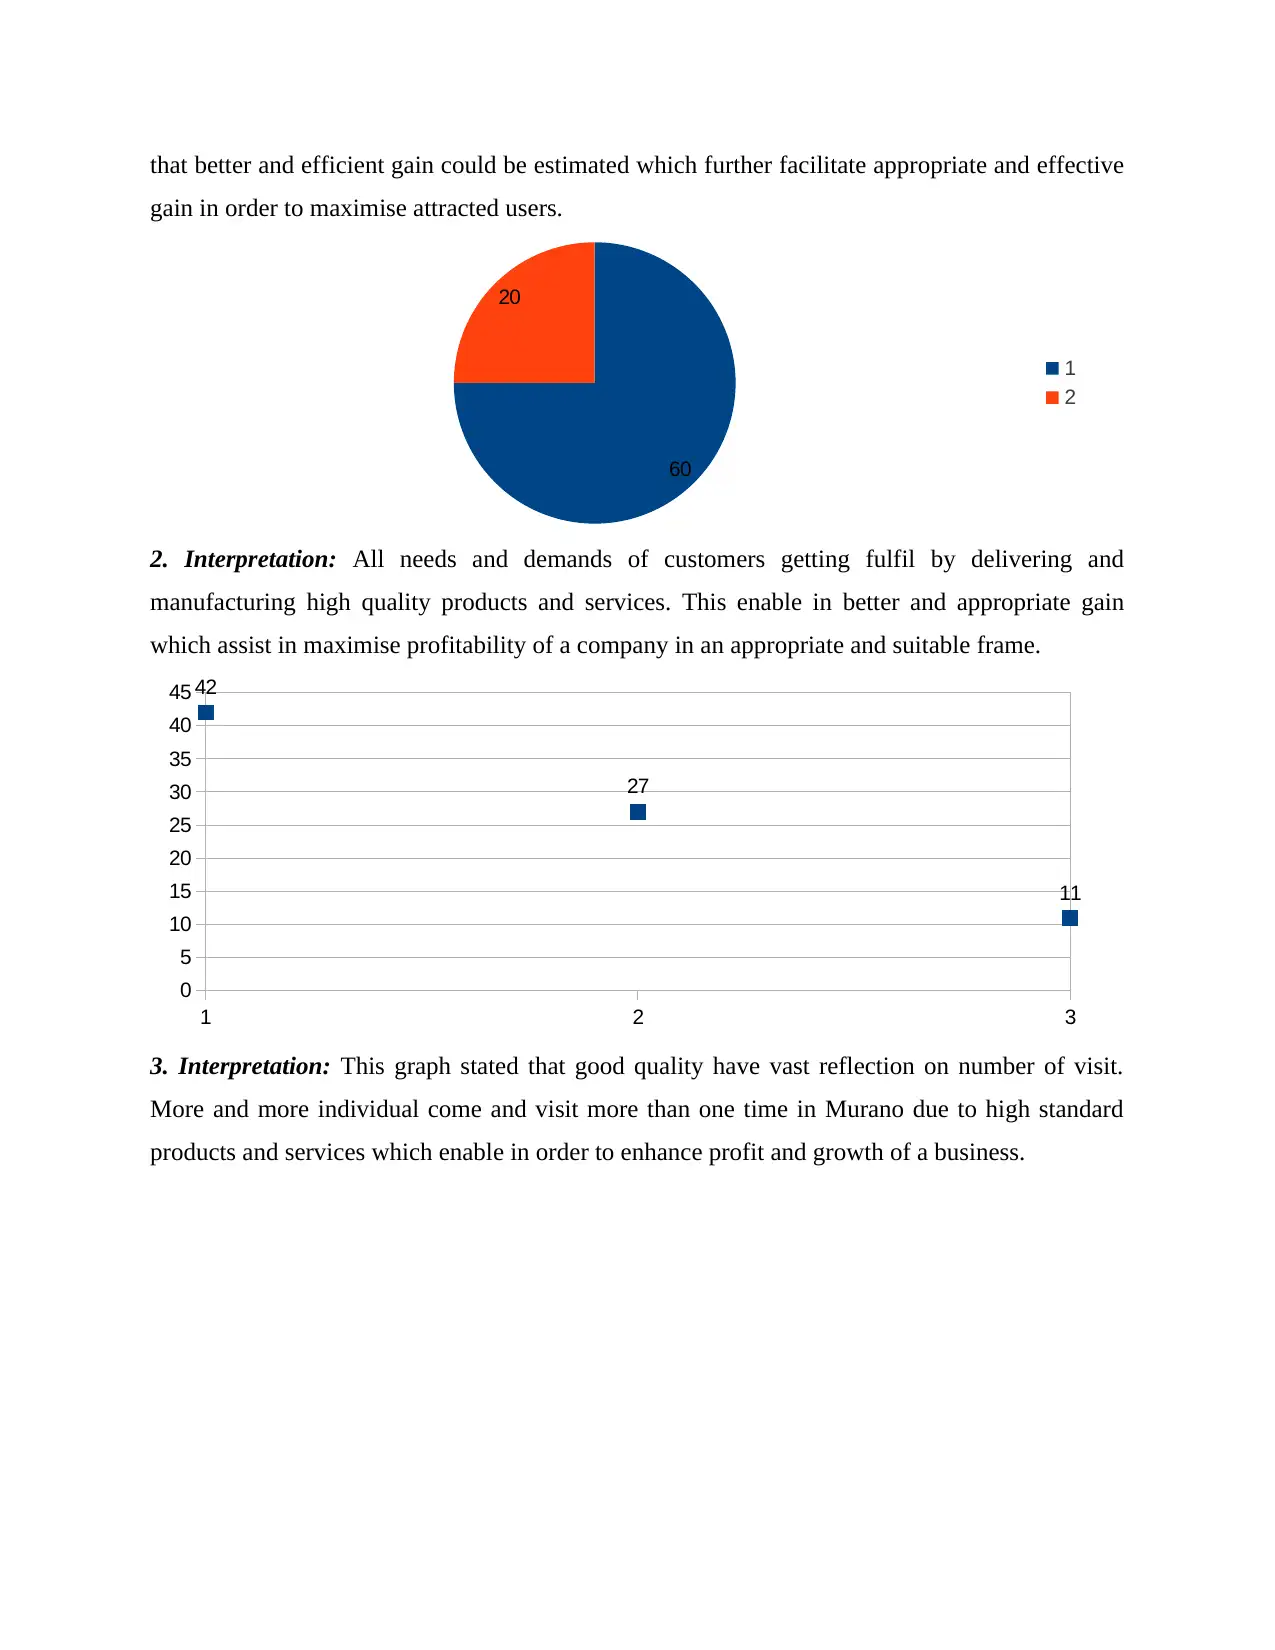
60
20
1
2
2. Interpretation: All needs and demands of customers getting fulfil by delivering and
manufacturing high quality products and services. This enable in better and appropriate gain
which assist in maximise profitability of a company in an appropriate and suitable frame.
1 2 3
0
5
10
15
20
25
30
35
40
45 42
27
11
3. Interpretation: This graph stated that good quality have vast reflection on number of visit.
More and more individual come and visit more than one time in Murano due to high standard
products and services which enable in order to enhance profit and growth of a business.
gain in order to maximise attracted users.
60
20
1
2
2. Interpretation: All needs and demands of customers getting fulfil by delivering and
manufacturing high quality products and services. This enable in better and appropriate gain
which assist in maximise profitability of a company in an appropriate and suitable frame.
1 2 3
0
5
10
15
20
25
30
35
40
45 42
27
11
3. Interpretation: This graph stated that good quality have vast reflection on number of visit.
More and more individual come and visit more than one time in Murano due to high standard
products and services which enable in order to enhance profit and growth of a business.
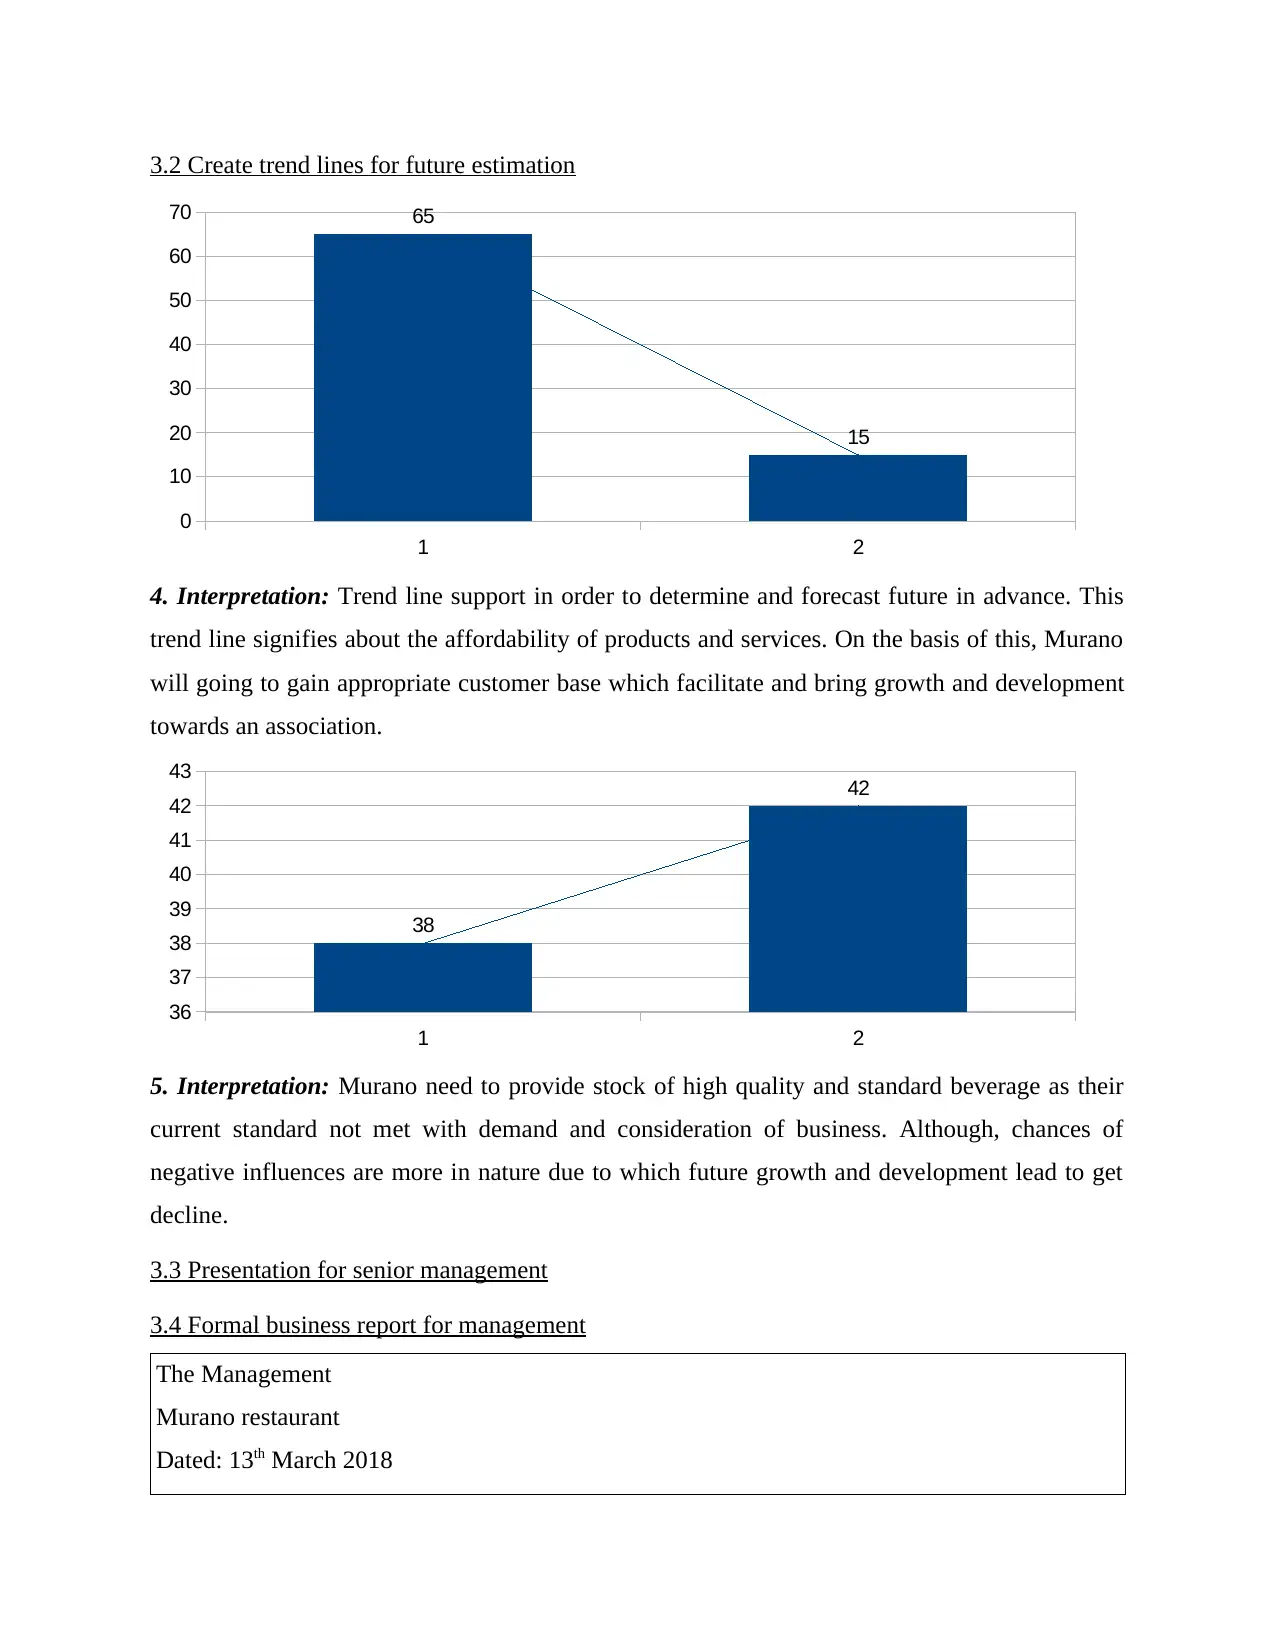
3.2 Create trend lines for future estimation
1 2
0
10
20
30
40
50
60
70 65
15
4. Interpretation: Trend line support in order to determine and forecast future in advance. This
trend line signifies about the affordability of products and services. On the basis of this, Murano
will going to gain appropriate customer base which facilitate and bring growth and development
towards an association.
1 2
36
37
38
39
40
41
42
43
38
42
5. Interpretation: Murano need to provide stock of high quality and standard beverage as their
current standard not met with demand and consideration of business. Although, chances of
negative influences are more in nature due to which future growth and development lead to get
decline.
3.3 Presentation for senior management
3.4 Formal business report for management
The Management
Murano restaurant
Dated: 13th March 2018
1 2
0
10
20
30
40
50
60
70 65
15
4. Interpretation: Trend line support in order to determine and forecast future in advance. This
trend line signifies about the affordability of products and services. On the basis of this, Murano
will going to gain appropriate customer base which facilitate and bring growth and development
towards an association.
1 2
36
37
38
39
40
41
42
43
38
42
5. Interpretation: Murano need to provide stock of high quality and standard beverage as their
current standard not met with demand and consideration of business. Although, chances of
negative influences are more in nature due to which future growth and development lead to get
decline.
3.3 Presentation for senior management
3.4 Formal business report for management
The Management
Murano restaurant
Dated: 13th March 2018
⊘ This is a preview!⊘
Do you want full access?
Subscribe today to unlock all pages.
Trusted by 1+ million students worldwide
1 out of 17
Related Documents


Your All-in-One AI-Powered Toolkit for Academic Success.
+13062052269
info@desklib.com
Available 24*7 on WhatsApp / Email
![[object Object]](/_next/static/media/star-bottom.7253800d.svg)
Unlock your academic potential
Copyright © 2020–2026 A2Z Services. All Rights Reserved. Developed and managed by ZUCOL.