Business Decision Making Assignment: Data Analysis and Report
VerifiedAdded on 2020/01/23
|51
|6699
|174
Homework Assignment
AI Summary
This assignment delves into the core principles of business decision-making, using Kitchen Design Ltd as a case study. It begins with a comprehensive overview of data collection methods, differentiating between primary and secondary data, and exploring various sources and techniques. The assignment emphasizes survey methodology, including questionnaire design and sampling techniques, with a focus on both probabilistic and non-probabilistic sampling. It then progresses to data analysis, encompassing the summarization of sales data, the application of mean, mode, and median, dispersion measures, and the computation of quartiles, percentiles, and correlation coefficients. Furthermore, the assignment covers graphical presentations, trend line forecasting, business presentations, and formal business report writing. It also addresses the use of information processing tools for inventory management, the creation of a project plan with a critical path, and the examination of project viability through capital budgeting, providing a holistic approach to business decision-making processes.

BUSINESS DECISION MAKING
Paraphrase This Document
Need a fresh take? Get an instant paraphrase of this document with our AI Paraphraser
INTRODUCTION...........................................................................................................................4
1.1 Collection of primary and secondary data ............................................................................4
1.2 Survey methodology and sampling used in research.............................................................5
1.3 Designing of questionnaire ...................................................................................................6
TASK 2............................................................................................................................................7
2.1 Summarizing 12 month sales of two main lines of Kitchen Designs....................................7
......................................................................................................................................................8
2.2 Analyzing the results of mean, mode and median ................................................................8
2.3 Assessing measures of dispersion..........................................................................................9
2.4 Computation of quartile, percentile and correlation co-efficient ........................................11
TASK 3..........................................................................................................................................13
3.1 Graphical presentations .......................................................................................................13
3.2 Trend line for forecasting future .........................................................................................20
3.3 Business presentation...........................................................................................................24
3.4 Formal business report ........................................................................................................41
TASK 4..........................................................................................................................................42
4.1 Information processing tool to manage inventory...............................................................42
4.2 Preparation of project plan stating critical path ..................................................................43
........................................................................................................................................................44
4.3 Examining the viability of the project through capital budgeting.......................................45
CONCLUSION ............................................................................................................................47
REFERENCES..............................................................................................................................48
INTRODUCTION
In the corporate sector, the role and responsibilities of the managers got increased over
the years as they devise plans, strategies & decisions and align all these with the set corporate
targets. Moreover, with the changing market conditions, managers also make internal as well as
external analysis and modify plans accordingly to raise long-term profitability and assure
sustainable growth. Kitchen Design Ltd is a well-known contemporary kitchen installation
distributor organization that sells wide range of products & services such as utensils, cabinets &
others. Now, in order to widen its goods portfolio, company is planning to explore opportunities
by introducing bathroom design & equipment. Thus, the present assignment focuses on
demonstrating the knowledge of data collection & storage techniques. Along with this, skills &
tools required to analyse useful business information will be presented for making excellent
business decisions.
TASK 1
1.1 Collection of primary and secondary data
Stage 1
Data is considered as collection of information is mainly gathered from different sources in
order to analyse the subject. By having gathering of information the issues can be understand in
appropriate manner.
Primary data: This collection is mainly considered as data collected at first time. It means
through questionnaire, interview, etc the information can be gathered in desired manner.
Quantitative: It is a data which present numerical presentation of information in order to
understand the fact and figures.
Qualitative: Unlike the above, this data set refers to the collection of that information
that cannot be transformed into numerical and statistical form.
From the survey via question, quantitative set of data can be gathered about consumer’s
economic position so as to evaluate their payment ability, which assists Kitchen Design Ltd in
pricing decisions. However, on the other side, qualitative performance can be analyze by
⊘ This is a preview!⊘
Do you want full access?
Subscribe today to unlock all pages.
Trusted by 1+ million students worldwide
gathering information through survey to assess consumer satisfaction level, quality of goods and
service delivery, consumer complaint handling system and others.
Stage 2
Secondary data: It is referred as information which is collected through previous studies
and data collection. Sources like books, journals and other study materials can be used for data
collection.
Internal data, as name implies, this data are available inside the organization and consists
of annual accounts, cost sheets, business reports, final accounts and so on.
External data, in opposed to above, this are available outside the organization like
industrial reports, journal articles, website information, corporate publications and others.
Here, with the stated scenario, Kitchen Design Ltd can collects internal information from
the annual records, sales and profitability records, financial statement and so on and examine
their operational efficiency and performance as well. However, externally, it can utilize
competitors reports, historical published articles and website information as well for taking better
decisions.
Primary data refers to those which are gathered by scholar for the first time with the aim
to address research issue or purpose. Such database is highly effectual which in turn offers clear
and specific information in accordance with the problem which is going to be investigated.
There are several methods that can be undertaken by scholar for the collection of primary data
namely interview, survey, observation, focus group etc (Prada-Ramallal, Takkouche and
Figueiras, 2016). Secondary data implies for the one which has already been gathered and
published by other scholars. Books, journals and scholarly articles are the main secondary
sources that can be undertaken by scholar for the collection of secondary data (Van
Nieuwenhuysen and et.al, 2016).
Stage 3
Data collection is a process of gathering sufficient and enough amount of information
from various sources which aims at selecting the most suitable action from various course of
alternatives. Observation, interviews, questionnaire, focus groups, experiment etc. are the
methods available to the analysts for the data collection process.
On the basis of cited case situation, Kitchen Design Ltd offers unique goods, utensils and
cabinets to the customers. Now, with the aim to enhance productivity and profitability business
Paraphrase This Document
Need a fresh take? Get an instant paraphrase of this document with our AI Paraphraser
unit is planning to offer bathroom equipment or products to the customers. The rationale behind
this, with the rise in disposable income, now living standard of people increased with the very
high pace. Hence, in this context, business entity has chance to capitalize such opportunities and
thereby fulfil organizational aims and objectives (Alexakos and et.al., 2016). In this regard,
researcher has gathered data from both primary and secondary sources to assess customer’s
preferences and attitude towards bathroom equipment in the following way:
Stage 4
With the stated scenario, survey through a questionnaire has been used for data
collection, in which, a web questionnaire has been prepared stating number of open-ended and
close-ended questions to obtain significant amount of data set.
Primary data collection: All these methods are highly effectual which in turn enables firm to
gather suitable primary data. In this, to get information about customer’s needs, wants and
expectation about bathroom equipment survey will be conducted by scholar. Hence, researcher
will prepare questionnaire by including both close and opened questions in relation to product,
price, place as well as promotion. Thereafter, scholar will send such questionnaire to the 30
customers of Kitchen Design Ltd. In this way, by following such process scholar will collect
primary data.
Secondary data collection: Hence, to gather information about the trend of bathroom
equipment and customer behaviour towards it secondary data has been gathered by scholar
through the means of scholarly articles and government report. Such sources enable researcher to
assess the kind of bathroom equipment that are available in the market. Besides this, data also
has been gathered by the scholar from books to generate information about customer purchasing
behaviour and attitude. By using such information scholar would become able to present fair
solution of issue to the significant level.
Stage 5
Population comprises all the individuals or members of the target group, unlike this;
sample is a selection of a group of individuals from the population which represents the whole
population and from whom data or necessary information will be obtained. In other words,
Subset of the population which having same characteristics is known as sample .There are
number of techniques that are mentioned here as under:
Probabilistic sampling:
Simple random sampling: In this, every individual unit has an equal probability of
selection in the sample called simple random sampling.
Systematic sampling: In this, sample is selected from the random starting point & at a
decided fixed periodical interval which is called sampling interval.
Cluster sampling: Under this method, whole population is segregated into various sub-
parts which are called clusters, thereafter; a simple random sampling is applied to select a
representative sample from the universe.
Stratified sampling: It refers to a technique which divides the entire population into
various groups, termed as strata, afterwards, probability sampling is applied to select units from
each nd every strata.
en.wikipedia.org
Non-probabilistic sampling:
Quota sampling: In this method, for the selection of representative sample, sampling
units are selected from a specific sub-group. For example, choosing a sample of 50 females
under the age group of 25-55 is a kind of quota sampling.
Convenience sampling: As name implies, this method prefers selection of only those
units which are easier to be surveyed for the researcher. For instance, survey of only those people
who visit the retail shops of Kitchen design Ltd.
Judgement sampling: In this, sample is selected on the basis of experts and specialists
opinion; hence, selection may be biased due to subjective aspect.
For primary data collection the sampling will be of 10 employees in order to advance the
outcome effectiveness. Random sampling method is being used in order to have effective collection of data.
Stage 6
Using questionnaire the primary data will be collected. It is considered as a kind of
survey which allows to meet key goals and objectives.
In the present study, to get information about customer’s preference simple random
sampling technique has been used by scholar.
Stage 7
30 customers of Kitchen Design Ltd has been selected by scholar. In this way, by
conducting study on such people scholar can assess the kind of bathroom equipment which is
preferred by the customers.
Overall cost of project at the initial level will be high
By having application of diverse methods the business firm can have sustainable
development and effective data collection.
Stage 8
It is necessary for the researcher to maintain proper security of the data. In this regards,
⊘ This is a preview!⊘
Do you want full access?
Subscribe today to unlock all pages.
Trusted by 1+ million students worldwide
Kitchen Equipments will store data at a secure location. it will be stored in computerized
software so as to protect it from the external uses by password protection. At the same time, Data
protection Legislations also will be followed considering the safety and security issues.
Stage 9
2 Existing employees of the Kitchen design ltd will conduct a survey of the 30 selected
customer group. It will take around two month to complete the data collection procedure and the
budgeted cost for the survey questionnaire is estimated to 200GBP/per month.
1.2 Survey methodology and sampling used in research
Survey methodology: It entails the overall framework or strategy which will be employed
by researcher to conduct investigation. It is the tool which in turn provides high level of
assistance to the researcher in gathering data more effectively and efficiently (Pritchard, Moura
and e Silva, 2016). In order to gather primary data online survey will be conducted by scholar on
30 existing on Kitchen Design Ltd. It is the most effectual method of conducting which in turn
provides high level of assistance to the researcher in gather data within the suitable time frame.
In this regard, researcher will primarily acquire the mail id of customers and thereby send online
questionnaire to them. Hence, by following all such steps researcher will gather primary data and
thereby presents the extent to which people have interest in relation to purchasing of innovative
bathroom equipment.
Sampling Frame: Subset of the population which having same characteristics is known
as sample. Further, sample selection is one of the main aspects of survey which in turn helps
researcher in conducting investigation in the best possible way (Alyahya and Rowe, 2016).
Moreover, due to having limited time researcher is not in position to conduct investigation on
whole population. Further, limited financial resources are other main aspects that have direct
impact on investigation and its outcome. In this way, sample helps in determining faster results
by saving both time and money. In this regard, by making use of probabilistic and non-
probabilistic techniques researcher can determine suitable sample size. Probabilistic techniques
imply for the one in which each customer of Kitchen Design Ltd gets equal chance to being
selected as sample such as simple random, systematic, stratified and cluster. On the other side,
non-probabilistic may be defined as one in which researcher selects sample by considering the
research aims and objectives namely quota, convenience and judgment etc. In the present study,
Paraphrase This Document
Need a fresh take? Get an instant paraphrase of this document with our AI Paraphraser
to get information about customer’s preference simple random sampling technique has been used
by scholar. Hence, by employing such technique 30 customers of Kitchen Design Ltd has been
selected by scholar. In this way, by conducting study on such people scholar can assess the kind
of bathroom equipment which is preferred by the customers.
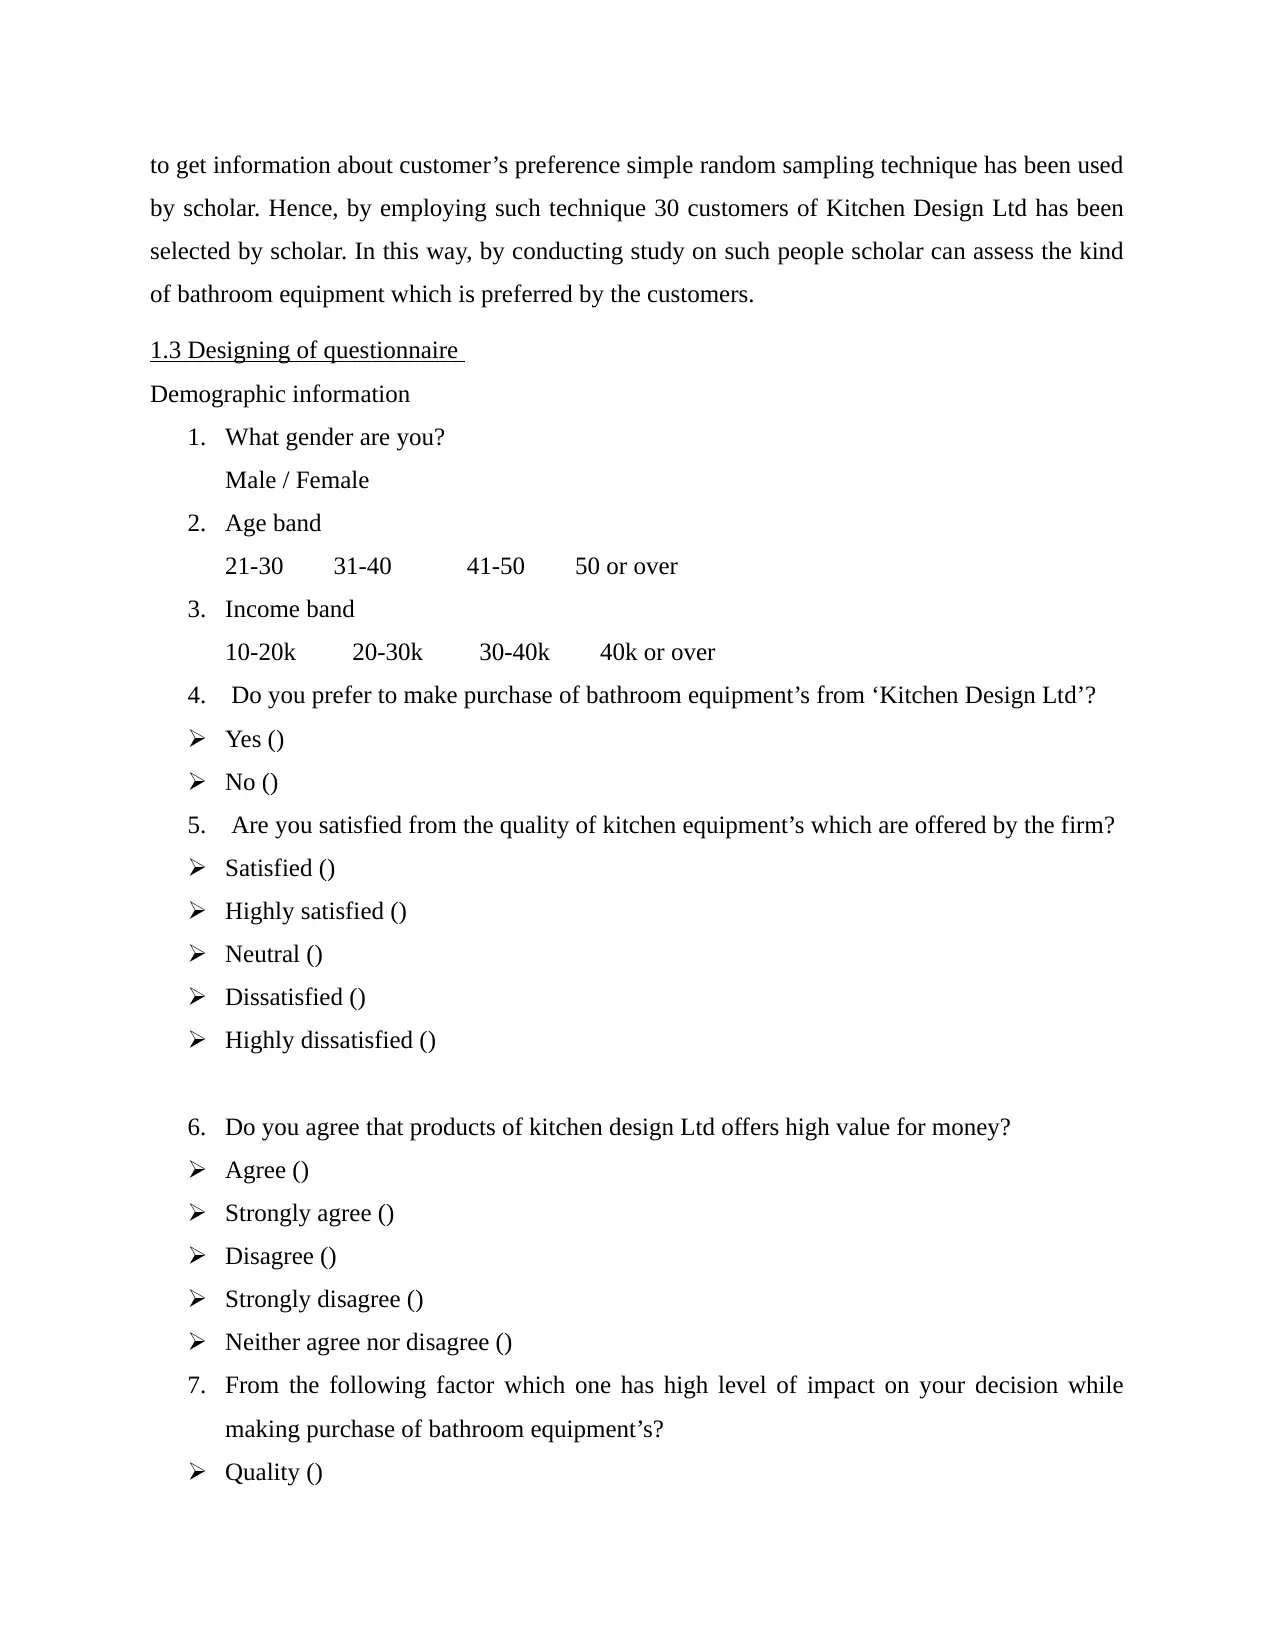
1.3 Designing of questionnaire
Demographic information
1. What gender are you?
Male / Female
2. Age band
21-30 31-40 41-50 50 or over
3. Income band
10-20k 20-30k 30-40k 40k or over
4. Do you prefer to make purchase of bathroom equipment’s from ‘Kitchen Design Ltd’?
Yes ()
No ()
5. Are you satisfied from the quality of kitchen equipment’s which are offered by the firm?
Satisfied ()
Highly satisfied ()
Neutral ()
Dissatisfied ()
Highly dissatisfied ()
6. Do you agree that products of kitchen design Ltd offers high value for money?
Agree ()
Strongly agree ()
Disagree ()
Strongly disagree ()
Neither agree nor disagree ()
7. From the following factor which one has high level of impact on your decision while
making purchase of bathroom equipment’s?
Quality ()
by scholar. Hence, by employing such technique 30 customers of Kitchen Design Ltd has been
selected by scholar. In this way, by conducting study on such people scholar can assess the kind
of bathroom equipment which is preferred by the customers.
1.3 Designing of questionnaire
Demographic information
1. What gender are you?
Male / Female
2. Age band
21-30 31-40 41-50 50 or over
3. Income band
10-20k 20-30k 30-40k 40k or over
4. Do you prefer to make purchase of bathroom equipment’s from ‘Kitchen Design Ltd’?
Yes ()
No ()
5. Are you satisfied from the quality of kitchen equipment’s which are offered by the firm?
Satisfied ()
Highly satisfied ()
Neutral ()
Dissatisfied ()
Highly dissatisfied ()
6. Do you agree that products of kitchen design Ltd offers high value for money?
Agree ()
Strongly agree ()
Disagree ()
Strongly disagree ()
Neither agree nor disagree ()
7. From the following factor which one has high level of impact on your decision while
making purchase of bathroom equipment’s?
Quality ()
Uniqueness ()
Price ()
8. Which promotional means have impact on your awareness and purchasing decision?
Social media ()
Newspaper ()
Television ()
9. Do you want to make your bathroom stylish?
Yes ()
No ()
10. Would you prefer to purchase bathroom equipment’s from Kitchen Design Ltd?
Yes ()
No ()
11. How much are you ready to pay for bathroom equipment’s?
1-2k; 2k-4k 4k-6k 6k- or over
12. Do you want to give any recommendation for further improvement (Kindly specify)
……………………………………………………………………..
TASK 2
2.1 Summarizing 12 month sales of two main lines of Kitchen Designs
Mean: It indicates average sales per month which is measured by dividing the total sales made
by the company over the year.
Median: It reflects the value that is equal to 50% which separate it into two parts that are below
and above mean.
Mode: It shows highest frequency of sales which incur number of times in a reported year.
Mean, mode and median are the most effectual statistical tools which in turn helps in
extracting valuable information from large data set. Moreover, mean provide deeper insight
about average figure of data set. The mode is the figure that occurs most frequent. The median is
the mid value of data set (Özdemir, 2016). In this way, by making evaluation of all such aspects
business entity can take suitable decision which aid in the growth and success of firm.
Sales figures of two main lines of Kitchen Design Ltd from January to December and the
⊘ This is a preview!⊘
Do you want full access?
Subscribe today to unlock all pages.
Trusted by 1+ million students worldwide
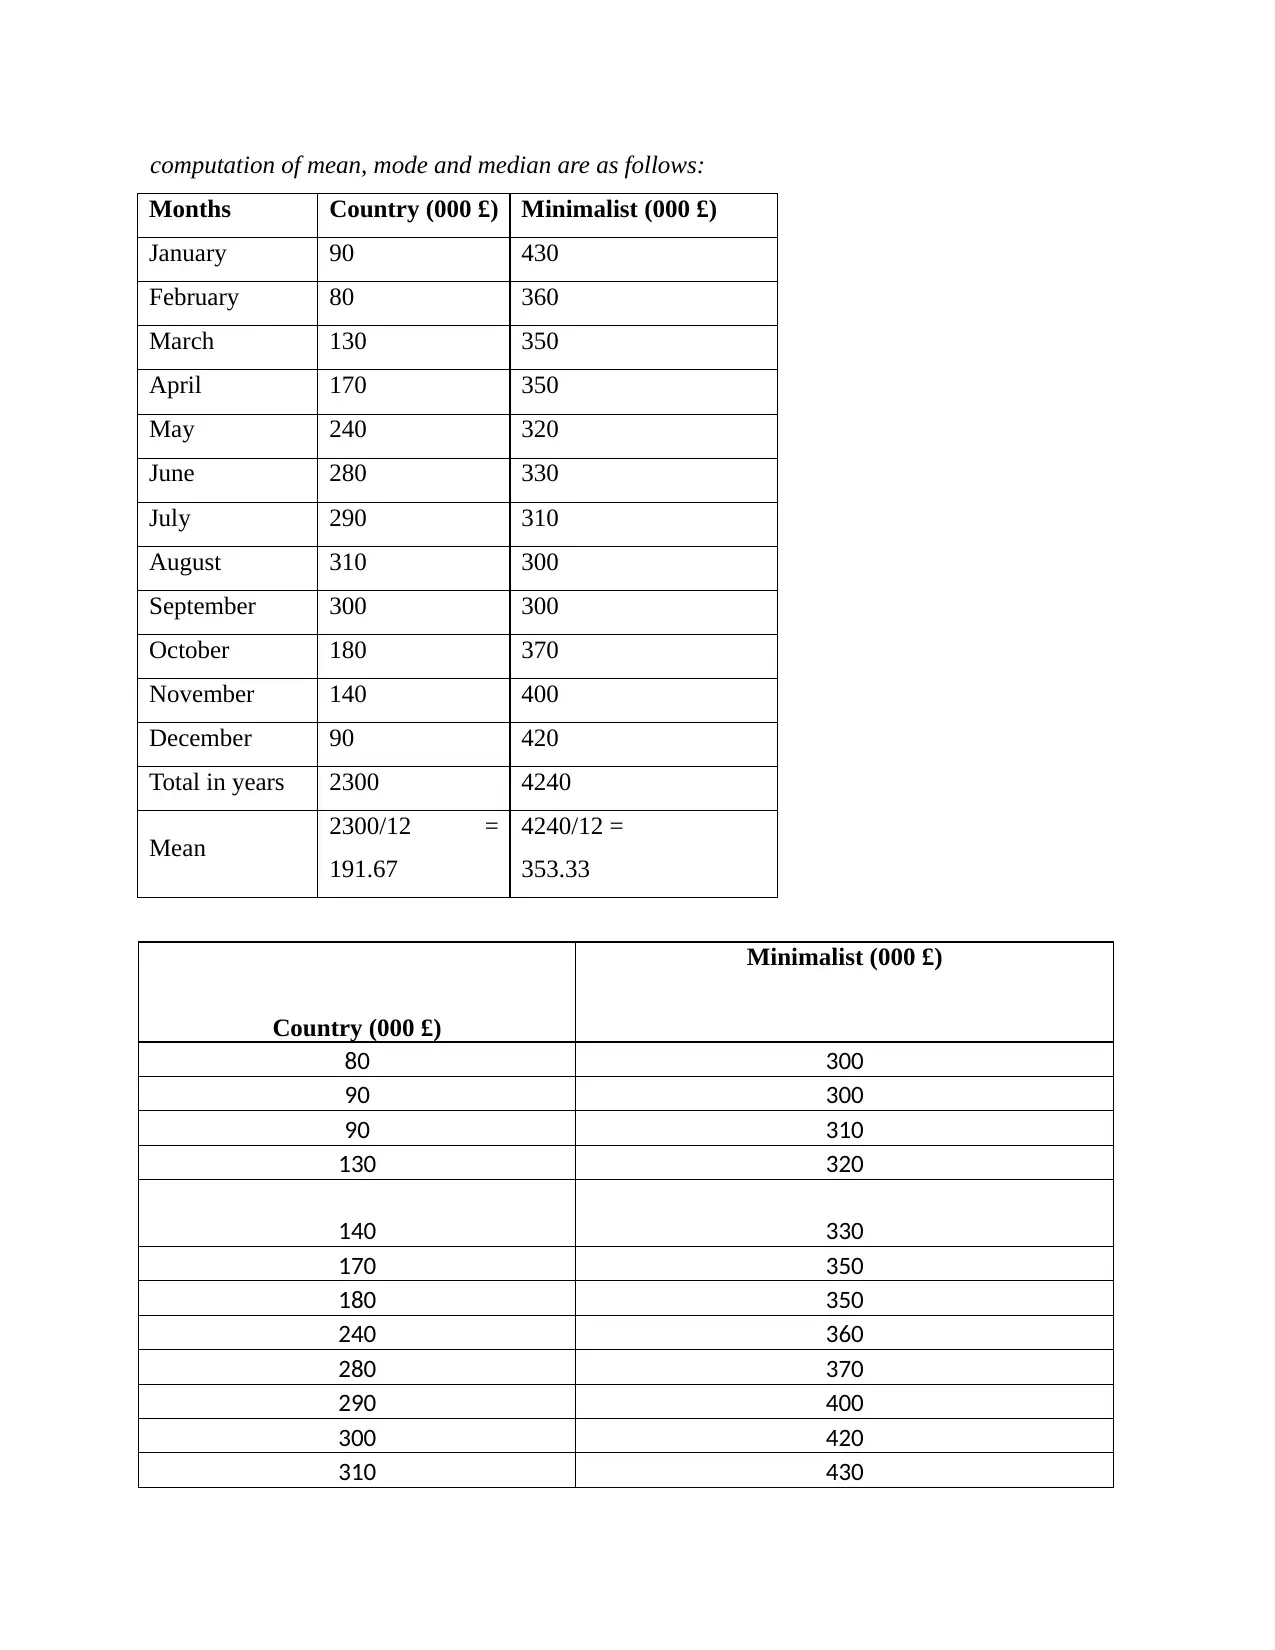
computation of mean, mode and median are as follows:
Months Country (000 £) Minimalist (000 £)
January 90 430
February 80 360
March 130 350
April 170 350
May 240 320
June 280 330
July 290 310
August 310 300
September 300 300
October 180 370
November 140 400
December 90 420
Total in years 2300 4240
Mean 2300/12 =
191.67
4240/12 =
353.33
Country (000 £)
Minimalist (000 £)
80 300
90 300
90 310
130 320
140 330
170 350
180 350
240 360
280 370
290 400
300 420
310 430
Paraphrase This Document
Need a fresh take? Get an instant paraphrase of this document with our AI Paraphraser
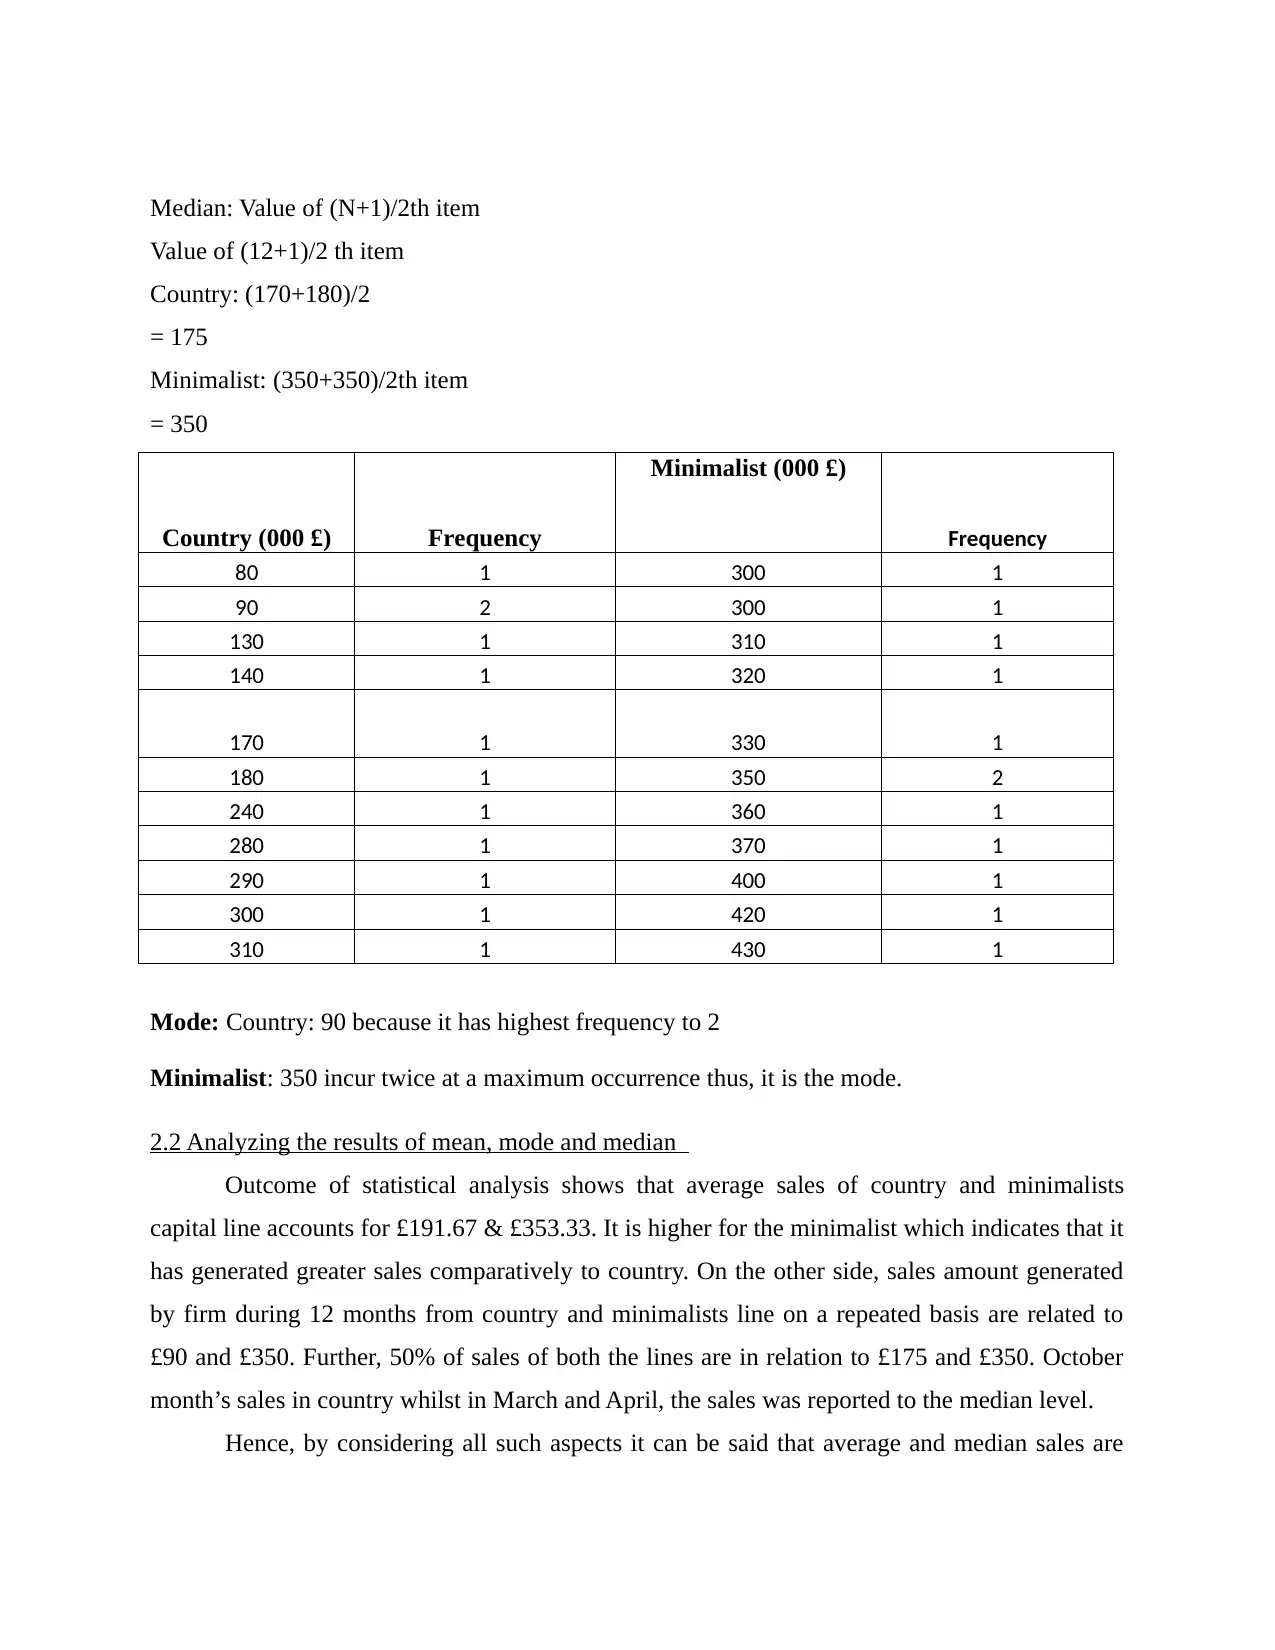
Median: Value of (N+1)/2th item
Value of (12+1)/2 th item
Country: (170+180)/2
= 175
Minimalist: (350+350)/2th item
= 350
Country (000 £) Frequency
Minimalist (000 £)
Frequency
80 1 300 1
90 2 300 1
130 1 310 1
140 1 320 1
170 1 330 1
180 1 350 2
240 1 360 1
280 1 370 1
290 1 400 1
300 1 420 1
310 1 430 1
Mode: Country: 90 because it has highest frequency to 2
Minimalist: 350 incur twice at a maximum occurrence thus, it is the mode.
2.2 Analyzing the results of mean, mode and median
Outcome of statistical analysis shows that average sales of country and minimalists
capital line accounts for £191.67 & £353.33. It is higher for the minimalist which indicates that it
has generated greater sales comparatively to country. On the other side, sales amount generated
by firm during 12 months from country and minimalists line on a repeated basis are related to
£90 and £350. Further, 50% of sales of both the lines are in relation to £175 and £350. October
month’s sales in country whilst in March and April, the sales was reported to the median level.
Hence, by considering all such aspects it can be said that average and median sales are
highly similar (Calculation of mean, mode and median, 2012). Thus, by placing emphasis on
promotional aspects company can enhance sales to the significant level. In addition to this, it can
be stated from analysis customers like to purchase appliances which are offered by Kitchen
Design Ltd.
2.3 Assessing measures of dispersion
Measures of dispersion includes wide range of techniques such as standard deviation,
range and inter-quartile range which in turn helps in assessing the extent to which distribution is
squeezed (Yadav and et.al., 2016). This in turn enables firm to take corrective action and makes
contribution in the achievement of organizational aims and objectives.
Range measures difference between highest and lowest sales value.
Standard deviation measures the difference between each value to the mean value and
find out deviations. It is the best technique to find out the spread or scatter in the series.
Interquartile range measures difference between 3rd and 1st quartile.
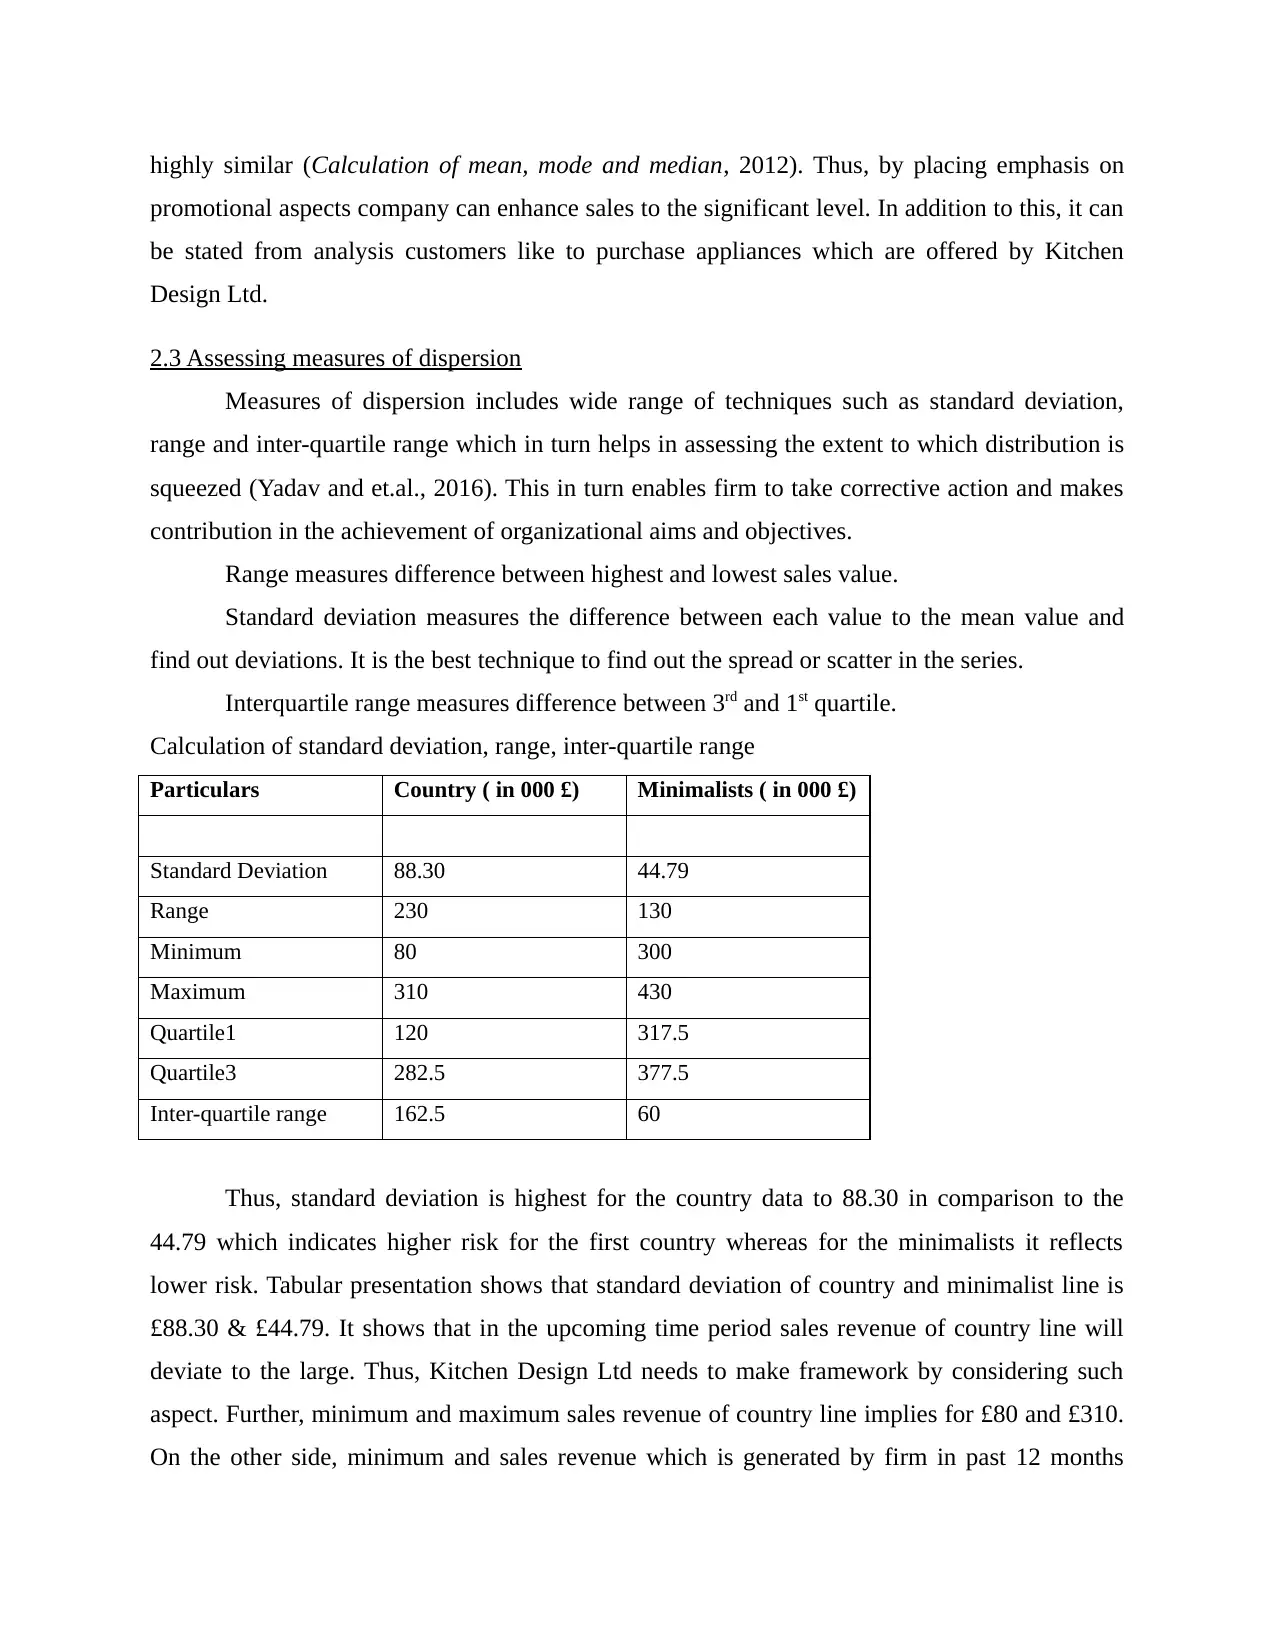
Calculation of standard deviation, range, inter-quartile range
Particulars Country ( in 000 £) Minimalists ( in 000 £)
Standard Deviation 88.30 44.79
Range 230 130
Minimum 80 300
Maximum 310 430
Quartile1 120 317.5
Quartile3 282.5 377.5
Inter-quartile range 162.5 60
Thus, standard deviation is highest for the country data to 88.30 in comparison to the
44.79 which indicates higher risk for the first country whereas for the minimalists it reflects
lower risk. Tabular presentation shows that standard deviation of country and minimalist line is
£88.30 & £44.79. It shows that in the upcoming time period sales revenue of country line will
deviate to the large. Thus, Kitchen Design Ltd needs to make framework by considering such
aspect. Further, minimum and maximum sales revenue of country line implies for £80 and £310.
On the other side, minimum and sales revenue which is generated by firm in past 12 months
promotional aspects company can enhance sales to the significant level. In addition to this, it can
be stated from analysis customers like to purchase appliances which are offered by Kitchen
Design Ltd.
2.3 Assessing measures of dispersion
Measures of dispersion includes wide range of techniques such as standard deviation,
range and inter-quartile range which in turn helps in assessing the extent to which distribution is
squeezed (Yadav and et.al., 2016). This in turn enables firm to take corrective action and makes
contribution in the achievement of organizational aims and objectives.
Range measures difference between highest and lowest sales value.
Standard deviation measures the difference between each value to the mean value and
find out deviations. It is the best technique to find out the spread or scatter in the series.
Interquartile range measures difference between 3rd and 1st quartile.
Calculation of standard deviation, range, inter-quartile range
Particulars Country ( in 000 £) Minimalists ( in 000 £)
Standard Deviation 88.30 44.79
Range 230 130
Minimum 80 300
Maximum 310 430
Quartile1 120 317.5
Quartile3 282.5 377.5
Inter-quartile range 162.5 60
Thus, standard deviation is highest for the country data to 88.30 in comparison to the
44.79 which indicates higher risk for the first country whereas for the minimalists it reflects
lower risk. Tabular presentation shows that standard deviation of country and minimalist line is
£88.30 & £44.79. It shows that in the upcoming time period sales revenue of country line will
deviate to the large. Thus, Kitchen Design Ltd needs to make framework by considering such
aspect. Further, minimum and maximum sales revenue of country line implies for £80 and £310.
On the other side, minimum and sales revenue which is generated by firm in past 12 months
⊘ This is a preview!⊘
Do you want full access?
Subscribe today to unlock all pages.
Trusted by 1+ million students worldwide
1 out of 51
Related Documents


Your All-in-One AI-Powered Toolkit for Academic Success.
+13062052269
info@desklib.com
Available 24*7 on WhatsApp / Email
![[object Object]](/_next/static/media/star-bottom.7253800d.svg)
Unlock your academic potential
Copyright © 2020–2026 A2Z Services. All Rights Reserved. Developed and managed by ZUCOL.