Business Decision Making: Data Analysis and Report for F&F Restaurant
VerifiedAdded on 2020/10/22
|22
|4598
|252
Report
AI Summary
This report provides a comprehensive analysis of business decision-making for the Food for Friends (F&F) restaurant. It begins with an introduction outlining the importance of strategic decisions in a competitive market. The report then details the methodology for collecting both primary and secondary data, including survey design, sampling techniques, and the use of statistical tools for data analysis. The primary data collection involved a survey of 30 customers to assess their preferences, while secondary data analysis focused on financial performance and industry trends. The report presents findings through descriptive statistics, graphical representations, and correlation assessments, highlighting key insights into sales, profit margins, and customer preferences. Furthermore, it explores the application of information processing, project management, and investment appraisal tools in the decision-making process. The analysis provides recommendations for enhancing the restaurant's performance by leveraging customer insights, optimizing promotional strategies, and making informed financial decisions.

Business Decision Making
Paraphrase This Document
Need a fresh take? Get an instant paraphrase of this document with our AI Paraphraser
TABLE OF CONTENTS
INTRODUCTION...........................................................................................................................3
TASK 1............................................................................................................................................3
1.1 Drafting plan for the collection of primary and secondary data set......................................3
1.2 Defining sampling frame and survey methodology in the context of primary investigation 4
1.3 Preparing questionnaire for survey........................................................................................5
TASK 2............................................................................................................................................9
2,1 Analyzing secondary data set for decision making...............................................................9
2.2 Drawing conclusion on the basis of primary data evaluation..............................................10
2.3 Assessing variance and standard deviation regarding sales & profit..................................10
2.4 Quartile, percentile and correlation evaluation of restaurant...............................................10
TASK 3..........................................................................................................................................11
3.1 Graphical presentation.........................................................................................................11
3.2 Assessing future trends using statistical tools and techniques.............................................12
3.3 Presenting findings using tools............................................................................................13
3.4 Preparing formal business report.........................................................................................13
TASK 4..........................................................................................................................................14
4.1 Describing use of information processing tools in decision making...................................14
4.2 Presenting the use of project management tools and software in decision making.............15
4.3 Investment appraisal tools and decision making.................................................................18
CONCLUSION..............................................................................................................................20
REFERENCES..............................................................................................................................21
INTRODUCTION
In the context of business unit, success is highly depends on decisions undertaken by the
managers. Now, stiff competitive situation takes place in each and every sector which in turn
directly impacts organizational growth. Hence, under this situation, manager is required to come
up with innovative ideas and take competent decisions which aid in the profitability of firm. The
present report is based on Food for Friends restaurant which offers dinning services to the
customers. In this, report will provide deeper insight about how primary and secondary data set
helps in assessing preferences and attitude of customers. Further, report also entails survey
methodology and sampling which seems suitable for primary data evaluation. It also depicts the
manner in which statistical, information processing, project management and investment
appraisal techniques can be used for decision making.
TASK 1
1.1 Drafting plan for the collection of primary and secondary data set
Given case situation exhibits that F&F is planning to establish another restaurant in
London. Moreover, now both inbound and outbound tourism level in increasing in London with
the very high pace. Hence, with the motive to attain success and enhance sales as well as
profitability F&F is planning to conduct survey for getting information about product, price,
place & promotion. Company or restaurant unit can achieve success only when it offers quality
and suitable products or services to the customers as per their requirements.
Primary data collection plan
In research, data which is gathered specifically for the first time to meet research aims
and objectives known as primary. There are several tools which can be employed by the scholar
for primary data collection such as survey, observation, interview, focus group etc (García-
Peñalvo and Conde, 2014). Primary data set is highly effectual which in turn helps in addressing
research issues to a great extent. In this, to identify the preferences and attitude of customers
towards restaurant primary data set has been gathered through survey. For the collection of
primary data, following plan has been employed:
⊘ This is a preview!⊘
Do you want full access?
Subscribe today to unlock all pages.
Trusted by 1+ million students worldwide
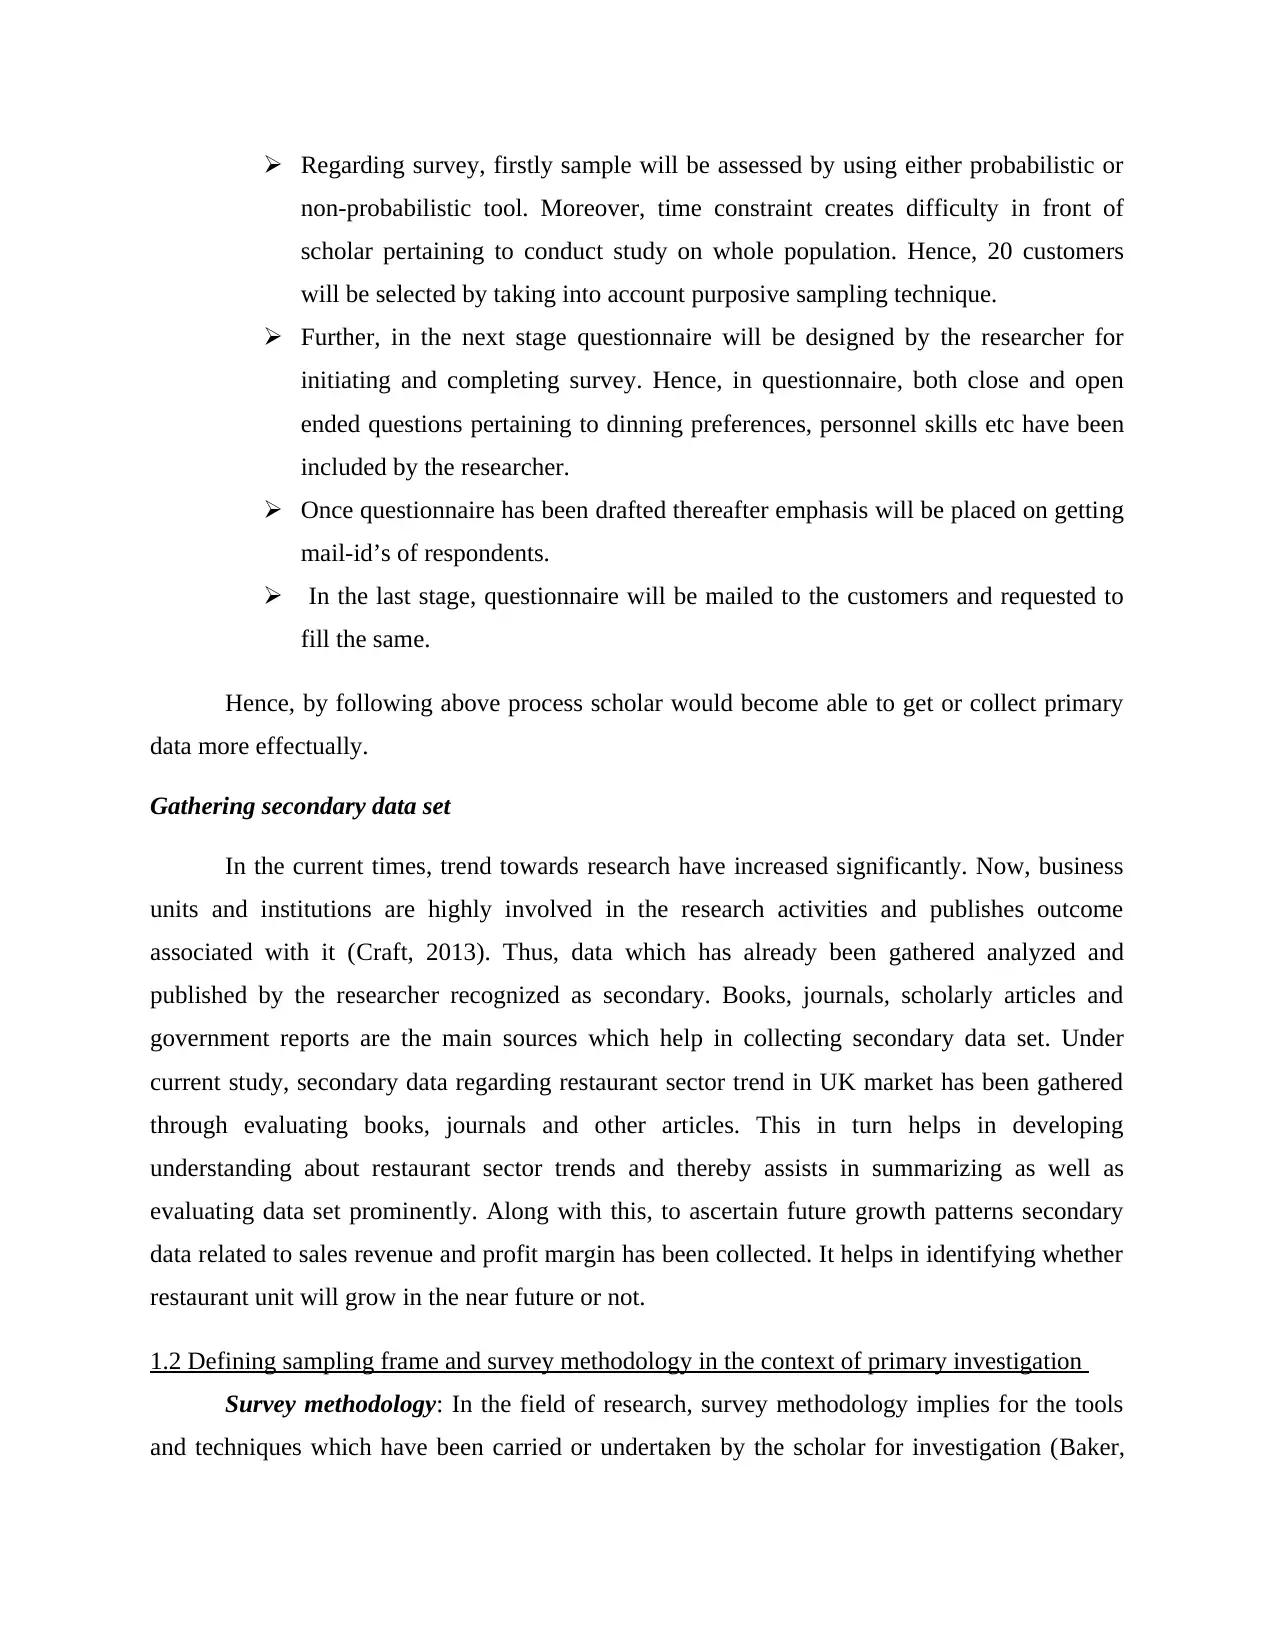
Regarding survey, firstly sample will be assessed by using either probabilistic or
non-probabilistic tool. Moreover, time constraint creates difficulty in front of
scholar pertaining to conduct study on whole population. Hence, 20 customers
will be selected by taking into account purposive sampling technique.
Further, in the next stage questionnaire will be designed by the researcher for
initiating and completing survey. Hence, in questionnaire, both close and open
ended questions pertaining to dinning preferences, personnel skills etc have been
included by the researcher.
Once questionnaire has been drafted thereafter emphasis will be placed on getting
mail-id’s of respondents.
In the last stage, questionnaire will be mailed to the customers and requested to
fill the same.
Hence, by following above process scholar would become able to get or collect primary
data more effectually.
Gathering secondary data set
In the current times, trend towards research have increased significantly. Now, business
units and institutions are highly involved in the research activities and publishes outcome
associated with it (Craft, 2013). Thus, data which has already been gathered analyzed and
published by the researcher recognized as secondary. Books, journals, scholarly articles and
government reports are the main sources which help in collecting secondary data set. Under
current study, secondary data regarding restaurant sector trend in UK market has been gathered
through evaluating books, journals and other articles. This in turn helps in developing
understanding about restaurant sector trends and thereby assists in summarizing as well as
evaluating data set prominently. Along with this, to ascertain future growth patterns secondary
data related to sales revenue and profit margin has been collected. It helps in identifying whether
restaurant unit will grow in the near future or not.
1.2 Defining sampling frame and survey methodology in the context of primary investigation
Survey methodology: In the field of research, survey methodology implies for the tools
and techniques which have been carried or undertaken by the scholar for investigation (Baker,
Paraphrase This Document
Need a fresh take? Get an instant paraphrase of this document with our AI Paraphraser
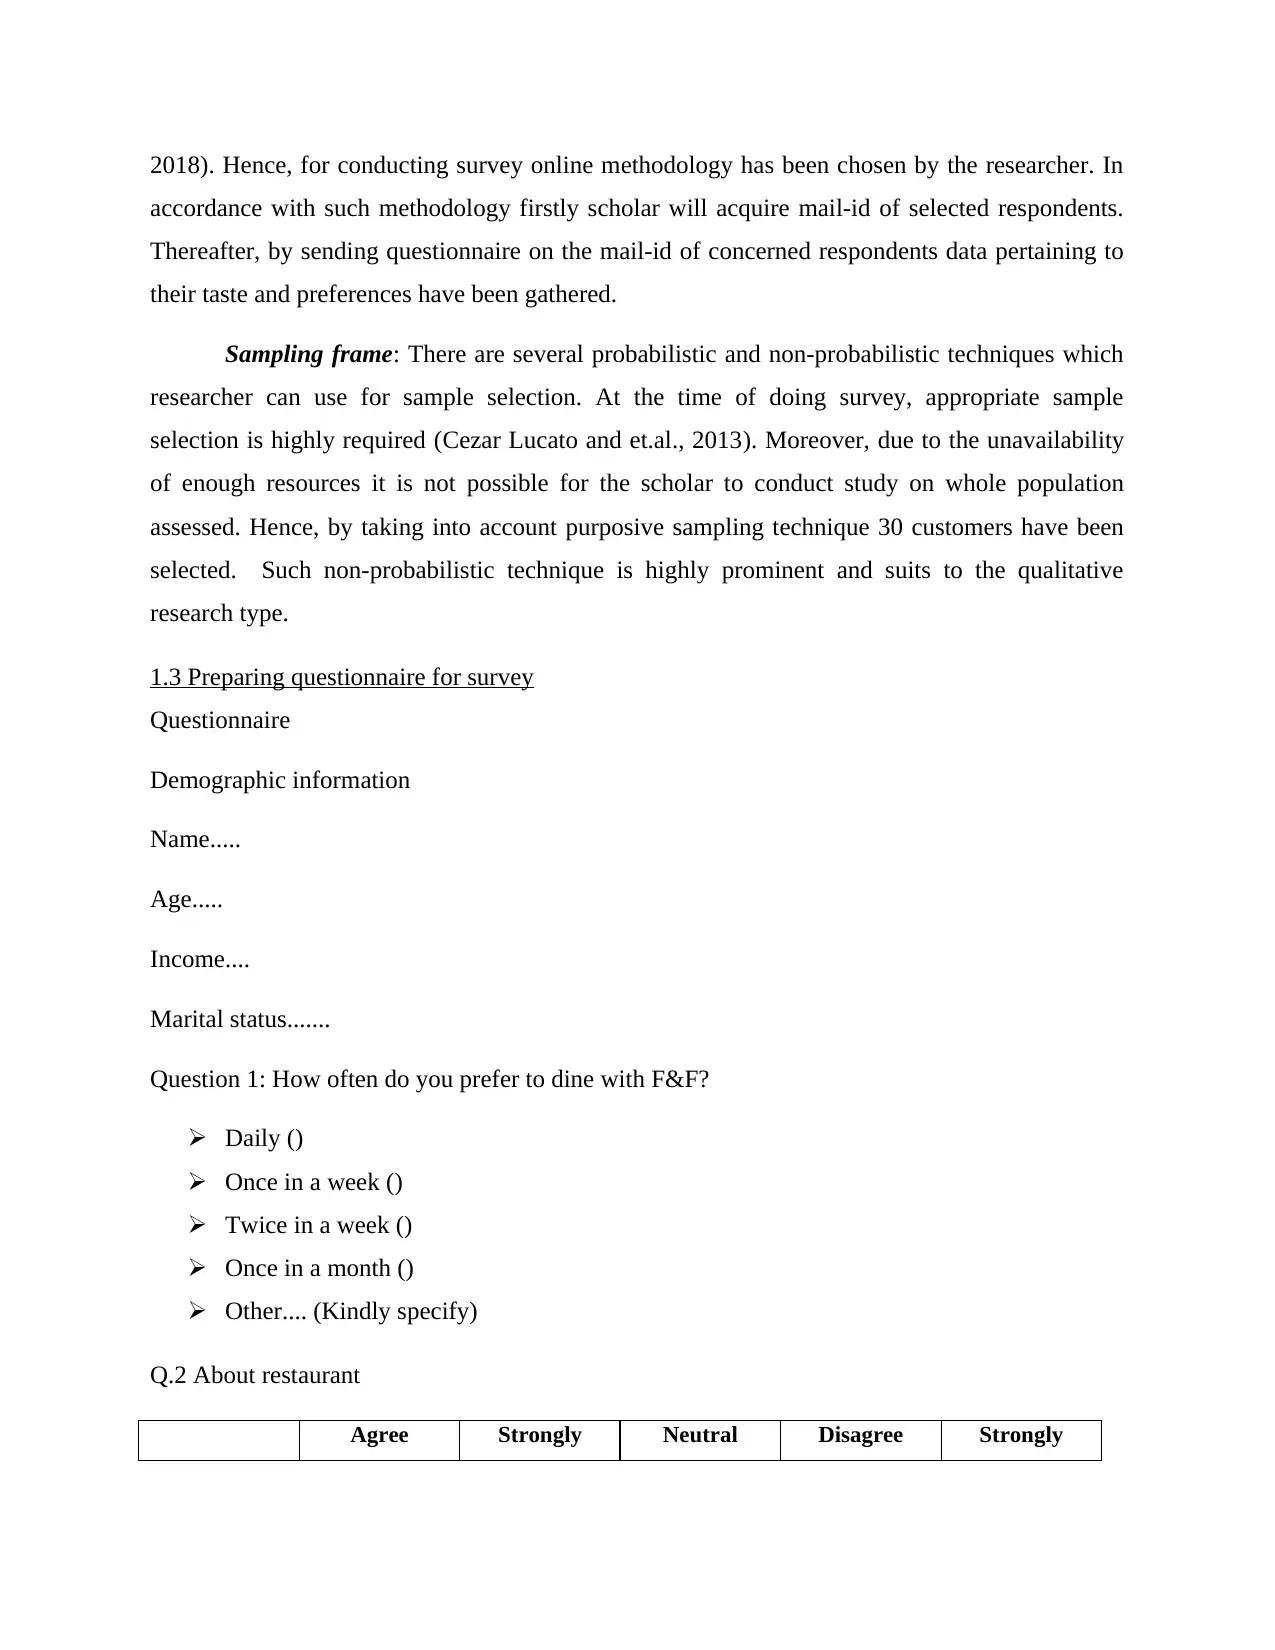
2018). Hence, for conducting survey online methodology has been chosen by the researcher. In
accordance with such methodology firstly scholar will acquire mail-id of selected respondents.
Thereafter, by sending questionnaire on the mail-id of concerned respondents data pertaining to
their taste and preferences have been gathered.
Sampling frame: There are several probabilistic and non-probabilistic techniques which
researcher can use for sample selection. At the time of doing survey, appropriate sample
selection is highly required (Cezar Lucato and et.al., 2013). Moreover, due to the unavailability
of enough resources it is not possible for the scholar to conduct study on whole population
assessed. Hence, by taking into account purposive sampling technique 30 customers have been
selected. Such non-probabilistic technique is highly prominent and suits to the qualitative
research type.
1.3 Preparing questionnaire for survey
Questionnaire
Demographic information
Name.....
Age.....
Income....
Marital status.......
Question 1: How often do you prefer to dine with F&F?
Daily ()
Once in a week ()
Twice in a week ()
Once in a month ()
Other.... (Kindly specify)
Q.2 About restaurant
Agree Strongly Neutral Disagree Strongly
agree disagree
Proper
cleanliness is
maintained
within the
restaurant
Lighting is
good
Music quality
and level is
good
I was served
promptly
Sauces,
utensils and
napkins are of
high quality
Service
quality is good
You are
provided with
the
information
regarding the
speciality of
restaurant in
terms of menu
or dishes.
Q.3 The server
Agree Strongly
agree
Neutral Disagree Strongly
disagree
⊘ This is a preview!⊘
Do you want full access?
Subscribe today to unlock all pages.
Trusted by 1+ million students worldwide
Server is
attentive and
available as
per
requirement
All the serves
are polite and
having ability
to understand
requirements
Having ability
to respond
quickly and in
a satisfactorily
manner
Personnel are
patient while
taking order
Q.4 The food
Poor Average Good Excellent
Give rating in
relation to the
meal served
Temperature
of the food
offered
Kindly rate
food on the
basis of value
for money
aspect
Paraphrase This Document
Need a fresh take? Get an instant paraphrase of this document with our AI Paraphraser
Specify
quality of food
under four
categories
Q.4Do you agree F&F offers quality dinning services at affordable prices?
Agree ()
Strongly agree ()
Neutral ()
Disagree ()
Strongly disagree ()
Q.5 Which restaurant comes in your mind first while taking decision about dinning services?
Food for Friends ()
Balti palace ()
Murano ()
Blackfrias ()
Q.6Do you prefer to recommend F&F restaurant to friends and family members?
Yes ()
No ()
Q.7 Which promotional tool has greater influence on your decision making?
Facebook ()
Twitter ()
All social media tools: Facebook, Twitter & Instagram ()
TV advertisements ()
Newspaper and magazines ()
Q.8 Kindly gives recommendations for further improvements
................................................................................................
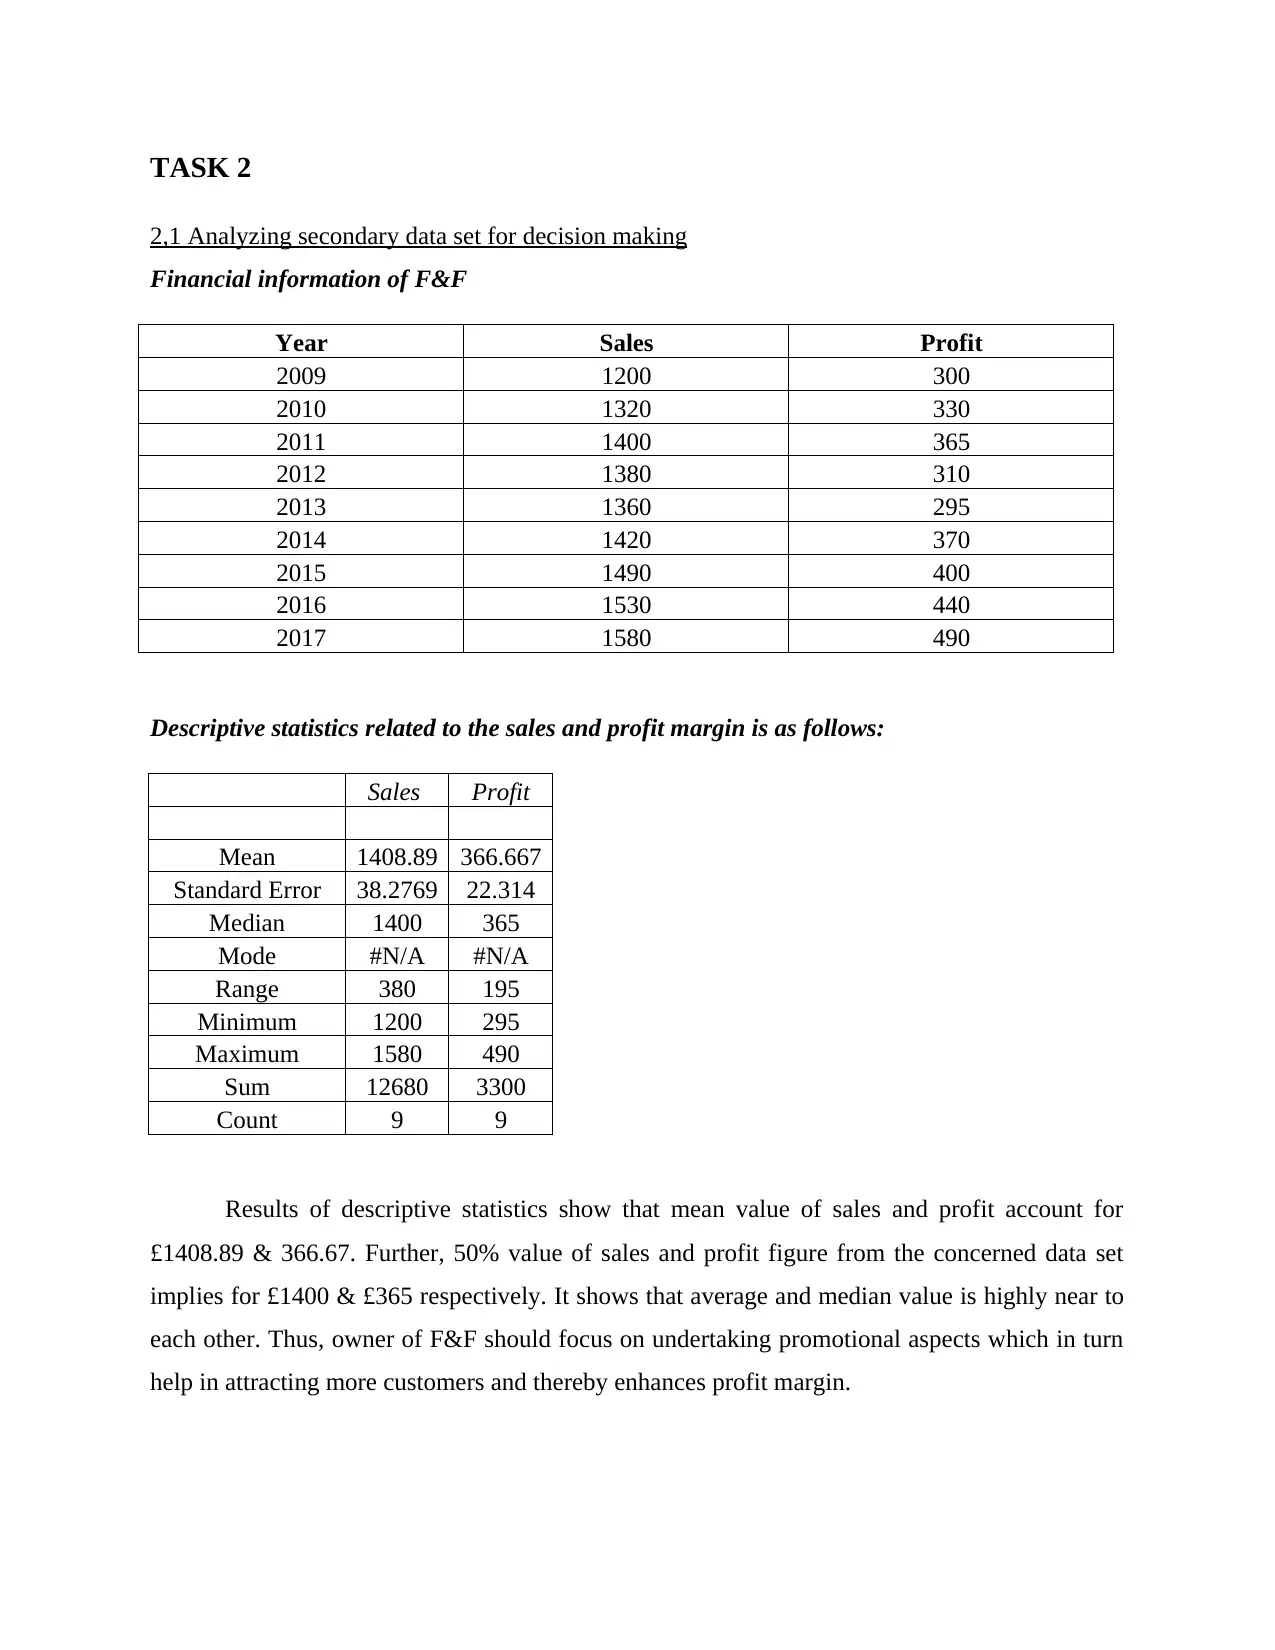
TASK 2
2,1 Analyzing secondary data set for decision making
Financial information of F&F
Year Sales Profit
2009 1200 300
2010 1320 330
2011 1400 365
2012 1380 310
2013 1360 295
2014 1420 370
2015 1490 400
2016 1530 440
2017 1580 490
Descriptive statistics related to the sales and profit margin is as follows:
Sales Profit
Mean 1408.89 366.667
Standard Error 38.2769 22.314
Median 1400 365
Mode #N/A #N/A
Range 380 195
Minimum 1200 295
Maximum 1580 490
Sum 12680 3300
Count 9 9
Results of descriptive statistics show that mean value of sales and profit account for
£1408.89 & 366.67. Further, 50% value of sales and profit figure from the concerned data set
implies for £1400 & £365 respectively. It shows that average and median value is highly near to
each other. Thus, owner of F&F should focus on undertaking promotional aspects which in turn
help in attracting more customers and thereby enhances profit margin.
⊘ This is a preview!⊘
Do you want full access?
Subscribe today to unlock all pages.
Trusted by 1+ million students worldwide
2.2 Drawing conclusion on the basis of primary data evaluation
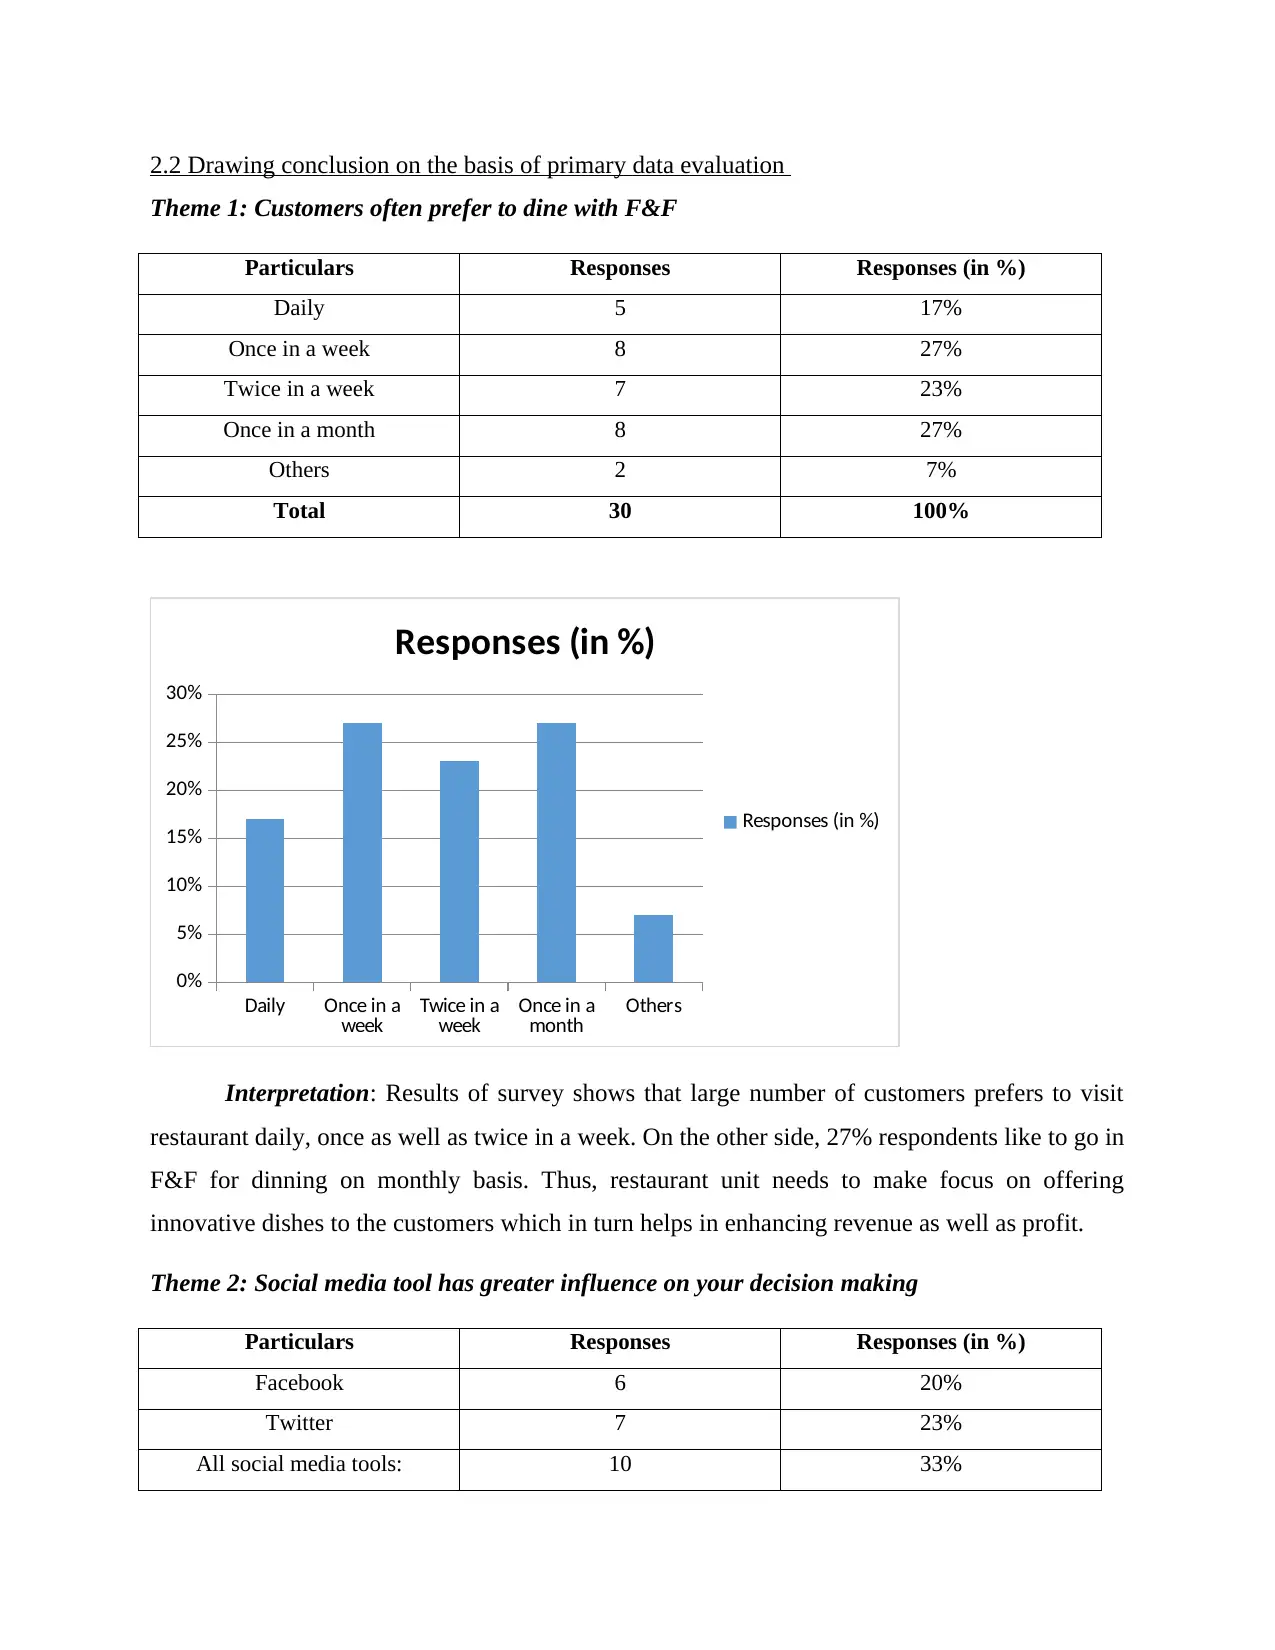
Theme 1: Customers often prefer to dine with F&F
Particulars Responses Responses (in %)
Daily 5 17%
Once in a week 8 27%
Twice in a week 7 23%
Once in a month 8 27%
Others 2 7%
Total 30 100%
Daily Once in a
week Twice in a
week Once in a
month Others
0%
5%
10%
15%
20%
25%
30%
Responses (in %)
Responses (in %)
Interpretation: Results of survey shows that large number of customers prefers to visit
restaurant daily, once as well as twice in a week. On the other side, 27% respondents like to go in
F&F for dinning on monthly basis. Thus, restaurant unit needs to make focus on offering
innovative dishes to the customers which in turn helps in enhancing revenue as well as profit.
Theme 2: Social media tool has greater influence on your decision making
Particulars Responses Responses (in %)
Facebook 6 20%
Twitter 7 23%
All social media tools: 10 33%
Paraphrase This Document
Need a fresh take? Get an instant paraphrase of this document with our AI Paraphraser
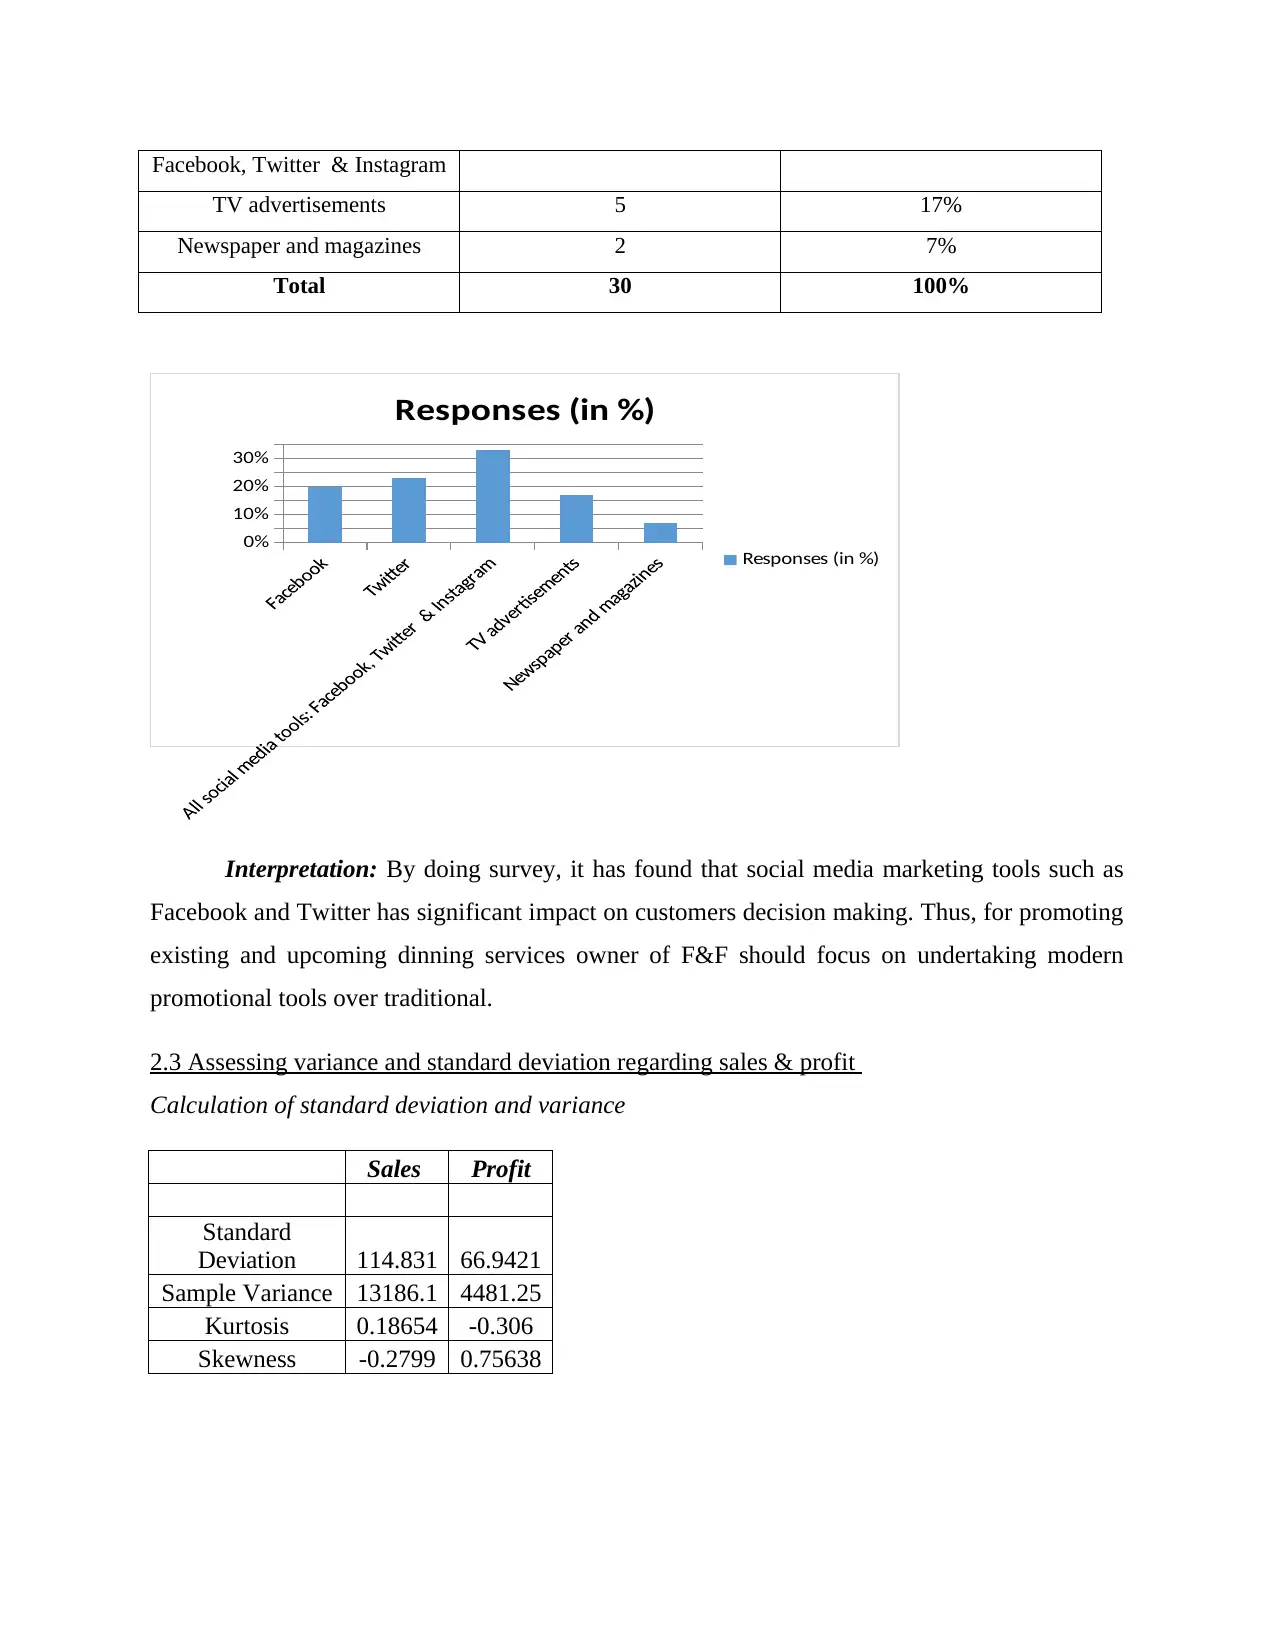
Facebook, Twitter & Instagram
TV advertisements 5 17%
Newspaper and magazines 2 7%
Total 30 100%
0%
10%
20%
30%
Responses (in %)
Responses (in %)
Interpretation: By doing survey, it has found that social media marketing tools such as
Facebook and Twitter has significant impact on customers decision making. Thus, for promoting
existing and upcoming dinning services owner of F&F should focus on undertaking modern
promotional tools over traditional.
2.3 Assessing variance and standard deviation regarding sales & profit
Calculation of standard deviation and variance
Sales Profit
Standard
Deviation 114.831 66.9421
Sample Variance 13186.1 4481.25
Kurtosis 0.18654 -0.306
Skewness -0.2799 0.75638
By applying the tools of statistics it has found that in the near future mean value of sales
such as £1408.89 will deviate with the figure of £114.8 significantly. In addition to this, standard
deviation pertaining to profit implies for £66.94 respectively.
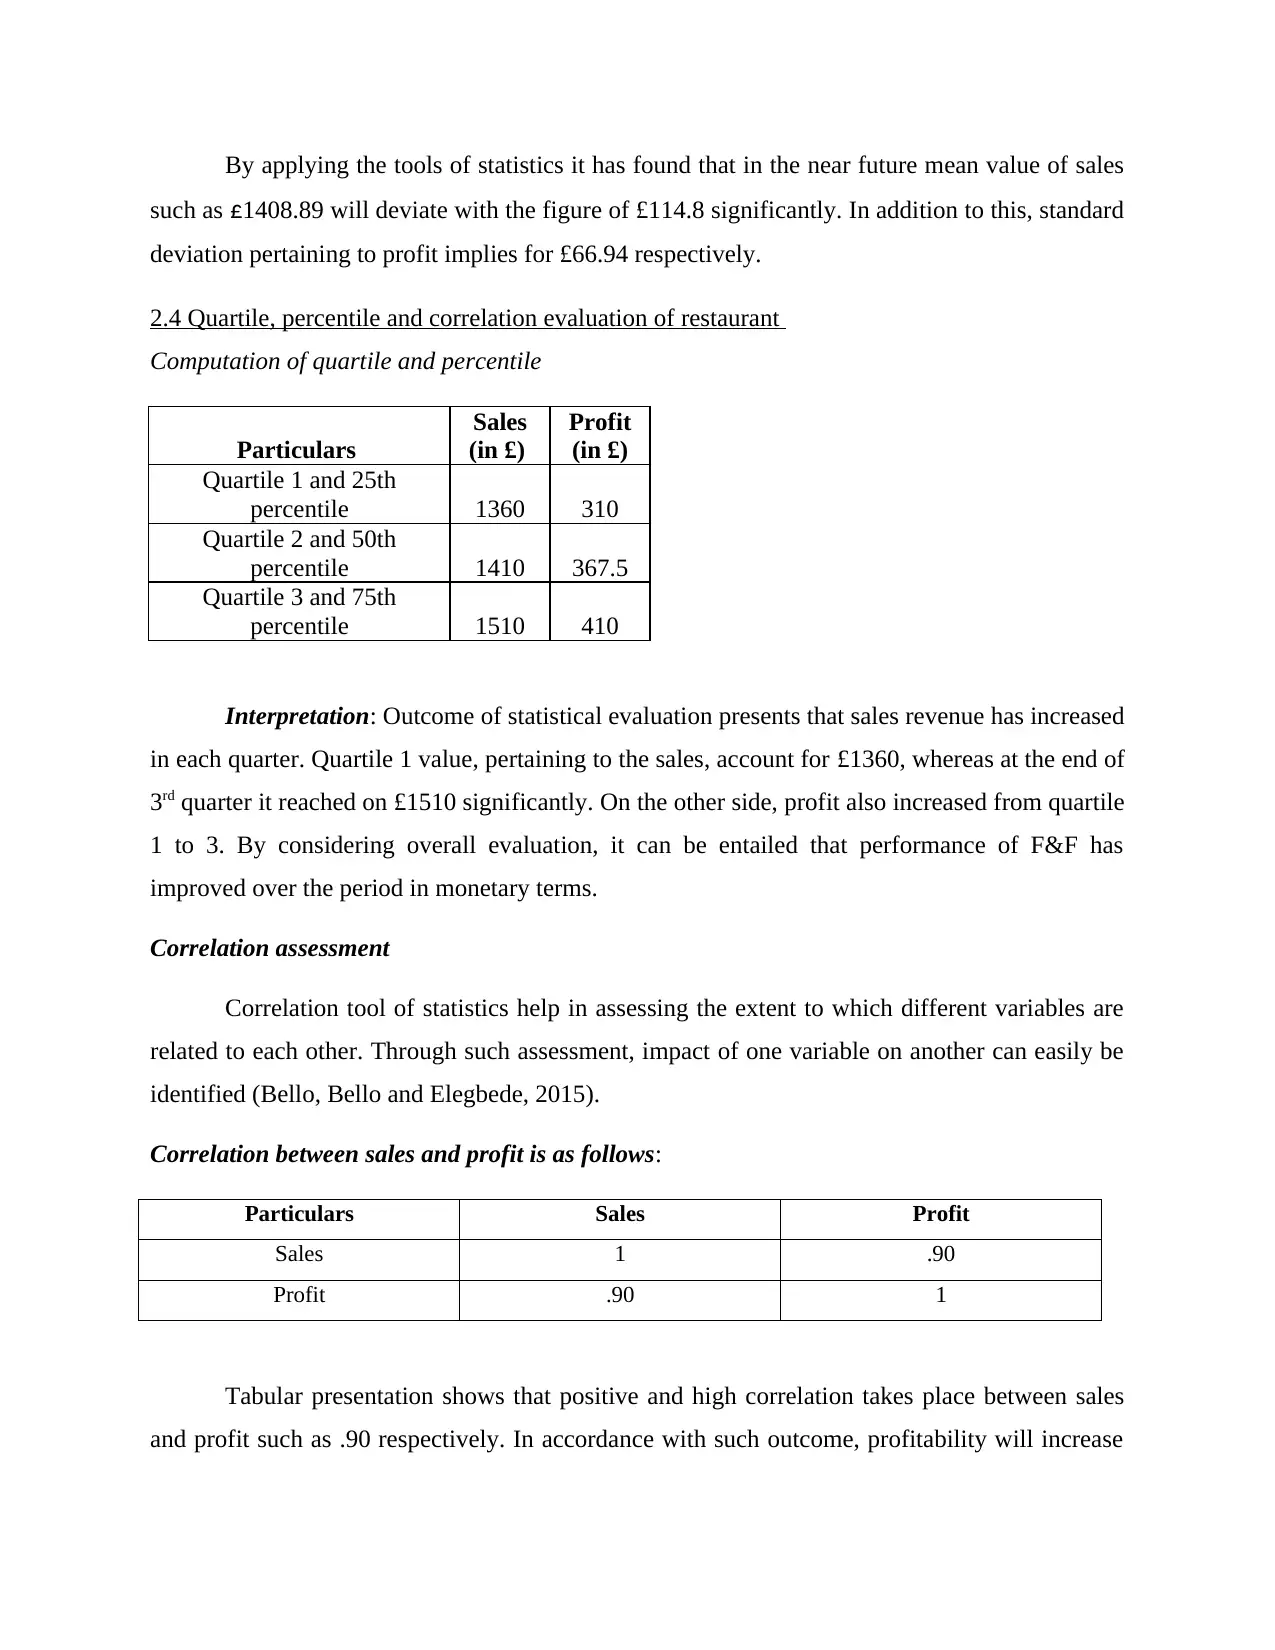
2.4 Quartile, percentile and correlation evaluation of restaurant
Computation of quartile and percentile
Particulars
Sales
(in £)
Profit
(in £)
Quartile 1 and 25th
percentile 1360 310
Quartile 2 and 50th
percentile 1410 367.5
Quartile 3 and 75th
percentile 1510 410
Interpretation: Outcome of statistical evaluation presents that sales revenue has increased
in each quarter. Quartile 1 value, pertaining to the sales, account for £1360, whereas at the end of
3rd quarter it reached on £1510 significantly. On the other side, profit also increased from quartile
1 to 3. By considering overall evaluation, it can be entailed that performance of F&F has
improved over the period in monetary terms.
Correlation assessment
Correlation tool of statistics help in assessing the extent to which different variables are
related to each other. Through such assessment, impact of one variable on another can easily be
identified (Bello, Bello and Elegbede, 2015).
Correlation between sales and profit is as follows:
Particulars Sales Profit
Sales 1 .90
Profit .90 1
Tabular presentation shows that positive and high correlation takes place between sales
and profit such as .90 respectively. In accordance with such outcome, profitability will increase
such as £1408.89 will deviate with the figure of £114.8 significantly. In addition to this, standard
deviation pertaining to profit implies for £66.94 respectively.
2.4 Quartile, percentile and correlation evaluation of restaurant
Computation of quartile and percentile
Particulars
Sales
(in £)
Profit
(in £)
Quartile 1 and 25th
percentile 1360 310
Quartile 2 and 50th
percentile 1410 367.5
Quartile 3 and 75th
percentile 1510 410
Interpretation: Outcome of statistical evaluation presents that sales revenue has increased
in each quarter. Quartile 1 value, pertaining to the sales, account for £1360, whereas at the end of
3rd quarter it reached on £1510 significantly. On the other side, profit also increased from quartile
1 to 3. By considering overall evaluation, it can be entailed that performance of F&F has
improved over the period in monetary terms.
Correlation assessment
Correlation tool of statistics help in assessing the extent to which different variables are
related to each other. Through such assessment, impact of one variable on another can easily be
identified (Bello, Bello and Elegbede, 2015).
Correlation between sales and profit is as follows:
Particulars Sales Profit
Sales 1 .90
Profit .90 1
Tabular presentation shows that positive and high correlation takes place between sales
and profit such as .90 respectively. In accordance with such outcome, profitability will increase
⊘ This is a preview!⊘
Do you want full access?
Subscribe today to unlock all pages.
Trusted by 1+ million students worldwide
1 out of 22
Related Documents


Your All-in-One AI-Powered Toolkit for Academic Success.
+13062052269
info@desklib.com
Available 24*7 on WhatsApp / Email
![[object Object]](/_next/static/media/star-bottom.7253800d.svg)
Unlock your academic potential
Copyright © 2020–2026 A2Z Services. All Rights Reserved. Developed and managed by ZUCOL.