Kitchen Design Ltd: Business Data Analysis and Decision Report
VerifiedAdded on 2023/04/10
|35
|4870
|284
Report
AI Summary
This report provides a comprehensive analysis of business data for Kitchen Design Ltd, focusing on data collection techniques, survey methodologies, and questionnaire design. It summarizes 12-month sales data for two product lines, employing statistical tools like mean, mode, median, and measures of dispersion to extract valuable insights. The analysis extends to quartile, percentile, and correlation coefficient computations. The report includes graphical presentations, trend line forecasting for future sales, and a business presentation to showcase the findings. Furthermore, it addresses information processing tools for inventory management, project plan preparation with critical path identification, and an examination of project viability through capital budgeting. The conclusion synthesizes the findings and recommendations, supported by a detailed list of references.
BUSINESS DECISION-
MAKING
MAKING
Paraphrase This Document
Need a fresh take? Get an instant paraphrase of this document with our AI Paraphraser

Table of Contents
INTRODUCTION...........................................................................................................................4
1.1 Collection of primary and secondary data.............................................................................4
1.2 Survey methodology and sampling used in research.............................................................5
1.3 Designing of questionnaire....................................................................................................6
TASK 2............................................................................................................................................7
2.1 Summarizing 12 month sales of two main lines of Kitchen Designs....................................7
2.2 Analyzing the results of mean, mode and median.................................................................8
2.3 Assessing measures of dispersion..........................................................................................9
2.4 Computation of quartile, percentile and correlation co-efficient...........................................9
TASK 3..........................................................................................................................................11
3.1 Graphical presentations........................................................................................................11
3.2 Trend line for forecasting future..........................................................................................14
3.3 Business presentation...........................................................................................................17
3.4 Formal business report.........................................................................................................26
TASK 4..........................................................................................................................................27
4.1 Information processing tool to manage inventory...............................................................27
4.2 Preparation of project plan stating critical path...................................................................28
4.3 Examining the viability of the project through capital budgeting.......................................31
CONCLUSION..............................................................................................................................32
REFERENCES..............................................................................................................................34
⊘ This is a preview!⊘
Do you want full access?
Subscribe today to unlock all pages.
Trusted by 1+ million students worldwide
INTRODUCTION
In the corporate sector, the role and responsibilities of the managers got increased over
the years as they devise plans, strategies & decisions and align all these with the set corporate
targets. Moreover, with the changing market conditions, managers also make internal as well as
external analysis and modify plans accordingly to raise long-term profitability and assure
sustainable growth. Kitchen Design Ltd is a well known contemporary kitchen installation
distributor organization that sells wide range of products & services such as utensils, cabinets &
others. Now, in order to widen its goods portfolio, company is planning to explore opportunities
by introducing bathroom design & equipments. Thus, the present assignment focuses on
demonstrating the knowledge of data collection & storage techniques. Along with this, skills &
tools required to analyse useful business information will be presented for making excellent
business decisions.
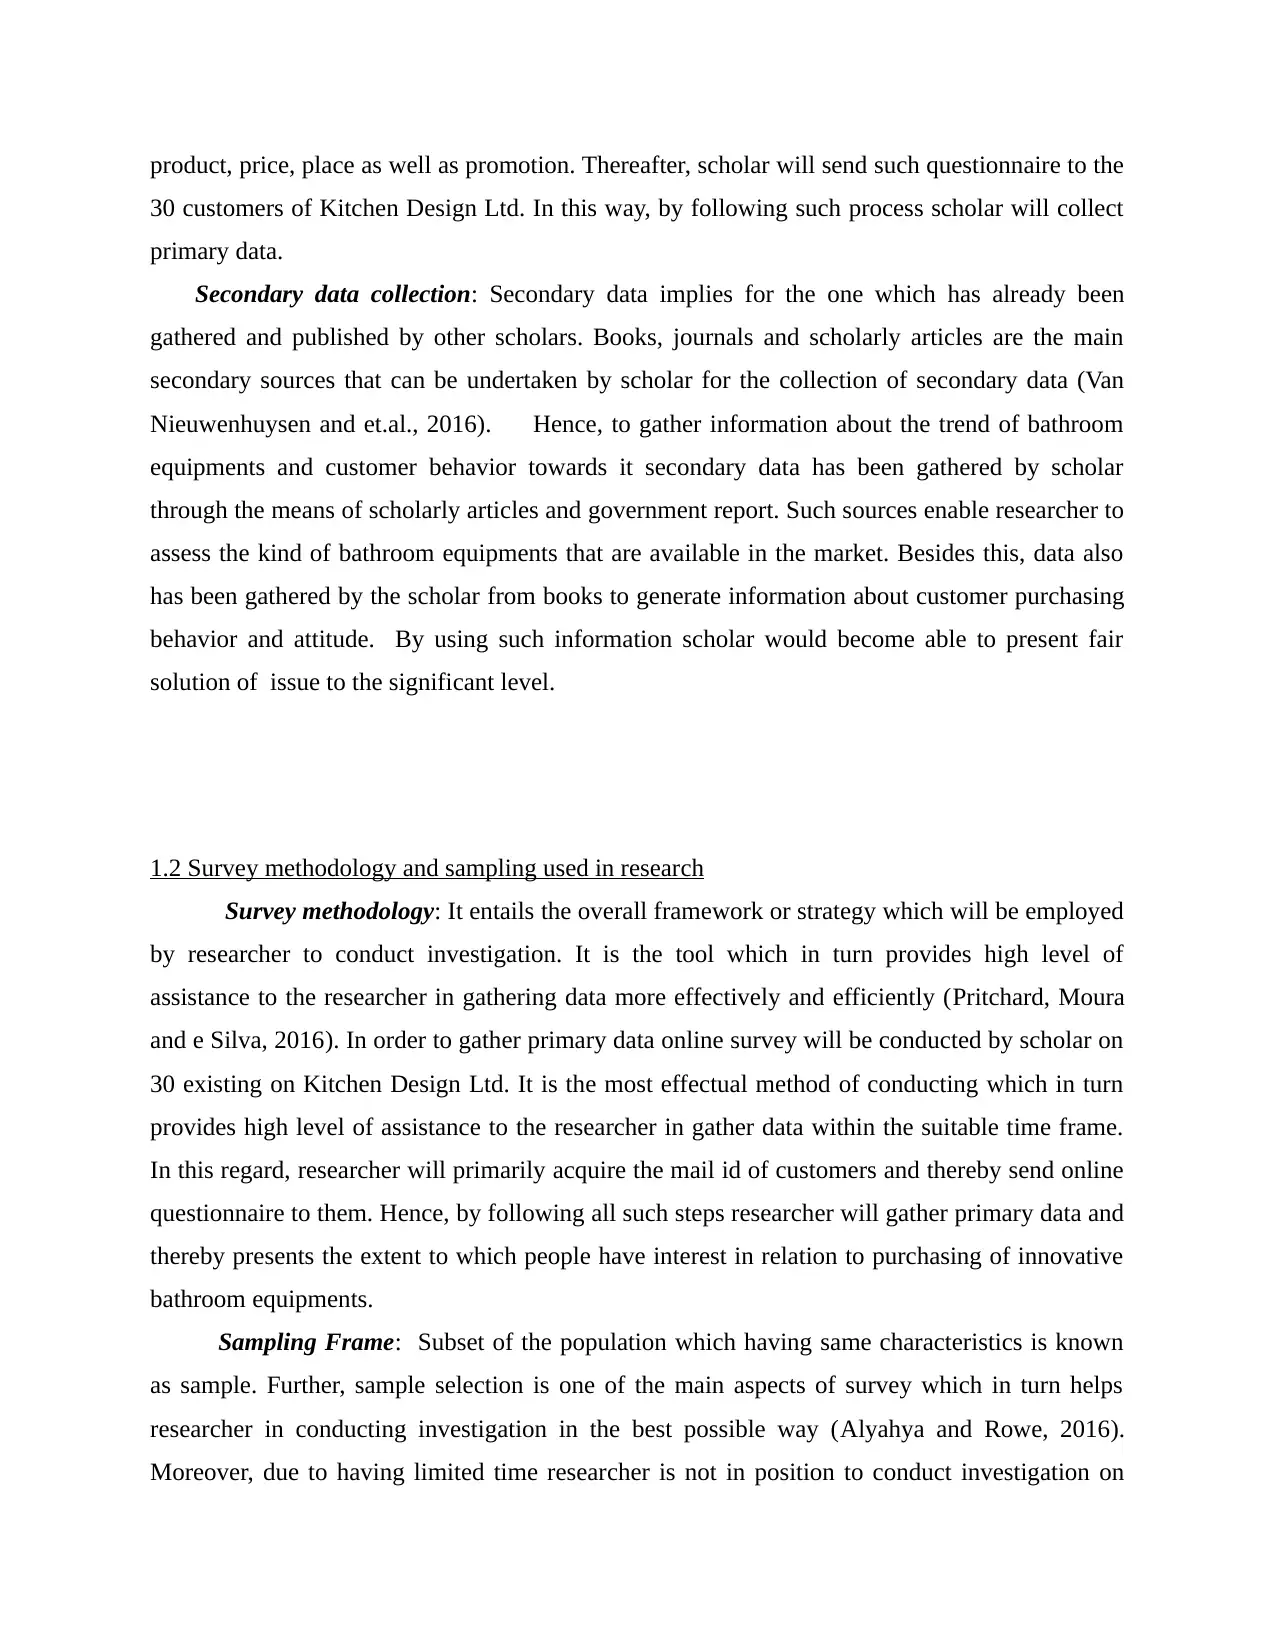
1.1 Collection of primary and secondary data
On the basis of cited case situation, Kitchen Design Ltd offers unique goods, utensils and
cabinets to the customers. Now, with the aim to enhance productivity and profitability business
unit is planning to offer bathroom equipments or products to the customers. The rationale behind
this, with the rise in disposable income, now living standard of people increased with the very
high pace. Hence, in this context, business entity has chance to capitalize such opportunities and
thereby fulfill organizational aims and objectives (Alexakos and et.al., 2016). In this regard,
researcher has gathered data from both primary and secondary sources to assess customer’s
preferences and attitude towards bathroom equipments in the following way:
Primary data collection: Primary data refers to those which are gathered by scholar for the
first time with the aim to address research issue or purpose. Such database is highly effectual
which in turn offers clear and specific information in accordance with the problem which is
going to be investigated. There are several methods that can be undertaken by scholar for the
collection of primary data namely interview, survey, observation, focus group etc (Prada-
Ramallal, Takkouche and Figueiras, 2016). All these methods are highly effectual which in turn
enables firm to gather suitable primary data. In this, to get information about customers needs,
wants and expectation about bathroom equipments survey will be conducted by scholar. Hence,
researcher will prepare questionnaire by including both close and opened questions in relation to
In the corporate sector, the role and responsibilities of the managers got increased over
the years as they devise plans, strategies & decisions and align all these with the set corporate
targets. Moreover, with the changing market conditions, managers also make internal as well as
external analysis and modify plans accordingly to raise long-term profitability and assure
sustainable growth. Kitchen Design Ltd is a well known contemporary kitchen installation
distributor organization that sells wide range of products & services such as utensils, cabinets &
others. Now, in order to widen its goods portfolio, company is planning to explore opportunities
by introducing bathroom design & equipments. Thus, the present assignment focuses on
demonstrating the knowledge of data collection & storage techniques. Along with this, skills &
tools required to analyse useful business information will be presented for making excellent
business decisions.
1.1 Collection of primary and secondary data
On the basis of cited case situation, Kitchen Design Ltd offers unique goods, utensils and
cabinets to the customers. Now, with the aim to enhance productivity and profitability business
unit is planning to offer bathroom equipments or products to the customers. The rationale behind
this, with the rise in disposable income, now living standard of people increased with the very
high pace. Hence, in this context, business entity has chance to capitalize such opportunities and
thereby fulfill organizational aims and objectives (Alexakos and et.al., 2016). In this regard,
researcher has gathered data from both primary and secondary sources to assess customer’s
preferences and attitude towards bathroom equipments in the following way:
Primary data collection: Primary data refers to those which are gathered by scholar for the
first time with the aim to address research issue or purpose. Such database is highly effectual
which in turn offers clear and specific information in accordance with the problem which is
going to be investigated. There are several methods that can be undertaken by scholar for the
collection of primary data namely interview, survey, observation, focus group etc (Prada-
Ramallal, Takkouche and Figueiras, 2016). All these methods are highly effectual which in turn
enables firm to gather suitable primary data. In this, to get information about customers needs,
wants and expectation about bathroom equipments survey will be conducted by scholar. Hence,
researcher will prepare questionnaire by including both close and opened questions in relation to
Paraphrase This Document
Need a fresh take? Get an instant paraphrase of this document with our AI Paraphraser
product, price, place as well as promotion. Thereafter, scholar will send such questionnaire to the
30 customers of Kitchen Design Ltd. In this way, by following such process scholar will collect
primary data.
Secondary data collection: Secondary data implies for the one which has already been
gathered and published by other scholars. Books, journals and scholarly articles are the main
secondary sources that can be undertaken by scholar for the collection of secondary data (Van
Nieuwenhuysen and et.al., 2016). Hence, to gather information about the trend of bathroom
equipments and customer behavior towards it secondary data has been gathered by scholar
through the means of scholarly articles and government report. Such sources enable researcher to
assess the kind of bathroom equipments that are available in the market. Besides this, data also
has been gathered by the scholar from books to generate information about customer purchasing
behavior and attitude. By using such information scholar would become able to present fair
solution of issue to the significant level.
1.2 Survey methodology and sampling used in research
Survey methodology: It entails the overall framework or strategy which will be employed
by researcher to conduct investigation. It is the tool which in turn provides high level of
assistance to the researcher in gathering data more effectively and efficiently (Pritchard, Moura
and e Silva, 2016). In order to gather primary data online survey will be conducted by scholar on
30 existing on Kitchen Design Ltd. It is the most effectual method of conducting which in turn
provides high level of assistance to the researcher in gather data within the suitable time frame.
In this regard, researcher will primarily acquire the mail id of customers and thereby send online
questionnaire to them. Hence, by following all such steps researcher will gather primary data and
thereby presents the extent to which people have interest in relation to purchasing of innovative
bathroom equipments.
Sampling Frame: Subset of the population which having same characteristics is known
as sample. Further, sample selection is one of the main aspects of survey which in turn helps
researcher in conducting investigation in the best possible way (Alyahya and Rowe, 2016).
Moreover, due to having limited time researcher is not in position to conduct investigation on
whole population. Further, limited financial resources are other main aspects that have direct
impact on investigation and its outcome. In this way, sample helps in determining faster results
by saving both time and money. In this regard, by making use of probabilistic and non-
probabilistic techniques researcher can determine suitable sample size. Probabilistic techniques
imply for the one in which each customer of Kitchen Design Ltd gets equal chance to being
selected as sample such as simple random, systematic, stratified and cluster. On the other side,
non-probabilistic may be defined as one in which researcher selects sample by considering the
research aims and objectives namely quota, convenience and judgment etc. In the present study,
to get information about customer’s preference simple random sampling technique has been used
by scholar. Hence, by employing such technique 30 customers of Kitchen Design Ltd has been
selected by scholar. In this way, by conducting study on such people scholar can assess the kind
of bathroom equipments which are preferred by the customers.
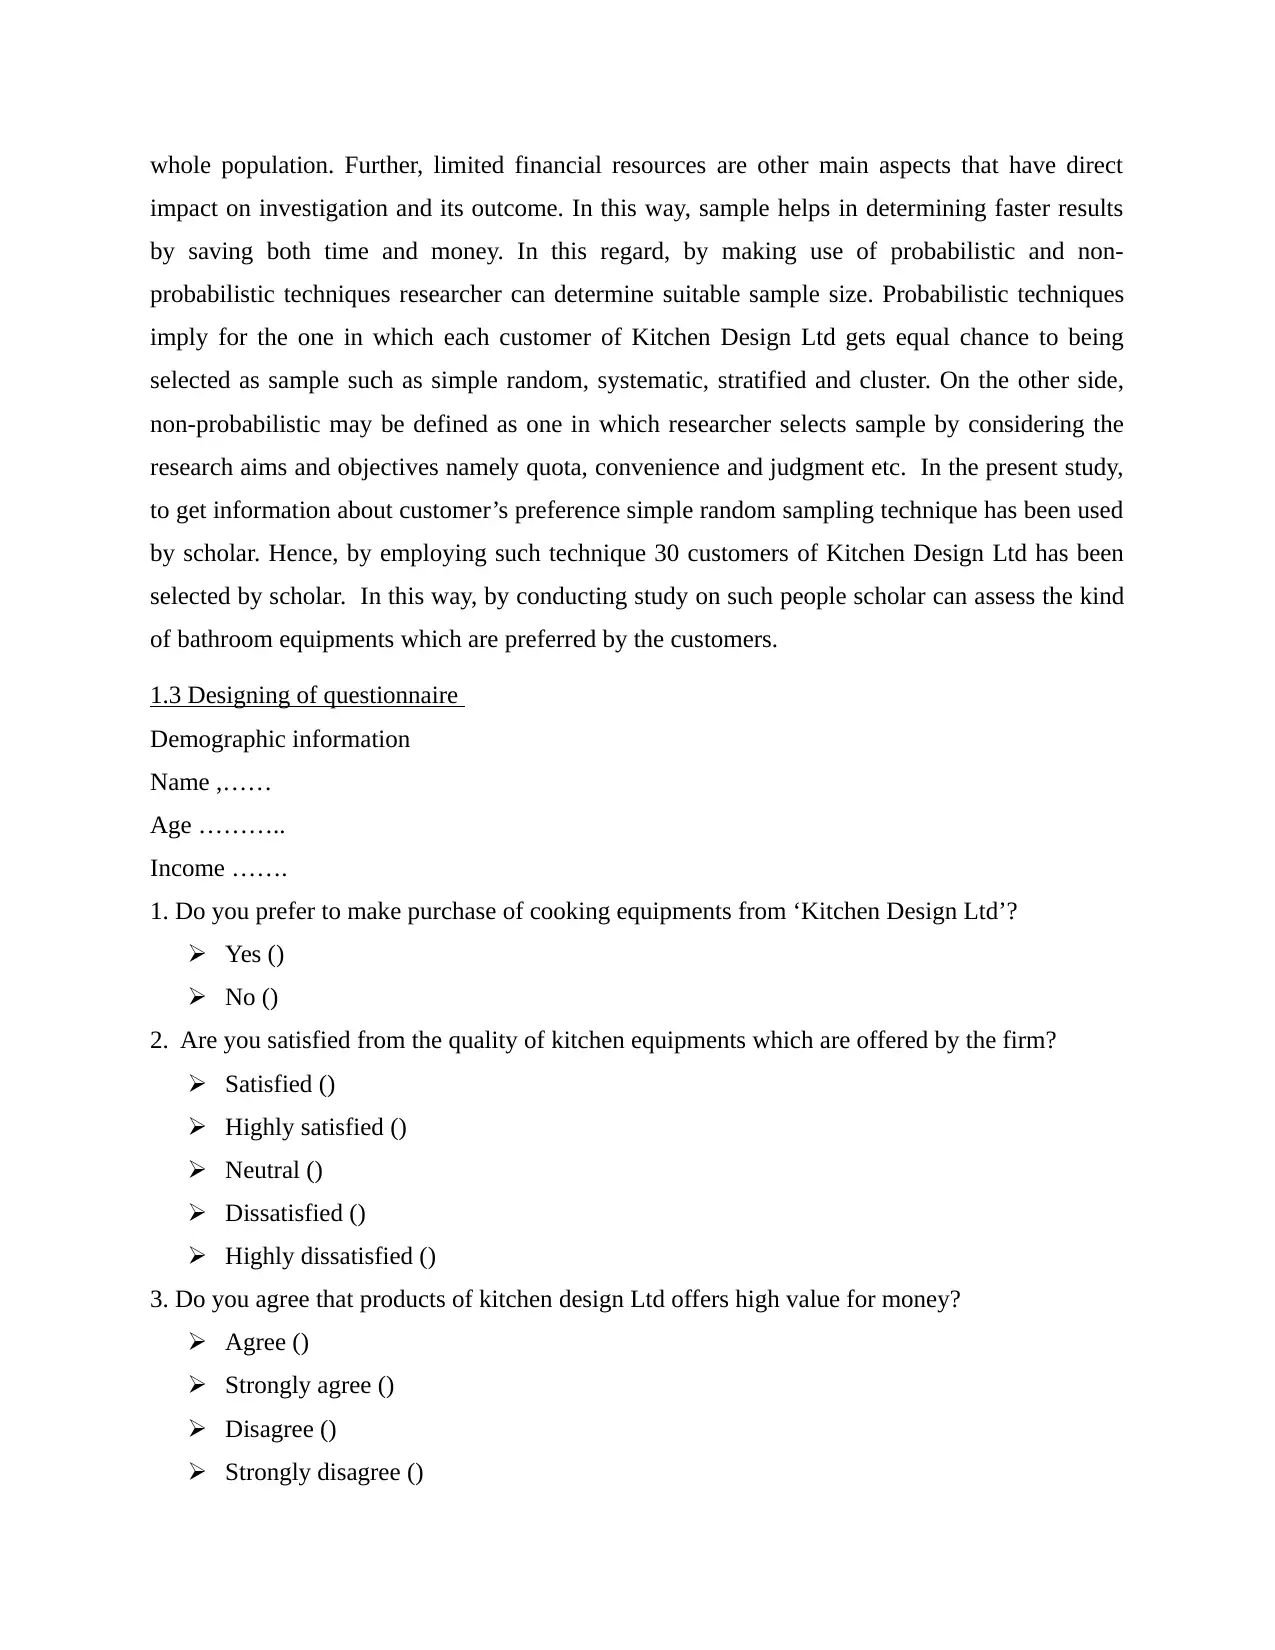
1.3 Designing of questionnaire
Demographic information
Name ,……
Age ………..
Income …….
1. Do you prefer to make purchase of cooking equipments from ‘Kitchen Design Ltd’?
Yes ()
No ()
2. Are you satisfied from the quality of kitchen equipments which are offered by the firm?
Satisfied ()
Highly satisfied ()
Neutral ()
Dissatisfied ()
Highly dissatisfied ()
3. Do you agree that products of kitchen design Ltd offers high value for money?
Agree ()
Strongly agree ()
Disagree ()
Strongly disagree ()
impact on investigation and its outcome. In this way, sample helps in determining faster results
by saving both time and money. In this regard, by making use of probabilistic and non-
probabilistic techniques researcher can determine suitable sample size. Probabilistic techniques
imply for the one in which each customer of Kitchen Design Ltd gets equal chance to being
selected as sample such as simple random, systematic, stratified and cluster. On the other side,
non-probabilistic may be defined as one in which researcher selects sample by considering the
research aims and objectives namely quota, convenience and judgment etc. In the present study,
to get information about customer’s preference simple random sampling technique has been used
by scholar. Hence, by employing such technique 30 customers of Kitchen Design Ltd has been
selected by scholar. In this way, by conducting study on such people scholar can assess the kind
of bathroom equipments which are preferred by the customers.
1.3 Designing of questionnaire
Demographic information
Name ,……
Age ………..
Income …….
1. Do you prefer to make purchase of cooking equipments from ‘Kitchen Design Ltd’?
Yes ()
No ()
2. Are you satisfied from the quality of kitchen equipments which are offered by the firm?
Satisfied ()
Highly satisfied ()
Neutral ()
Dissatisfied ()
Highly dissatisfied ()
3. Do you agree that products of kitchen design Ltd offers high value for money?
Agree ()
Strongly agree ()
Disagree ()
Strongly disagree ()
⊘ This is a preview!⊘
Do you want full access?
Subscribe today to unlock all pages.
Trusted by 1+ million students worldwide
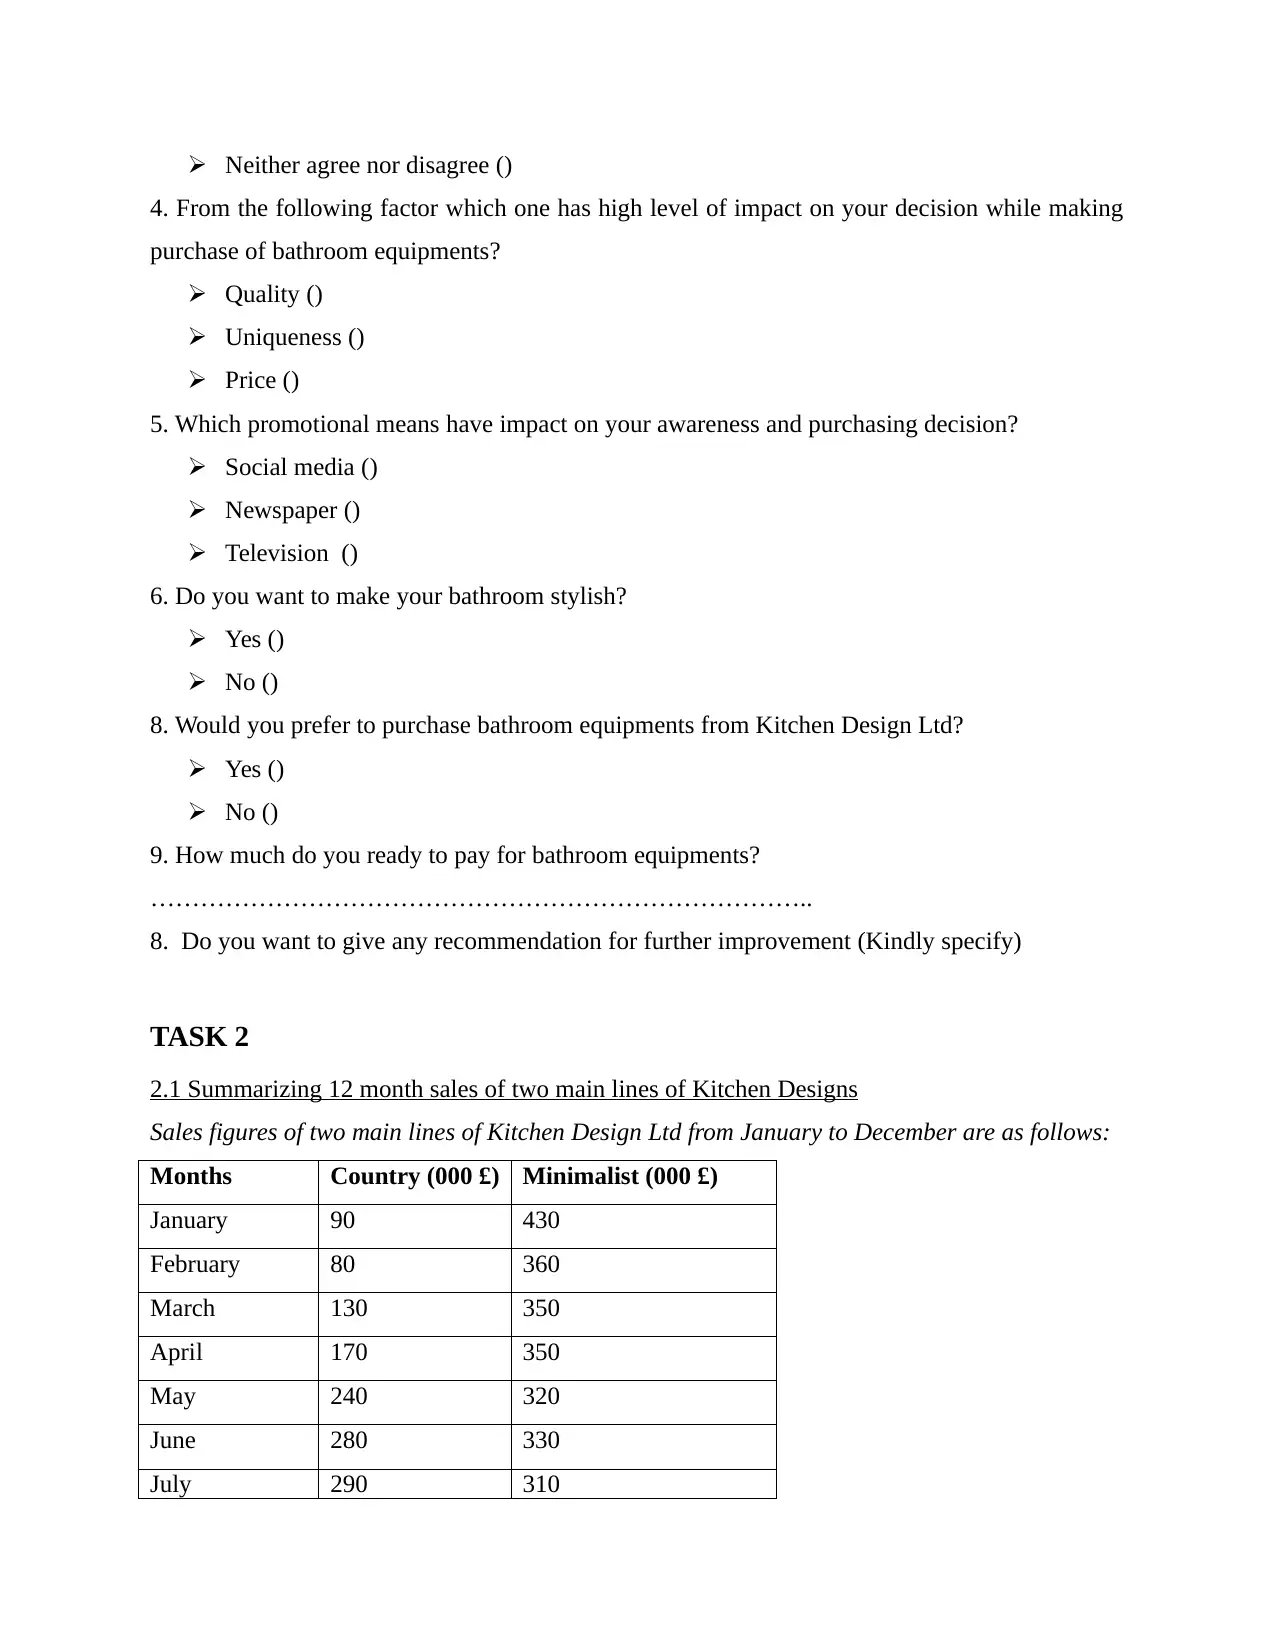
Neither agree nor disagree ()
4. From the following factor which one has high level of impact on your decision while making
purchase of bathroom equipments?
Quality ()
Uniqueness ()
Price ()
5. Which promotional means have impact on your awareness and purchasing decision?
Social media ()
Newspaper ()
Television ()
6. Do you want to make your bathroom stylish?
Yes ()
No ()
8. Would you prefer to purchase bathroom equipments from Kitchen Design Ltd?
Yes ()
No ()
9. How much do you ready to pay for bathroom equipments?
……………………………………………………………………..
8. Do you want to give any recommendation for further improvement (Kindly specify)
TASK 2
2.1 Summarizing 12 month sales of two main lines of Kitchen Designs
Sales figures of two main lines of Kitchen Design Ltd from January to December are as follows:
Months Country (000 £) Minimalist (000 £)
January 90 430
February 80 360
March 130 350
April 170 350
May 240 320
June 280 330
July 290 310
Paraphrase This Document
Need a fresh take? Get an instant paraphrase of this document with our AI Paraphraser
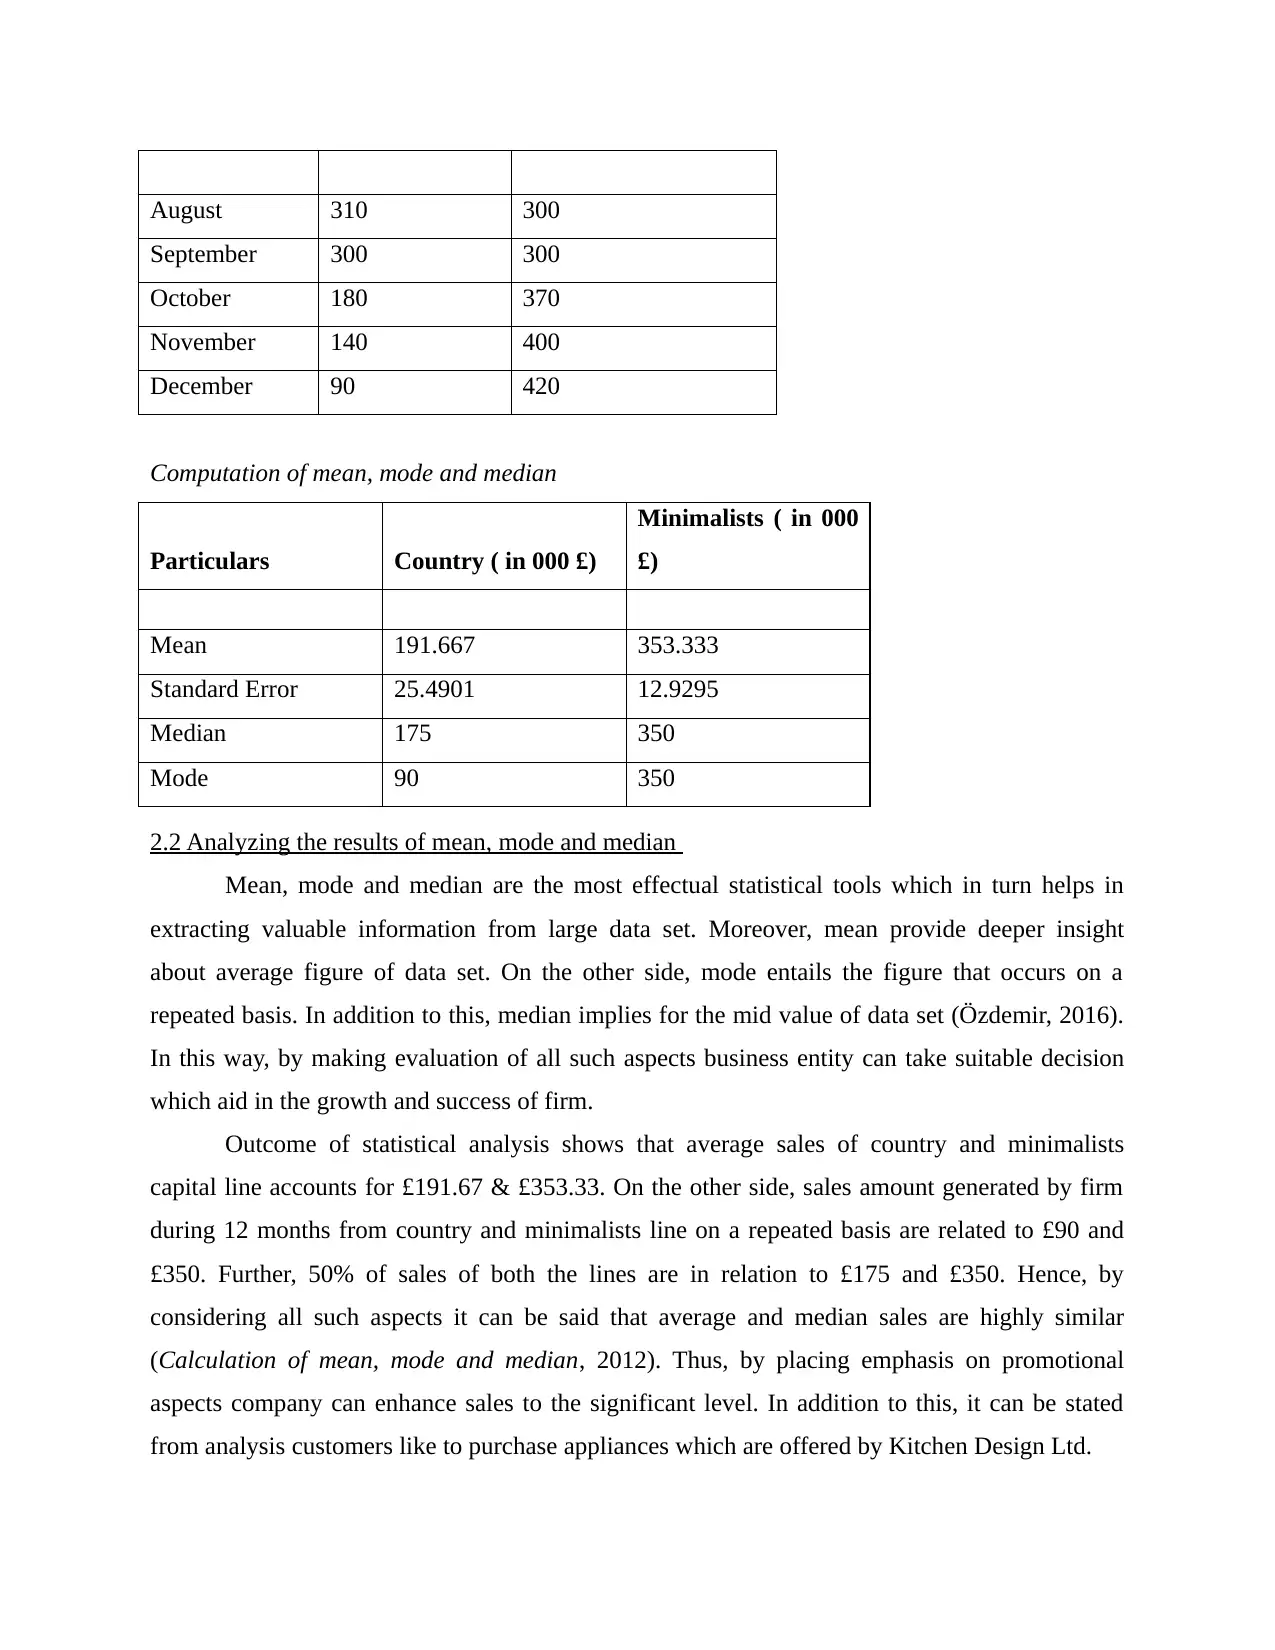
August 310 300
September 300 300
October 180 370
November 140 400
December 90 420
Computation of mean, mode and median
Particulars Country ( in 000 £)
Minimalists ( in 000
£)
Mean 191.667 353.333
Standard Error 25.4901 12.9295
Median 175 350
Mode 90 350
2.2 Analyzing the results of mean, mode and median
Mean, mode and median are the most effectual statistical tools which in turn helps in
extracting valuable information from large data set. Moreover, mean provide deeper insight
about average figure of data set. On the other side, mode entails the figure that occurs on a
repeated basis. In addition to this, median implies for the mid value of data set (Özdemir, 2016).
In this way, by making evaluation of all such aspects business entity can take suitable decision
which aid in the growth and success of firm.
Outcome of statistical analysis shows that average sales of country and minimalists
capital line accounts for £191.67 & £353.33. On the other side, sales amount generated by firm
during 12 months from country and minimalists line on a repeated basis are related to £90 and
£350. Further, 50% of sales of both the lines are in relation to £175 and £350. Hence, by
considering all such aspects it can be said that average and median sales are highly similar
(Calculation of mean, mode and median, 2012). Thus, by placing emphasis on promotional
aspects company can enhance sales to the significant level. In addition to this, it can be stated
from analysis customers like to purchase appliances which are offered by Kitchen Design Ltd.
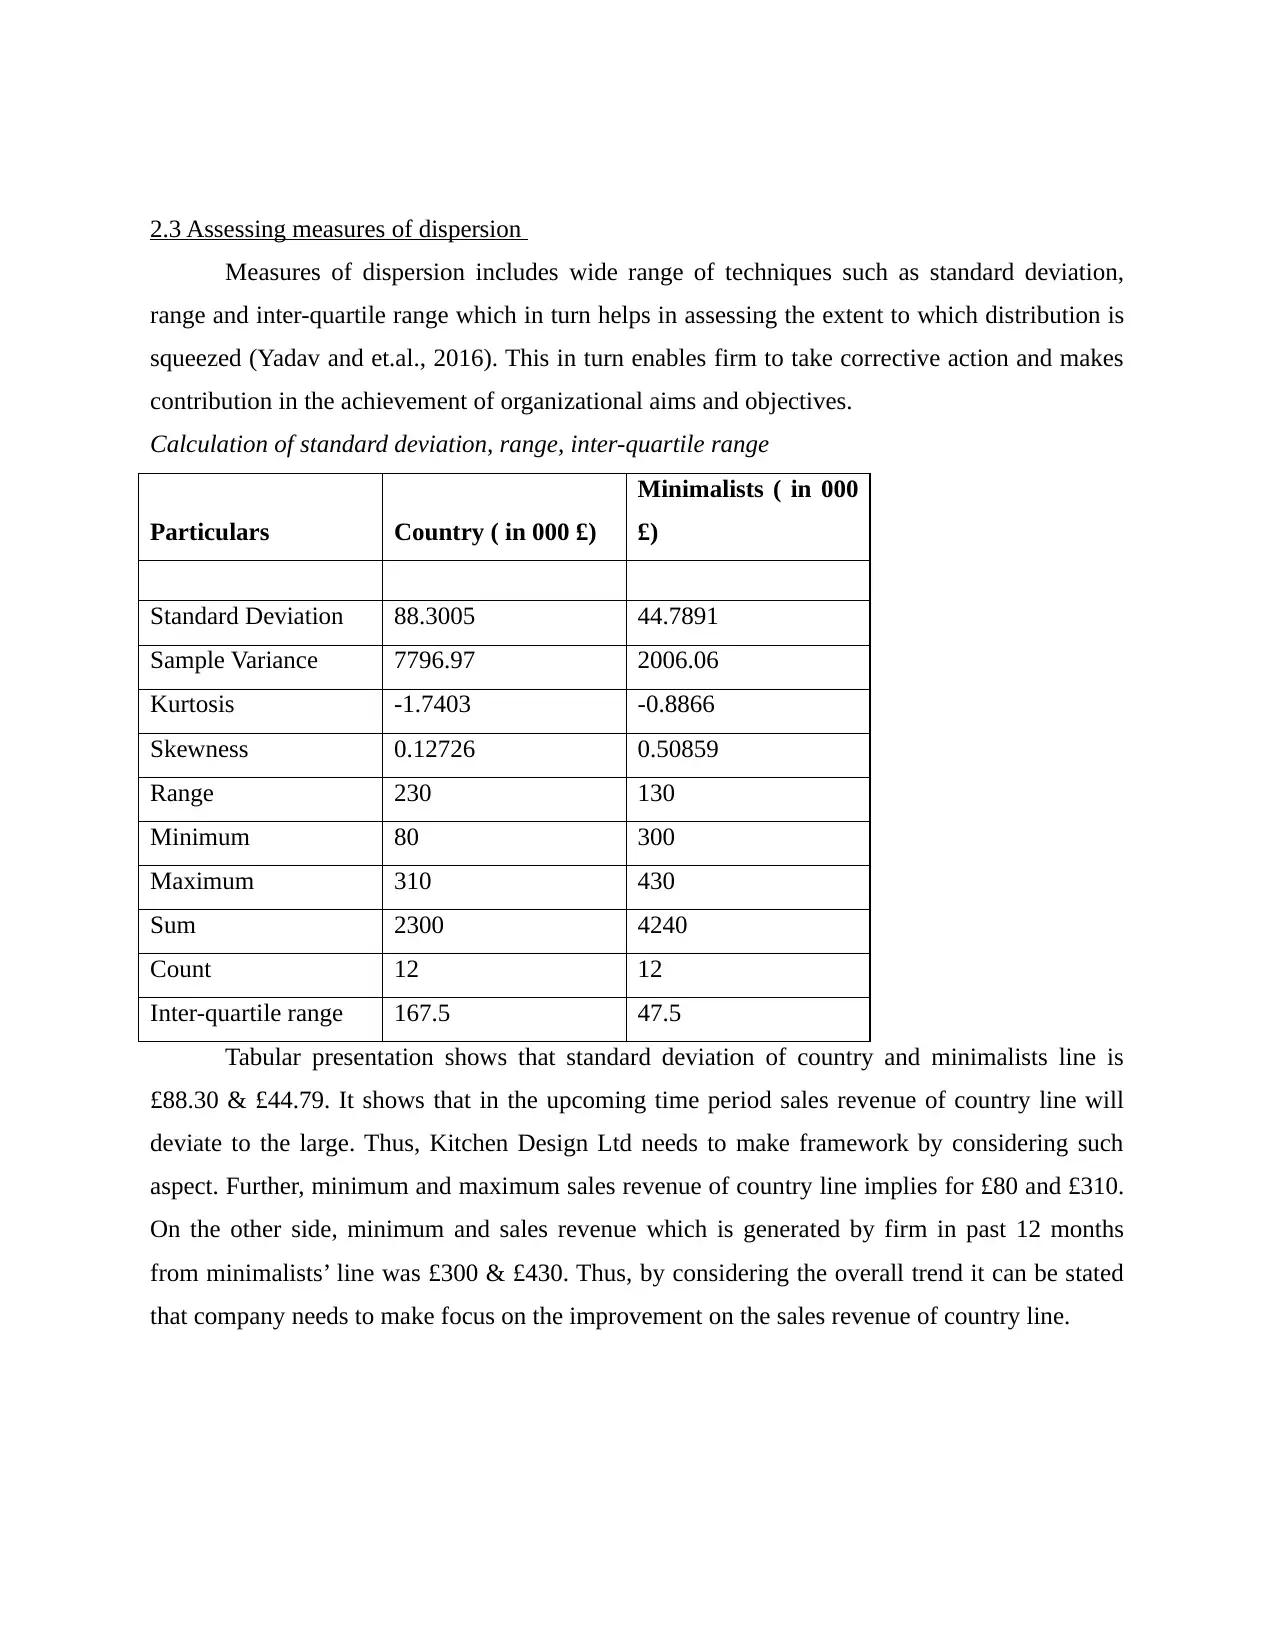
2.3 Assessing measures of dispersion
Measures of dispersion includes wide range of techniques such as standard deviation,
range and inter-quartile range which in turn helps in assessing the extent to which distribution is
squeezed (Yadav and et.al., 2016). This in turn enables firm to take corrective action and makes
contribution in the achievement of organizational aims and objectives.
Calculation of standard deviation, range, inter-quartile range
Particulars Country ( in 000 £)
Minimalists ( in 000
£)
Standard Deviation 88.3005 44.7891
Sample Variance 7796.97 2006.06
Kurtosis -1.7403 -0.8866
Skewness 0.12726 0.50859
Range 230 130
Minimum 80 300
Maximum 310 430
Sum 2300 4240
Count 12 12
Inter-quartile range 167.5 47.5
Tabular presentation shows that standard deviation of country and minimalists line is
£88.30 & £44.79. It shows that in the upcoming time period sales revenue of country line will
deviate to the large. Thus, Kitchen Design Ltd needs to make framework by considering such
aspect. Further, minimum and maximum sales revenue of country line implies for £80 and £310.
On the other side, minimum and sales revenue which is generated by firm in past 12 months
from minimalists’ line was £300 & £430. Thus, by considering the overall trend it can be stated
that company needs to make focus on the improvement on the sales revenue of country line.
⊘ This is a preview!⊘
Do you want full access?
Subscribe today to unlock all pages.
Trusted by 1+ million students worldwide
2.4 Computation of quartile, percentile and correlation co-efficient
Quartile divides whole data set into four quarters and thereby furnishes provide
information about trend. By this, business unit can assess the sales and profit generated by it in
each quarter (Alexakos and et.al., 2016). On the other side, percentile indicates the value which
is falls below a given percentage of observation. Hence, quartile and percentile are similar to
each other, only percentage aspect differentiates each other.
Calculation of quartile
Particulars / Lines Country (in £ ‘000) Minimalist (in £ ‘000)
Quartile1 120 317.5
Quartile 2 180 350
Quartile 3 287.5 365
The above mentioned table shoes that sales revenue of country line of Kitchen design in
1st and 2nd quarter was £120 & £180 respectively. Along with this, in third quarter sales revenue
of business unit was £287.5. Hence, sales revenue of Country line of Kitchen design increased in
each quarter. On the other side, sales of Minimalists line inclined from £317.5 to £365 at the end
of third quarter (Calculating Measures of Dispersion, 2014). Hence, by considering such aspects
it can be said that sales revenue level of Minimalists line was high as compared to Country.
Calculation of percentile
Particulars / Lines Country (in £ ‘000) Minimalist (in £ ‘000)
25th Percentile 120 317.5
50th Percentile 180 350
75th Percentile 287.5 365
Correlation co-efficient: This measure of statistics helps in determining the relationship
between two variables. There are mainly three kind of relationship which takes between two
variables such as positive, negative and moderate (Shevlyakov, G. and Smirnov, 2016).
Correlation can said to be positive only when both the variables move in same direction. On the
other side, negative correlation is when one variable moves upward and other goes downward. In
contrast to this, moderate correlation may be defined as one in which one variable does not have
high impact on another.
Pearson correlation co-efficient
Paraphrase This Document
Need a fresh take? Get an instant paraphrase of this document with our AI Paraphraser
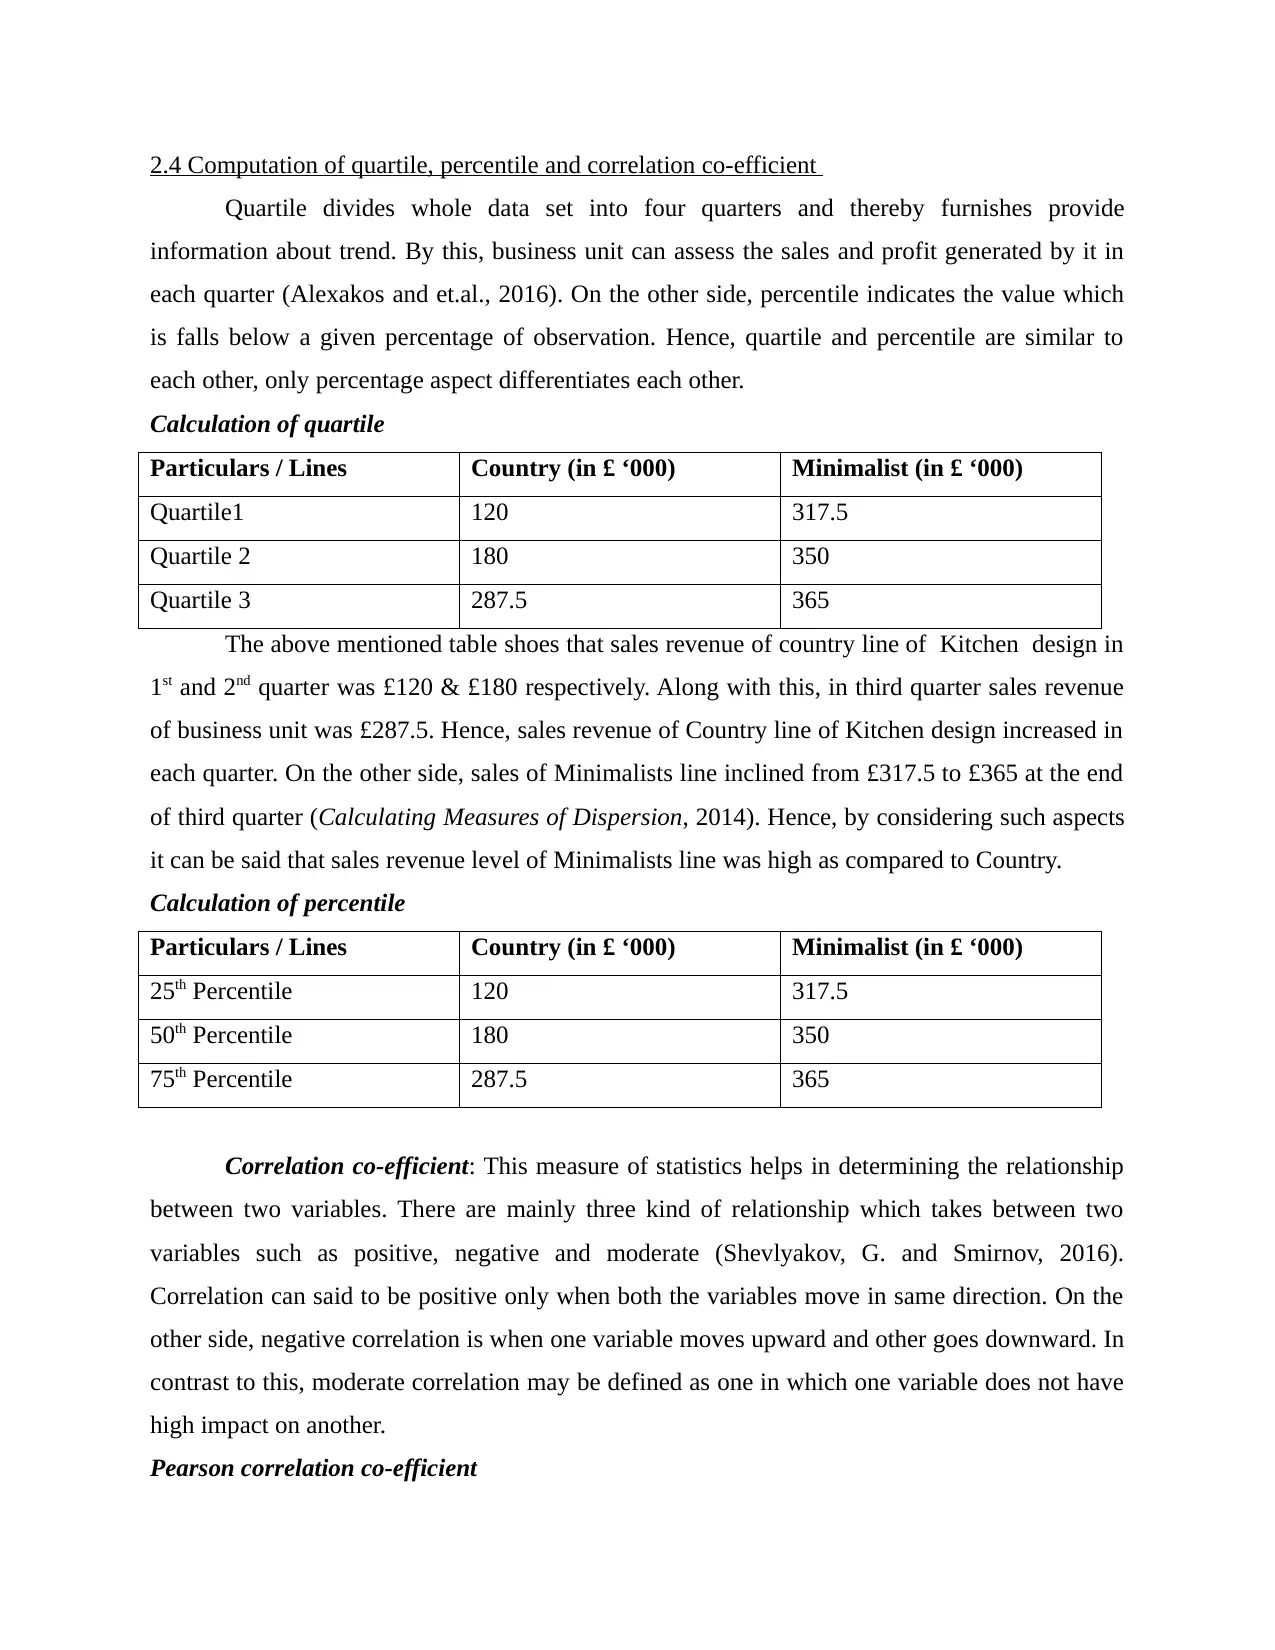
Calculation of correlation co-efficient
Particulars Country Minimalist
Country 1 -.86
Minimalists -.86 1
By applying statistical measures, it has been assessed that negative correlation takes place
between country and minimalist line of Kitchen Design Ltd in terms of -.86. Hence, sales aspect
of both country and minimalists will move in opposite direction. Thus, Kitchen Design Ltd needs
to keep in mind such aspect while framing competent and strategic policy framework.
TASK 3
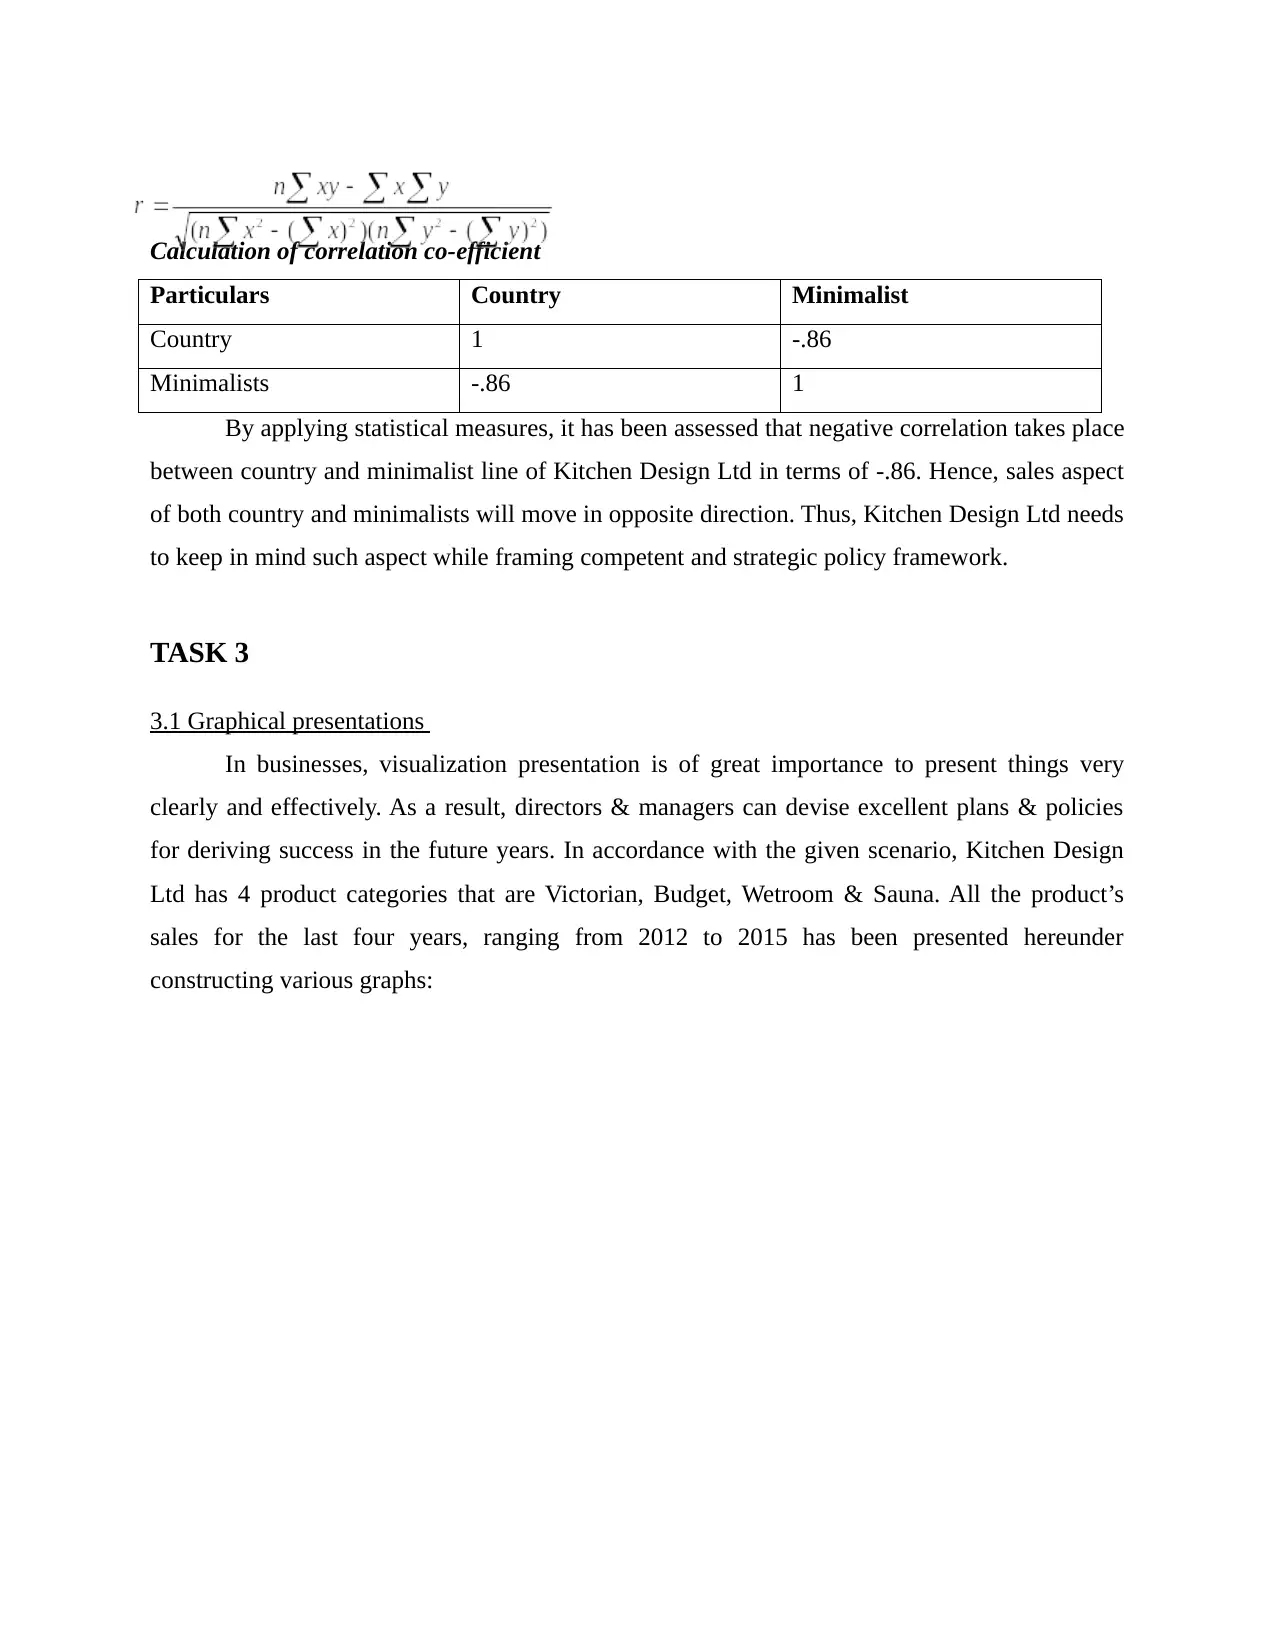
3.1 Graphical presentations
In businesses, visualization presentation is of great importance to present things very
clearly and effectively. As a result, directors & managers can devise excellent plans & policies
for deriving success in the future years. In accordance with the given scenario, Kitchen Design
Ltd has 4 product categories that are Victorian, Budget, Wetroom & Sauna. All the product’s
sales for the last four years, ranging from 2012 to 2015 has been presented hereunder
constructing various graphs:
Particulars Country Minimalist
Country 1 -.86
Minimalists -.86 1
By applying statistical measures, it has been assessed that negative correlation takes place
between country and minimalist line of Kitchen Design Ltd in terms of -.86. Hence, sales aspect
of both country and minimalists will move in opposite direction. Thus, Kitchen Design Ltd needs
to keep in mind such aspect while framing competent and strategic policy framework.
TASK 3
3.1 Graphical presentations
In businesses, visualization presentation is of great importance to present things very
clearly and effectively. As a result, directors & managers can devise excellent plans & policies
for deriving success in the future years. In accordance with the given scenario, Kitchen Design
Ltd has 4 product categories that are Victorian, Budget, Wetroom & Sauna. All the product’s
sales for the last four years, ranging from 2012 to 2015 has been presented hereunder
constructing various graphs:
Victorian Budget Wetroom Sauna
0
1
2
3
4
5
6
7
8
Column grph for all the products
(Amount In million)
Figure 1 Column graph for all the products
2012
21%
2013
24%
2014
27%
2015
28%
Victorian
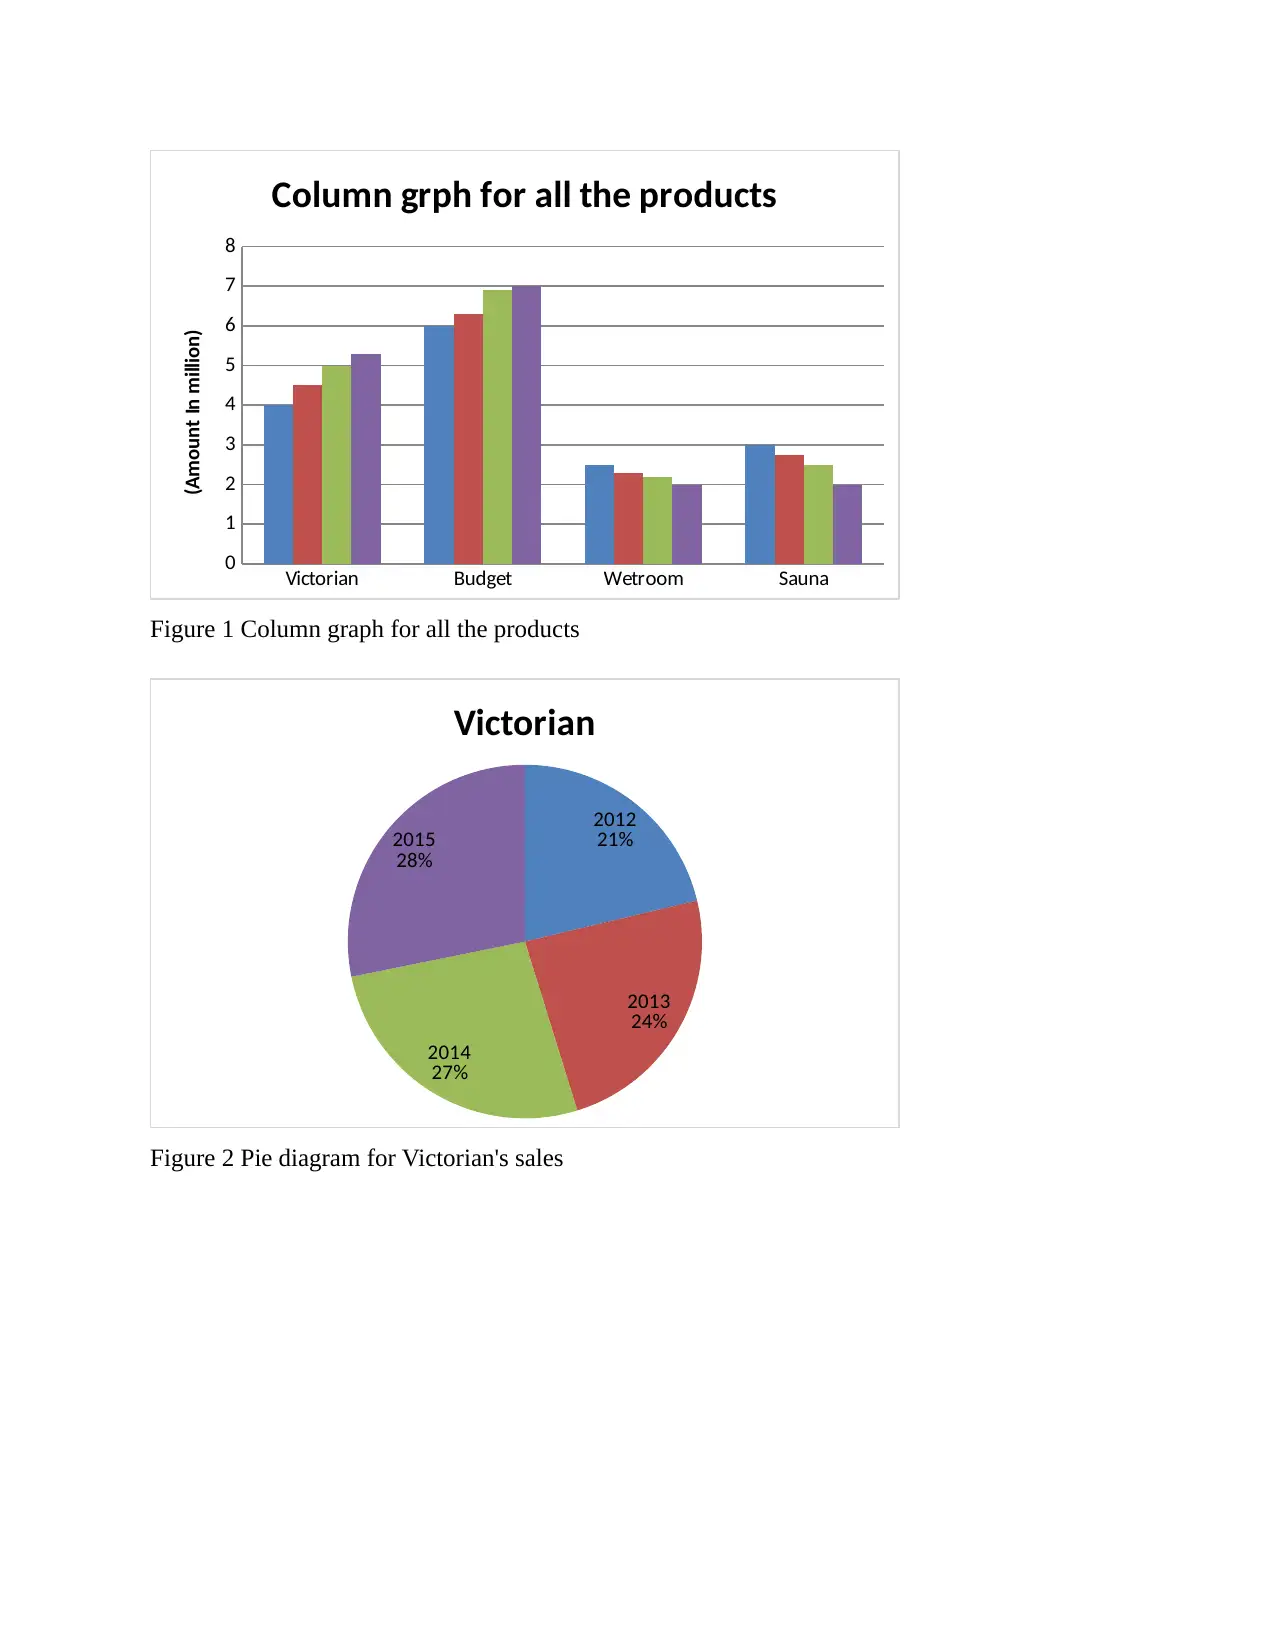
Figure 2 Pie diagram for Victorian's sales
0
1
2
3
4
5
6
7
8
Column grph for all the products
(Amount In million)
Figure 1 Column graph for all the products
2012
21%
2013
24%
2014
27%
2015
28%
Victorian
Figure 2 Pie diagram for Victorian's sales
⊘ This is a preview!⊘
Do you want full access?
Subscribe today to unlock all pages.
Trusted by 1+ million students worldwide
1 out of 35
Related Documents


Your All-in-One AI-Powered Toolkit for Academic Success.
+13062052269
info@desklib.com
Available 24*7 on WhatsApp / Email
![[object Object]](/_next/static/media/star-bottom.7253800d.svg)
Unlock your academic potential
Copyright © 2020–2026 A2Z Services. All Rights Reserved. Developed and managed by ZUCOL.