Business Decision Making Report: Statistical Tools and Analysis
VerifiedAdded on 2023/04/12
|18
|3489
|123
Report
AI Summary
This report presents a comprehensive analysis of business decision-making, focusing on the application of statistical tools to assess firm performance and evaluate projects. The study begins with an introduction to business problems and the role of statistics in solving them, followed by a detailed explanation of data collection methods, including primary and secondary data gathering. A questionnaire is designed to collect primary data from respondents, and various sampling methods are discussed, with stratified sampling being selected for the research. The core of the report involves the application of statistical tools such as mean, median, mode, standard deviation, quartiles, and correlation to analyze cash flows and the performance of the Murano restaurant. The results of these analyses are interpreted to understand the firm's sales trends and overall business performance. The report concludes with a project evaluation, assessing its viability and offering relevant comments, thus providing a holistic view of business analysis and decision-making.

BUSINESS DECISION MAKING
Paraphrase This Document
Need a fresh take? Get an instant paraphrase of this document with our AI Paraphraser


⊘ This is a preview!⊘
Do you want full access?
Subscribe today to unlock all pages.
Trusted by 1+ million students worldwide

INTRODUCTION
With passage of time period business firms are facing many new business problems. It is
very difficult to solve them. In current time period managers are using advanced tools and
methods to solve the business problem. Statistics is the one of those advanced tools that is used
to identify root cause of business problem and eliminating same. In the current report various
statistical tools are applied on the cash flows and firm performance is measured. In middle part
of the report formal business report is prepared. At end of the report, project evaluation method
is used and viability of project is measured and comments are made on same. In this way entire
research work is carried out in the report.
TASK 1
1.1Colleciton of data for the research
In order to do a research it is very important to understand the research topic in better way.
In this regard it is necessary to collect both sort of data which are primary and secondary. There
is a lot of big difference in both sort of data in terms of use. Whenever, anyone intends to carry
out research on the specific topic it is inevitable to comprehend same completely. Until, on does
not understand the research topic completely he cannot carry out the research in systematic way.
In order to solve this problem usually researches gather both sort of data whether it is primary or
secondary in nature (Reimann and et.al., 2011). First of all in the present study secondary data
will be gathered from reliable sources. In this regard, books journal and magazines will be
reviewed. This will help researcher in identifying the developments that in respect to research
topic happened in previous years. After collecting secondary data primary data will be gathered.
In this regard questionnaire will be distributed among the respondents. In this regard appropriate
sampling method will be used by the researcher. By following that sampling method sample
units will be selected for the research. Questionnaire will be given to all respondents and in this
way primary data will be collected from the sample units. This is the entire process that will be
followed to collect primary and secondary data for the present study.
1.2 Sampling method and survey methodology
In the current research sample of the 50 people will be taken from the population.
Appropriate sampling method will be used to take appropriate decisions in respect to formation
Paraphrase This Document
Need a fresh take? Get an instant paraphrase of this document with our AI Paraphraser

of sample for the present research. Researchers often use varied sampling methods in their
research. Some of the sampling methods that are used by the researchers are explained below.
Simple random sampling method: This method of sampling is usually used by
individuals in their research work. It is very easy to use this sampling method in the
present research. This is because in this sampling method one according to his will take
sample units from the population (Siegel, Naishadha and Jemal, 2012). When it is not
important to select specific type of people in the research study this sampling method is
used by the researchers. In the current study mentioned approach will not be employed.
This is because it is very important to measure the consumer behavior of the people that
are different from each other in respect to age, gender, occupation, income level and
education etc.
Stratified sampling method: It is the one of the method that is used by the researchers in
their research study. In this sampling approach one on the basis of demographic factors
split population in different strata. According to demographic factor on the basis of which
one wants to take sample units population is divided in to varied parts and sample units
are taken from same. This method will be used in the present study. This is because by
using same research can be conducted in better way and broad understanding can be
developed about the different sort of customers.
Cluster sampling: This method to some extent is similar to stratified sampling method.
This is because in this method also population is classified in different divisions in terms
of specific geographic area (Verzani, 2014). From different geographic areas sample
units are taken from population. This approach of sampling is used to conducted survey
that are related to general public.
Convenience sampling: Convenience sampling is another approach that is used for
picking specific individuals as respondents from population. In this method one by
considering his convince or comfort zone take for entire sample for the research. This
method is sometimes used by the researcher instead of random sampling method.
1.3 Questionnaire for research
Name...
Age....
Income....

1. In order to take lunch or dinner in a month how many times you come in the Murano
restaurant.
1 ( )
2 ( )
3 ( )
More than 3 times ( )
2. Excellent quality services are provided to the customers by the Murano restuarant?
Agree ()
Strongly agree ()
Neutral ()
Disagree ()
Strongly disagree ()
Highly dissatisfied ()
3. There are some factors that play a decisive role in choice of restaurant. To which factor you
give due importance while selecting any restaurant for taking lunch or dinner.
Ambiance ( )
Nearness to house ( )
Cost of dishes ( )
Hygiene ( )
4. Interior plays a very important role in originating good image of the restaurant among the
people?
Yes ()
No ()
5. Which sort of things you often prefer to get in the dish you order at Murano restaurant?
Spicy ()
Healthier ()
Both ()
6. Ordered item is available to you on time in the Murano restaurant?
Agree ( )
Strongly agree ( )
Neutral ( )
⊘ This is a preview!⊘
Do you want full access?
Subscribe today to unlock all pages.
Trusted by 1+ million students worldwide
Disagree ( )
Strongly disagree ( )
7.Employees of the Murano employees with full courtesy serve customers?
Agree ( )
Strongly agree ( )
Neutral ( )
Disagree ( )
Strongly disagree ( )
8. Name of some competitors of the Murano restaurant is given below. Which of these firms is
giving tough competition to the Murano restaurant?
Balti palace ()
Blackfriars restaurant ()
Food for friends ()
9. Reasonable amount is charged by the Murano restaurant on the customers for its dishes?
Agree ()
Strongly agree ()
Neutral ()
Disagree ()
Highly disagree()
TASK 2
2.1 Statistical tools and their applications
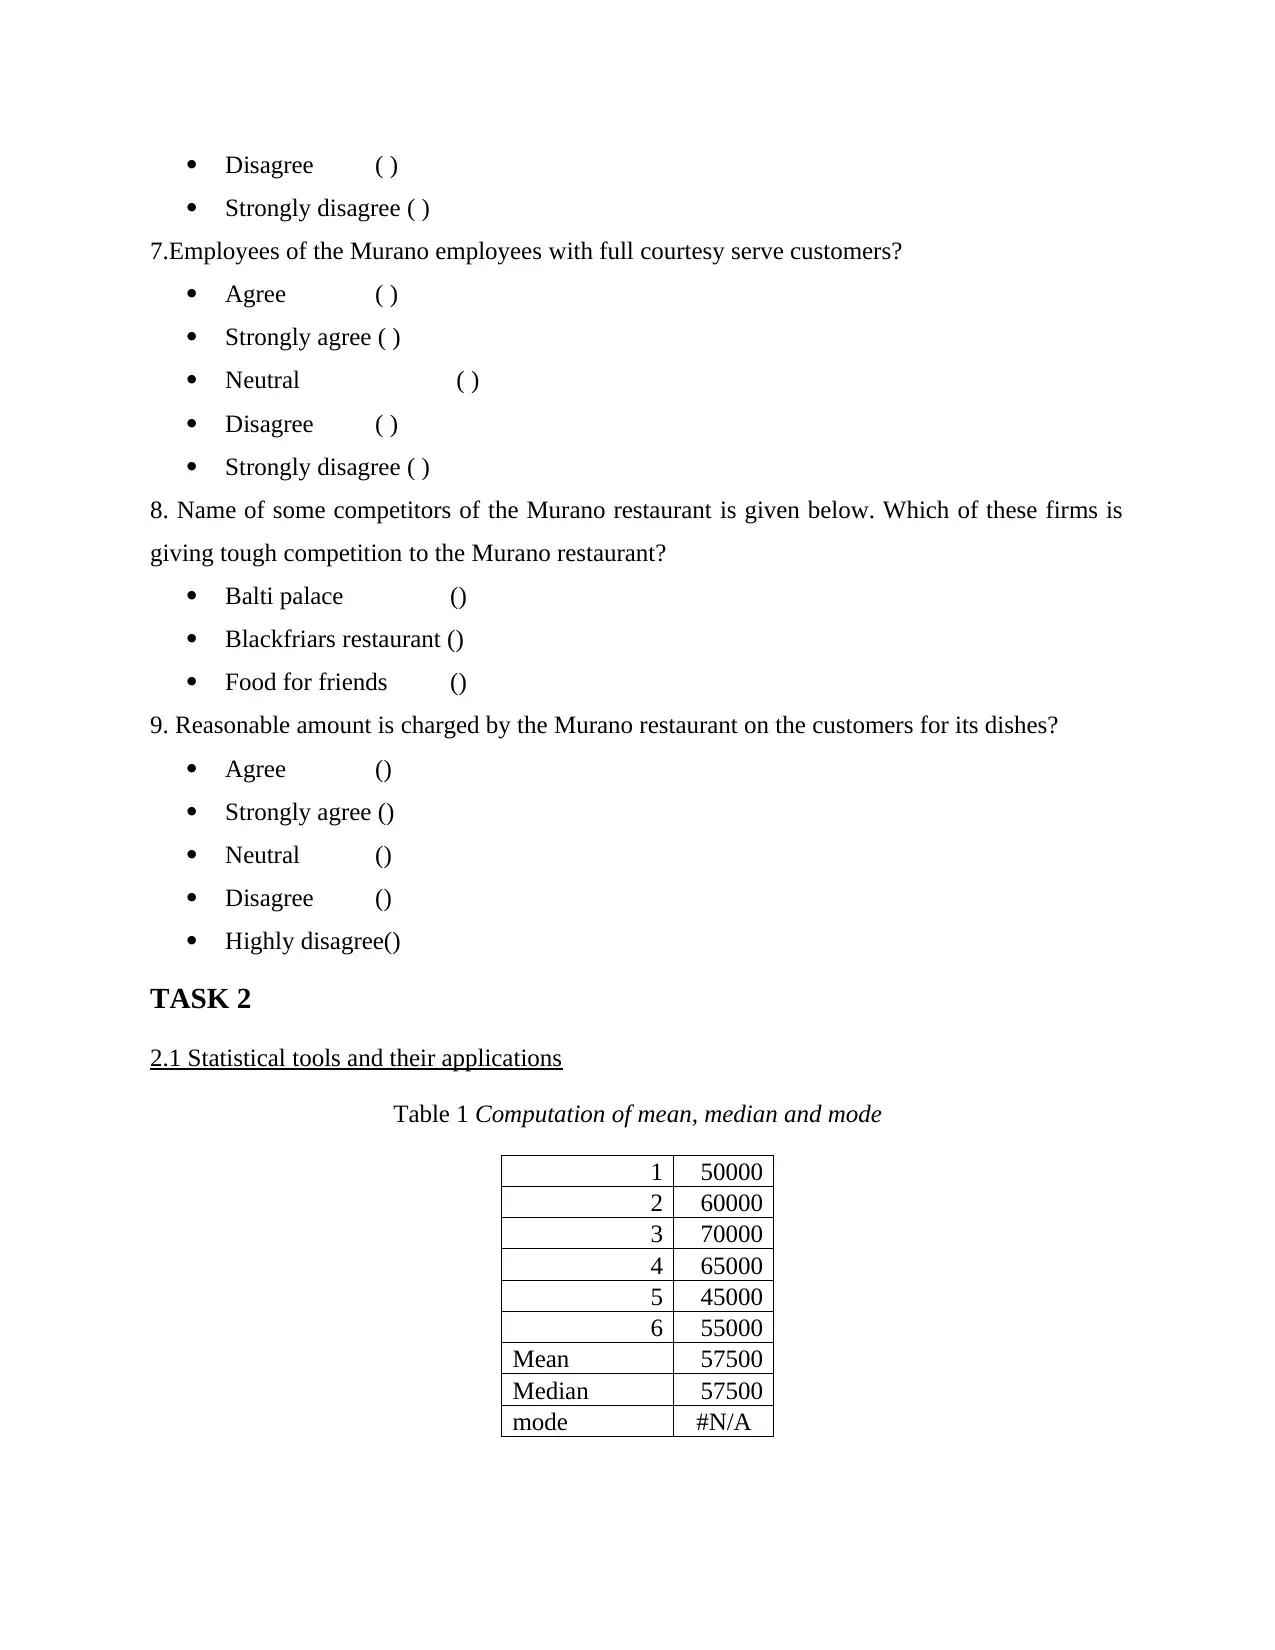
Table 1 Computation of mean, median and mode
1 50000
2 60000
3 70000
4 65000
5 45000
6 55000
Mean 57500
Median 57500
mode #N/A
Strongly disagree ( )
7.Employees of the Murano employees with full courtesy serve customers?
Agree ( )
Strongly agree ( )
Neutral ( )
Disagree ( )
Strongly disagree ( )
8. Name of some competitors of the Murano restaurant is given below. Which of these firms is
giving tough competition to the Murano restaurant?
Balti palace ()
Blackfriars restaurant ()
Food for friends ()
9. Reasonable amount is charged by the Murano restaurant on the customers for its dishes?
Agree ()
Strongly agree ()
Neutral ()
Disagree ()
Highly disagree()
TASK 2
2.1 Statistical tools and their applications
Table 1 Computation of mean, median and mode
1 50000
2 60000
3 70000
4 65000
5 45000
6 55000
Mean 57500
Median 57500
mode #N/A
Paraphrase This Document
Need a fresh take? Get an instant paraphrase of this document with our AI Paraphraser

There are many descriptive tools that are used by the business firms. Some of the most
commonly used descriptive tools are given below.
Mean: It is the tool that is used by each and every data scientist when he analyze the specific
data. Whenever one try to solve business problems comes in existence managers use analytic
tools to solve the problems (Ward and et.al., 2014). Advanced methods like time series analysis
and regression are used by the mangers to identify the relationship among the variables. But
before using these tools managers use mean which is major component of the descriptive
statistics. This tool is used by the data scientist to get overview of the variable. Average
performance of the variable is measured by using this tool. After application of this tool other
advanced method of statistics are used by the managers. It can be said that there is a great
importance of the mean as an analytic tool.
Median: Other then mean median is another important part of the descriptive statistics. It is well
known fact that data that is related to the company is huge in length. Hence, it is not possible for
one to identify the trend by taking a single view of the data. It is very important to classify data
set in to multiple parts. By analyzing these different parts trends can be identify in better way
which exist in the huge set of figures. Median is the tool which does same work and helps one in
classifying set of values in equivalent parts. It can be said that median is a very important
statistical tool.
Mode: Mode is the tool which is used by one to find answer of the question whether there is a
specific value which is repeating number of times in the data set. If there is a value which is
occurring many times in the set of figures then it means that there is a specific trend that is
coming in existence again and again (Givens and Hoeting, 2012). By using mode business
decisions are made by the managers in right direction.
2.2 Analysis of descriptive statistics results
Results of the mean, median and mode are described below.
Mean: Variable that is taken in to account for analysis is sales of the Murano restaurant. It can
be seen that mean value of sales is 57500. This means that on average basis firm at least observe
sale of the 57500 in its basis for a specific time period. Current sales of the firm are 55,000. This
reflects that firm means sales value is above current sale. It can be said that firm failed to give
excellent performance in its business. Firm failed to achieve at lease average sales in its business.
This reflects that condition of the Murano restaurant is critical.

Median: Value of median in the table is 57500 and it is the value that is dividing entire set of
figures in to multiple parts. It can be seen that above sales value sales of the firm is increasing
but at a reduced rate. It can be seen after median value that sales of the firm are declining.
However, at end rebound in sales is observed. This is good signal for the business firm. It can be
said that firm needs to improve its performance.
Table 2 Percentage change in sales
1 50000
2 60000 20%
3 70000 17%
4 65000 -7%
5 45000 -31%
6 55000 22%
Mode: It can be observed from the above table that there is no value of mode. This means that
there is no value in the data set that is occurring again and again. Due to this reason there is no
value of mode.
2.3 Calculation of standard deviation
Table 3 Calculation of standard deviation
1 50000
2 60000
3 70000
4 65000
5 45000
6 55000
STDEV 9354.143
Interpretation
Standard deviation is the tool which is commonly used by the data scientist in order to
analyze the variable. Standard deviation reflects the distance between average value of the
variable and current value of same. Higher is the distance between current and average value
more performance on the specific variable is assumed good or bad. Interpretation of the standard
⊘ This is a preview!⊘
Do you want full access?
Subscribe today to unlock all pages.
Trusted by 1+ million students worldwide

deviation depends on the variable. It is not necessary that if elevation in standard deviation is
assumed good for one variable then same result will prove good for other variable (Jerven,
2013). For example if variable on which research study is undertaken is sales then elevation in
standard deviation will be assumed good for the business firm. Contrary to this, if other variable
is cost then in that case elevation in standard deviation cannot be assumed good for the business
firm. Standard deviation of the sales variable is 9354 which is big in number. On this basis it can
be said that value of the variable is highly deviating from the average value of the sales variable.
Hence, it can be said that firm performance is fluctuating and it is not good for the business.
Efforts needs to be made to brings stability in the business performance.
2.4 Calculation of quartile and correlation
Table 4 Calculation of quartile and correlation
1 50000 5000
2 60000 6000
3 70000 7000
4 65000 6500
5 45000 4500
6 55000 5500
Q1 51250
Q2 57500
Q3 63750
Correlation 1
Interpretation
Correlation is the tool which is used in the analytics by the data scientists in order to find
out relationship between two variables. It can be seen from the table that value of correlation is
one and this means that there is a very strong relationship among the variables. Correlation value
always remains in range of -1 to +1 (Nalimov, 2014). There are three possibilities that can be
identified in respect to variable sales. Either there may be positive relationship among the
variables or there may be negative relationship between variables. It is possible that there is no
relationship among the variables. In the present case it is identified that there is a very strong
relationship among the variables. This means that with change in sales profit also get changed.
Paraphrase This Document
Need a fresh take? Get an instant paraphrase of this document with our AI Paraphraser

Quartile is another important tool that is widely used to analyze the set of figures. Quartile is the
tool which split set of figures in to four parts. It can be seen from the table that quartile that value
is increasing consistently. From the set of values it can be seen that values are fluctuating and
this means that firm performance is not consistent. Hence, it can be said that firm needs to
improve its business performance.
TASK 3
3.1Grpahical representation of data
In order to take lunch or dinner in a month how many times you come in the Murano restaurant.
1 30
2 10
3 5
More than 3 5
Figure 1 Frequency of lunch taken by the people
Interpretation
Research results show that in terms of taking lunch and dinner people preference is
different from each other. It can be seen from the table that there are 30 respondents out of 50
who visit restaurant single time in a month. There are 10 respondents out of 50 people who state
that they visit Murano restaurant 2 times in a month. There are only 5 respondents who think that
they visit Murano restaurant three times in a month. There are only 5 respondents who visit
Murano restaurant more than three times in a month.

Ordered item is available to you on time in the Murano restaurant?
Agree 10
Strongly agree 27
Neutral 5
Disagree 5
Strongly
disagree 3
Figure 2 People response on the availability of ordered items on time
Interpretation
It can be seen from the table that there are 10 respondents who are agree on the statement
that ordered item is available on time to the customers at the Murano restaurant. There are 27
respondents out of 50 who are strongly agree on the fact that dishes are available in short time
period to the customers in the Murano restaurant. There are only 5 respondents out of 50 who are
neutral on the asked statement. Same numbers of people are disagree on same statement. 3
respondents are strongly disagreeing on the asked statement. Hence, it can be said that there are
only few respondents who think that ordered items are not available to the customers on time in
the Murano restaurant.
⊘ This is a preview!⊘
Do you want full access?
Subscribe today to unlock all pages.
Trusted by 1+ million students worldwide
1 out of 18
Related Documents


Your All-in-One AI-Powered Toolkit for Academic Success.
+13062052269
info@desklib.com
Available 24*7 on WhatsApp / Email
![[object Object]](/_next/static/media/star-bottom.7253800d.svg)
Unlock your academic potential
Copyright © 2020–2026 A2Z Services. All Rights Reserved. Developed and managed by ZUCOL.