Business Decision Making Report: Statistical Analysis and Findings
VerifiedAdded on 2020/01/15
|27
|5487
|163
Report
AI Summary
This report provides a comprehensive analysis of business decision-making processes, employing various statistical tools and techniques. The report begins with an introduction that emphasizes the importance of efficient decision-making for business success, setting the stage for the evaluation of case studies and business scenarios. Task 1 focuses on the Crossrail Project, examining its background, rationale, objectives, methodology, data analysis, and budget. It includes a questionnaire designed to gather primary data from the public. Task 2 delves into statistical analysis, calculating mean, mode, and median to analyze customer spending data, along with measures of dispersion like range and standard deviation, and percentiles. Task 3 uses line graphs and scatter plots to analyze advertising costs and sales data, including trend lines and business presentations. Task 4 involves project management techniques, preparing a network diagram, calculating project duration, identifying the critical path, and creating a Gantt chart. Additionally, it assesses investment appraisal techniques through the calculation of Net Present Value (NPV) and Internal Rate of Return (IRR) for two projects, concluding with recommendations based on the findings. The report integrates both qualitative and quantitative methods to provide a thorough examination of business decision-making.

BUSINESS DECISION
MAKING
MAKING
Paraphrase This Document
Need a fresh take? Get an instant paraphrase of this document with our AI Paraphraser
TABLE OF CONTENTS
INTRODUCTION...........................................................................................................................1
TASK 1............................................................................................................................................1
1.1 Background............................................................................................................................1
1.1 Rationale................................................................................................................................2
1.1 Objectives of the research......................................................................................................2
1.2 Methodology..........................................................................................................................2
1.2 Data Analysis.........................................................................................................................3
1.2 Time Frame............................................................................................................................3
1.2 Budget section.......................................................................................................................4
1.3 Questionnaire.........................................................................................................................4
TASK 2............................................................................................................................................6
2.1 & 2.2 Mean, Mode and Median.............................................................................................6
2.3 Range and Standard Deviation..............................................................................................8
2.4 25th Percentile (Lower 25th Percentile (Lower Quartile) and 75th Percentile (Upper
Quartile) and use of Percentile....................................................................................................9
TASK 3..........................................................................................................................................11
3.1 & 4.1 Produce line graph.....................................................................................................11
Scatter Plot on Advertising costs and sales...............................................................................15
3.2 & 4.1 Trend Lines................................................................................................................16
3.3 Business presentation...........................................................................................................18
3.4 Formal Business Report.......................................................................................................18
TASK 4..........................................................................................................................................19
4.2 Prepare a network diagram for activities using Microsoft Project......................................19
Calculate Project Duration.........................................................................................................20
Clearly mark the Critical Path...................................................................................................20
Prepare a Gantt chart and state the benefits of using it as a Project Management Tool............21
TASK 4 B......................................................................................................................................21
4.3 Calculation of Net present value and internal rate of return................................................21
Recommendations......................................................................................................................25
CONCLUSION..............................................................................................................................25
REFERENCE................................................................................................................................26
INDEX OF TABLES
Table 1: Descriptive Analysis..........................................................................................................6
Table 2: Measure of Dispersion.......................................................................................................8
Table 3: Correlation and Coefficient.............................................................................................11
Table 4: Project A @ 10%.............................................................................................................22
Table 5: Project A @ 20%.............................................................................................................22
Table 6: Project B @ 10%.............................................................................................................23
Table 7: Project B @ 20%.............................................................................................................24
ILLUSTRATION INDEX
Illustration 1: Line graph...............................................................................................................14
Illustration 2: Net Income Generated by 5 Branches of the company in 2015..............................15
Illustration 3: Bar Graph of Net Income Generated by 5 Branches of the company in 2015........15
Illustration 4: Advertising and Sales data 2000-2013....................................................................16
Illustration 5: Scatter Plot on Advertising costs and sales.............................................................16
Illustration 6: Advertising costs ....................................................................................................17
Illustration 7: Sales........................................................................................................................18
Illustration 8: Network Diagram....................................................................................................20
Illustration 9: Gantt chart...............................................................................................................21
⊘ This is a preview!⊘
Do you want full access?
Subscribe today to unlock all pages.
Trusted by 1+ million students worldwide
INTRODUCTION
In the present business environment, every business entity determines various strategies
in order to take different management decisions with an appropriate manner. The is because an
efficient decision-making process ensures the success of organization. By taking different
strategic decisions with an appropriate manner, management can improve operational
capabilities and efficiency of business entity with reference to short and long term business goals
(Hofmann, 2007). In this process, management examines several factors that are having direct
impact on outcomes of business decisions. It also supports management for selection of best
alternative from various options as per the distinct business requirement. The present report is
carried out detail evaluation of different case studies and business scenarios and develops
appropriate strategies to generate appropriate outcomes. In this process, wide range of statistical
tools and techniques are applied for evaluation of distinct kind of data in order to take
appropriate decisions. In the context present study, this report also uses different investment
appraisal tactics through which an organization is able to select best investment alternative for
business expansion that would increase profitability of company and reduces risk related to
investment.
TASK 1
1.1 Background
As per the given, it is found that Government of UK is planning to initiate a Crossrail
Project through which the public authority of UK will be able to enhance the local transport
connectivity within London. This project will increase transportation facilities so as citizen
would get quick and high speed mode of transportation. The primary objective of this project is
to offer city transport facilities to more than 1.5 million. Furthermore, this project provides
significant support to public authorities in the form of employment, leisure and other business
operation. As per the case study, it is addressed that the first cross-rail will be started from
central London in late 2018 and will carry more 200 million passenger annually. Furthermore, it
will reduce the journey time across London with the help of a high speed and affordable mode of
transportation. The project cross-rail will be beneficial of public authorities and local citizen
because it will transform the rail transportation and increase the capacity of public transport by
10%. Therefore, it can be stated that success of the project is greatly depending on its timely
1
Paraphrase This Document
Need a fresh take? Get an instant paraphrase of this document with our AI Paraphraser
completion so as government authorities have to develop various strategies and need to take
appropriate management decision in order to keep the project on the right track.
1.1 Rationale
The primary objective this project is to enhance transportation services to local citizen
along with external so as people would get comfortable and quick transportation facilities. In
addition to that this project will be found very effective in minimizing the road traffic through
pollution level can be controlled. It ensures safety of environment by lowering pollution level
(Lucey, 2005). Furthermore, the investigator is focusing on assessment of the benefits of
Crossrail project for the local community along with external visitor. Therefore, the present
investigation is carried out to evaluate several factors of cross-rail project that assists researcher
in facilitation of appropriate and detail information about the benefits of the project of
government officials and managers of public authorities.
1.1 Objectives of the research
The primary objective of the present research is examining positive aspect of the Cross
Rail project for the local community of London. In addition to that the present research is
scheduled to evaluate the budget and time frame associated with cross-rail project. The three
main objective of the present investigation are mentioned below:
To assess the positive outcomes of the project that would be assessed by general public.
To identify whether this project will provide significant benefits to economy of London.
To evaluate the role of cross-rail project in completion of future transportation
requirement.
1.2 Methodology
With reference to present given scenario, investigator requires to assess wide range of
information to generate appropriate and accurate outcomes therefore researcher is applying both
primary and secondary information associated with the Crossrail project that would assist public
authority in order to take appropriate business decisions for attainment project goals. In this
context, researcher has selected the random sampling approach for selection of best sample
through investigator would assess appropriate information for public authorities (Hacklin and
Wallnöfer, 2012). For collection of first hand information, a sample of 50 local citizens will be
taken by researcher who will be affected from cross-rail project. Firstly, qualitative techniques
researcher will be found very effective to enhance the understanding about the perception of
2
local people towards particular project that would helps researcher for generating appropriate
research outcomes as per the aim of present research. Along with this, using quantitative
techniques will be found very effective in evaluation of different statistics along with numerical
data (Nicholson and Aman, 2012). In primary section, people of London will be provided
questionnaire for assessment of the perception of people about the project of cross-rail through
which public authorities are able to take appropriate decision associated with the project.
1.2 Data Analysis
In the present study, researcher will apply distinct tools for evaluation of data that have
been gained from distinct sources. In this context, thematic and statistical approaches will be
considered by researcher. However, thematic analysis will provide significant assistance in
evaluation of the subjective or qualitative that will be acquired in the form of primary data or
through questionnaire (Wallnöfer and Hacklin, 2012). On the other hand, statistical approach
will help investigation in order to interpret the numerical information associated with budget and
cost of project along with its benefits to public authorities
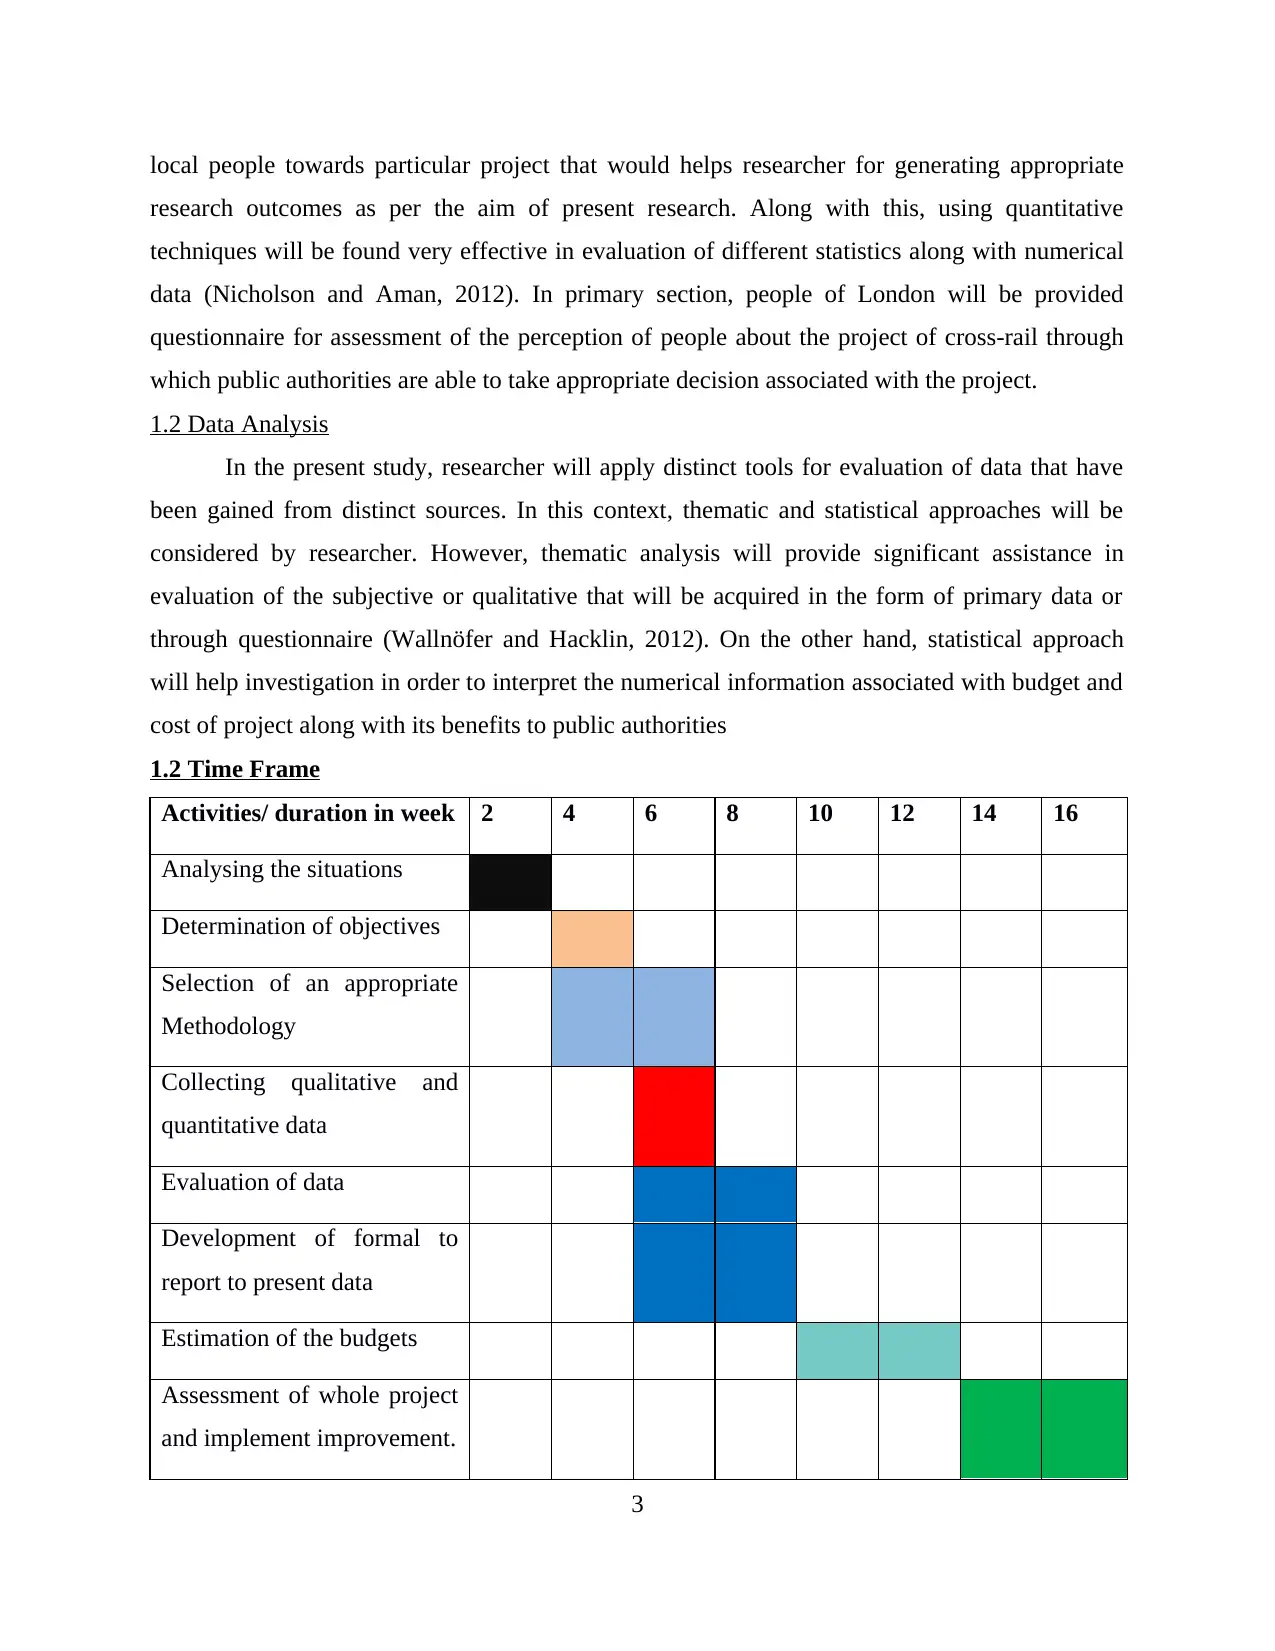
1.2 Time Frame
Activities/ duration in week 2 4 6 8 10 12 14 16
Analysing the situations
Determination of objectives
Selection of an appropriate
Methodology
Collecting qualitative and
quantitative data
Evaluation of data
Development of formal to
report to present data
Estimation of the budgets
Assessment of whole project
and implement improvement.
3
research outcomes as per the aim of present research. Along with this, using quantitative
techniques will be found very effective in evaluation of different statistics along with numerical
data (Nicholson and Aman, 2012). In primary section, people of London will be provided
questionnaire for assessment of the perception of people about the project of cross-rail through
which public authorities are able to take appropriate decision associated with the project.
1.2 Data Analysis
In the present study, researcher will apply distinct tools for evaluation of data that have
been gained from distinct sources. In this context, thematic and statistical approaches will be
considered by researcher. However, thematic analysis will provide significant assistance in
evaluation of the subjective or qualitative that will be acquired in the form of primary data or
through questionnaire (Wallnöfer and Hacklin, 2012). On the other hand, statistical approach
will help investigation in order to interpret the numerical information associated with budget and
cost of project along with its benefits to public authorities
1.2 Time Frame
Activities/ duration in week 2 4 6 8 10 12 14 16
Analysing the situations
Determination of objectives
Selection of an appropriate
Methodology
Collecting qualitative and
quantitative data
Evaluation of data
Development of formal to
report to present data
Estimation of the budgets
Assessment of whole project
and implement improvement.
3
⊘ This is a preview!⊘
Do you want full access?
Subscribe today to unlock all pages.
Trusted by 1+ million students worldwide
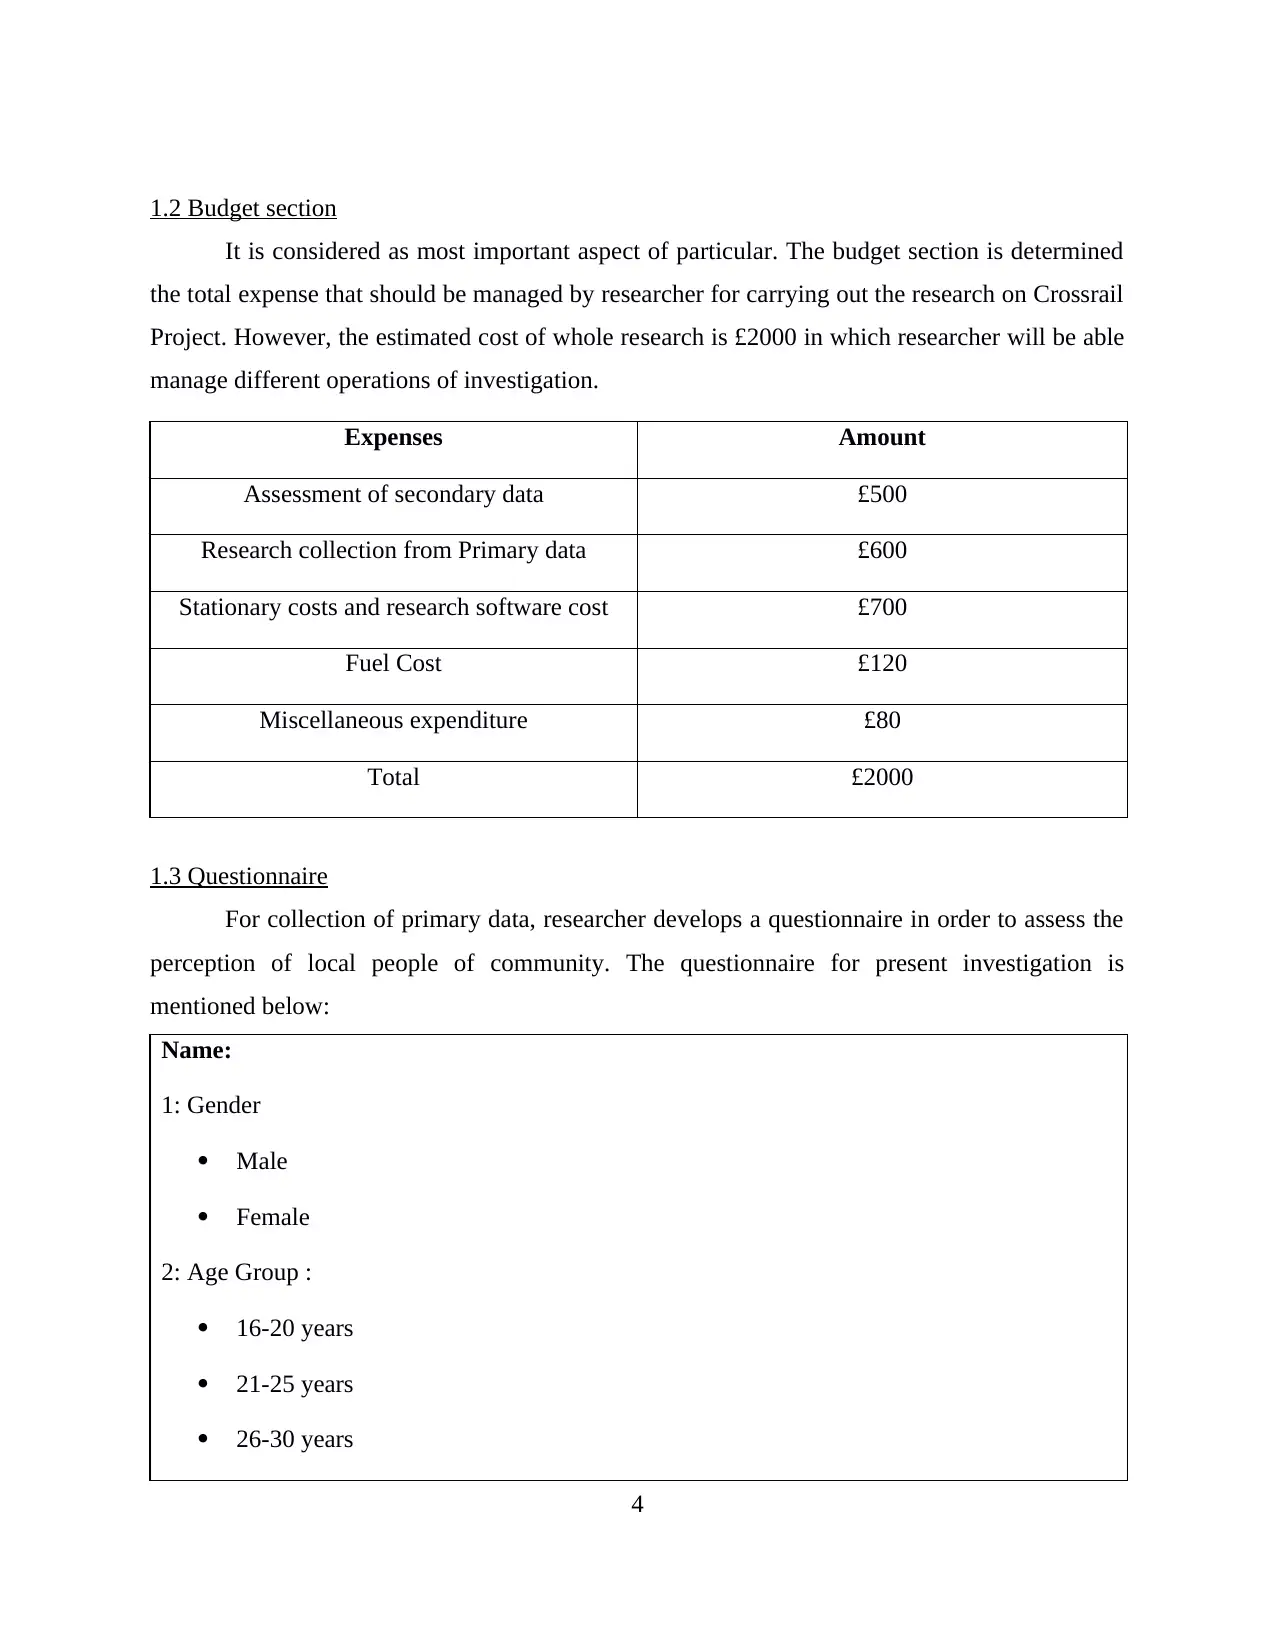
1.2 Budget section
It is considered as most important aspect of particular. The budget section is determined
the total expense that should be managed by researcher for carrying out the research on Crossrail
Project. However, the estimated cost of whole research is £2000 in which researcher will be able
manage different operations of investigation.
Expenses Amount
Assessment of secondary data £500
Research collection from Primary data £600
Stationary costs and research software cost £700
Fuel Cost £120
Miscellaneous expenditure £80
Total £2000
1.3 Questionnaire
For collection of primary data, researcher develops a questionnaire in order to assess the
perception of local people of community. The questionnaire for present investigation is
mentioned below:
Name:
1: Gender
Male
Female
2: Age Group :
16-20 years
21-25 years
26-30 years
4
Paraphrase This Document
Need a fresh take? Get an instant paraphrase of this document with our AI Paraphraser

31-35 years
35 and above
3: Do you have knowledge about the upcoming “Crossrail” project of the government of UK?
Yes
No
4: According to you what is the most important benefit that would you assess from cross rail
project?
Enhancing travel experience
Increase in connectivity of the public transportation
New experience of travelling around the capital
Reduction in load on existing transportation system
5: Do you think, Crossrail project would develop new opportunities for employment?
Yes
No
6: Do you agree that Crossrail will be found as important milestone of economic growth in the
London?
Strongly Agree
Agree
Neutral
Disagree
Strongly Disagree
7: Would you like to you use different services of Crossrail Project?
Yes
No
5
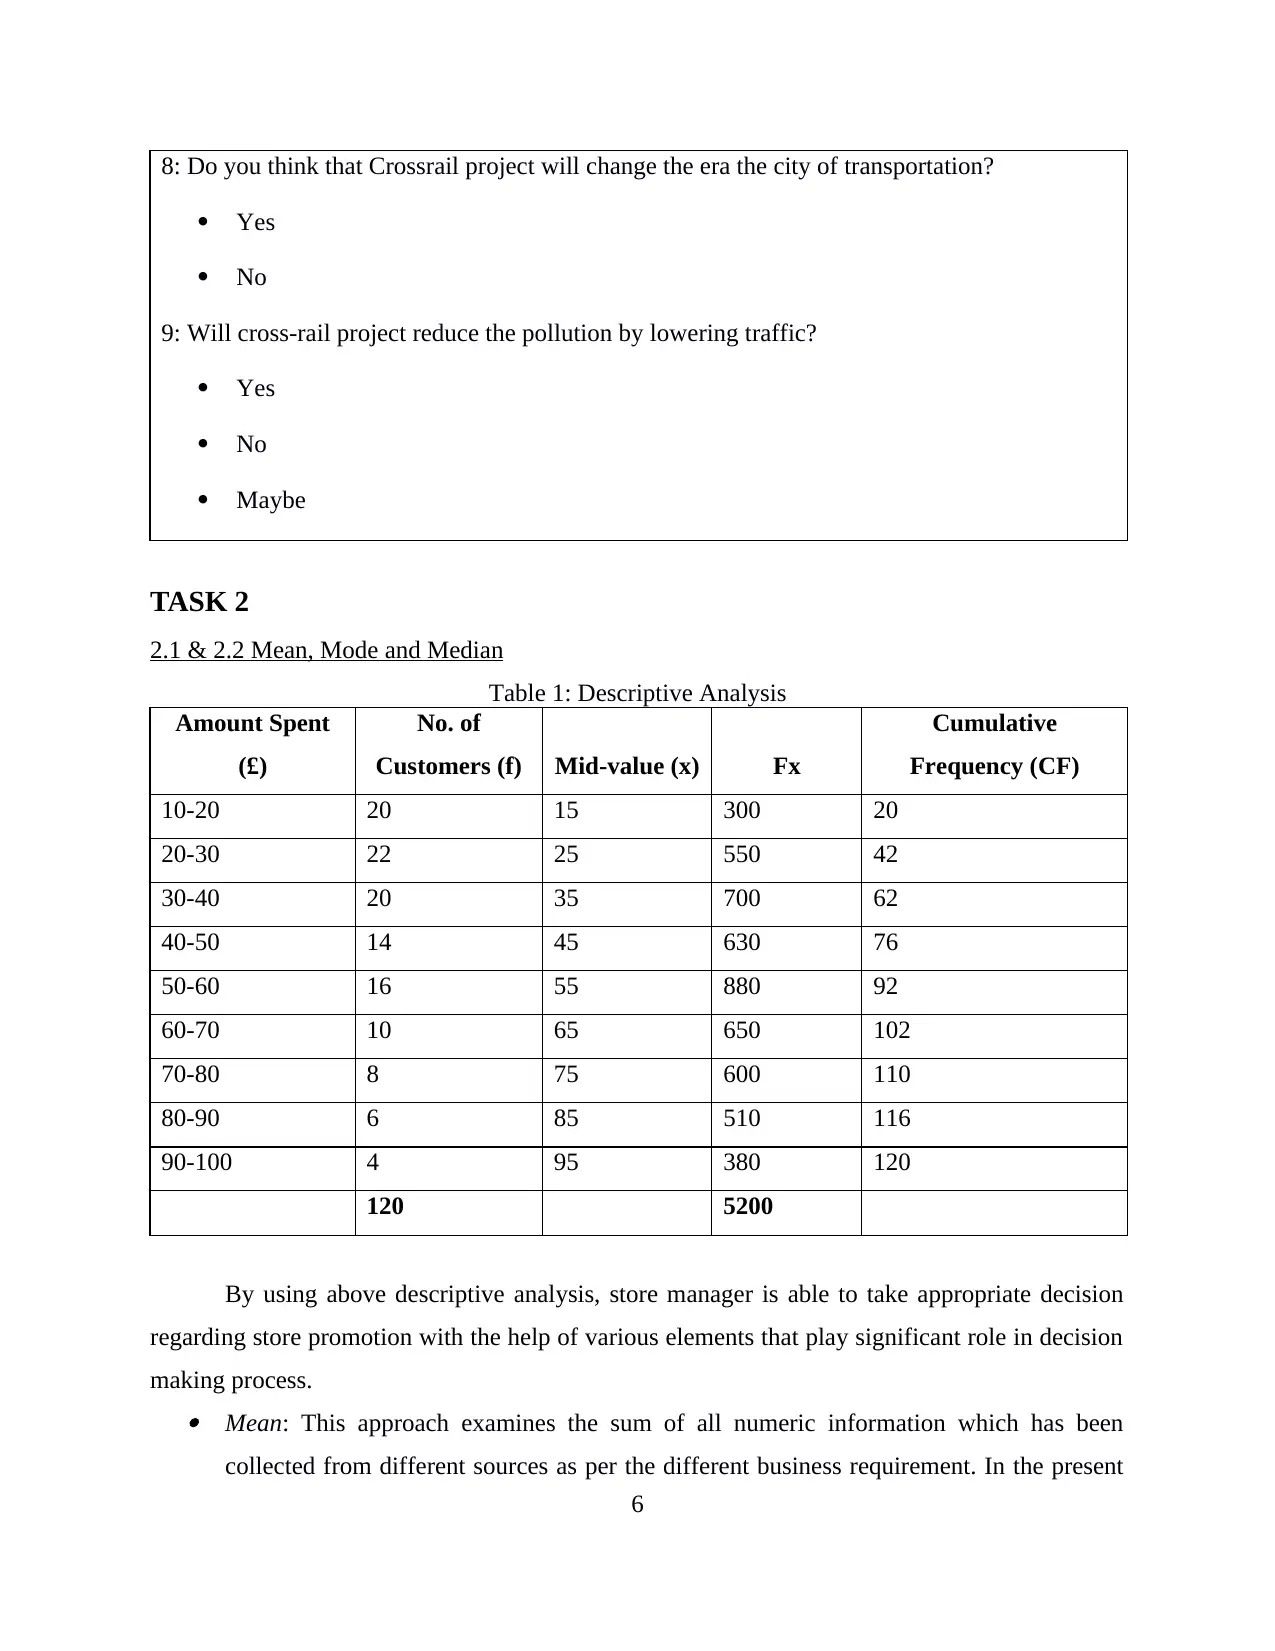
8: Do you think that Crossrail project will change the era the city of transportation?
Yes
No
9: Will cross-rail project reduce the pollution by lowering traffic?
Yes
No
Maybe
TASK 2
2.1 & 2.2 Mean, Mode and Median
Table 1: Descriptive Analysis
Amount Spent
(£)
No. of
Customers (f) Mid-value (x) Fx
Cumulative
Frequency (CF)
10-20 20 15 300 20
20-30 22 25 550 42
30-40 20 35 700 62
40-50 14 45 630 76
50-60 16 55 880 92
60-70 10 65 650 102
70-80 8 75 600 110
80-90 6 85 510 116
90-100 4 95 380 120
120 5200
By using above descriptive analysis, store manager is able to take appropriate decision
regarding store promotion with the help of various elements that play significant role in decision
making process. Mean: This approach examines the sum of all numeric information which has been
collected from different sources as per the different business requirement. In the present
6
Yes
No
9: Will cross-rail project reduce the pollution by lowering traffic?
Yes
No
Maybe
TASK 2
2.1 & 2.2 Mean, Mode and Median
Table 1: Descriptive Analysis
Amount Spent
(£)
No. of
Customers (f) Mid-value (x) Fx
Cumulative
Frequency (CF)
10-20 20 15 300 20
20-30 22 25 550 42
30-40 20 35 700 62
40-50 14 45 630 76
50-60 16 55 880 92
60-70 10 65 650 102
70-80 8 75 600 110
80-90 6 85 510 116
90-100 4 95 380 120
120 5200
By using above descriptive analysis, store manager is able to take appropriate decision
regarding store promotion with the help of various elements that play significant role in decision
making process. Mean: This approach examines the sum of all numeric information which has been
collected from different sources as per the different business requirement. In the present
6
⊘ This is a preview!⊘
Do you want full access?
Subscribe today to unlock all pages.
Trusted by 1+ million students worldwide
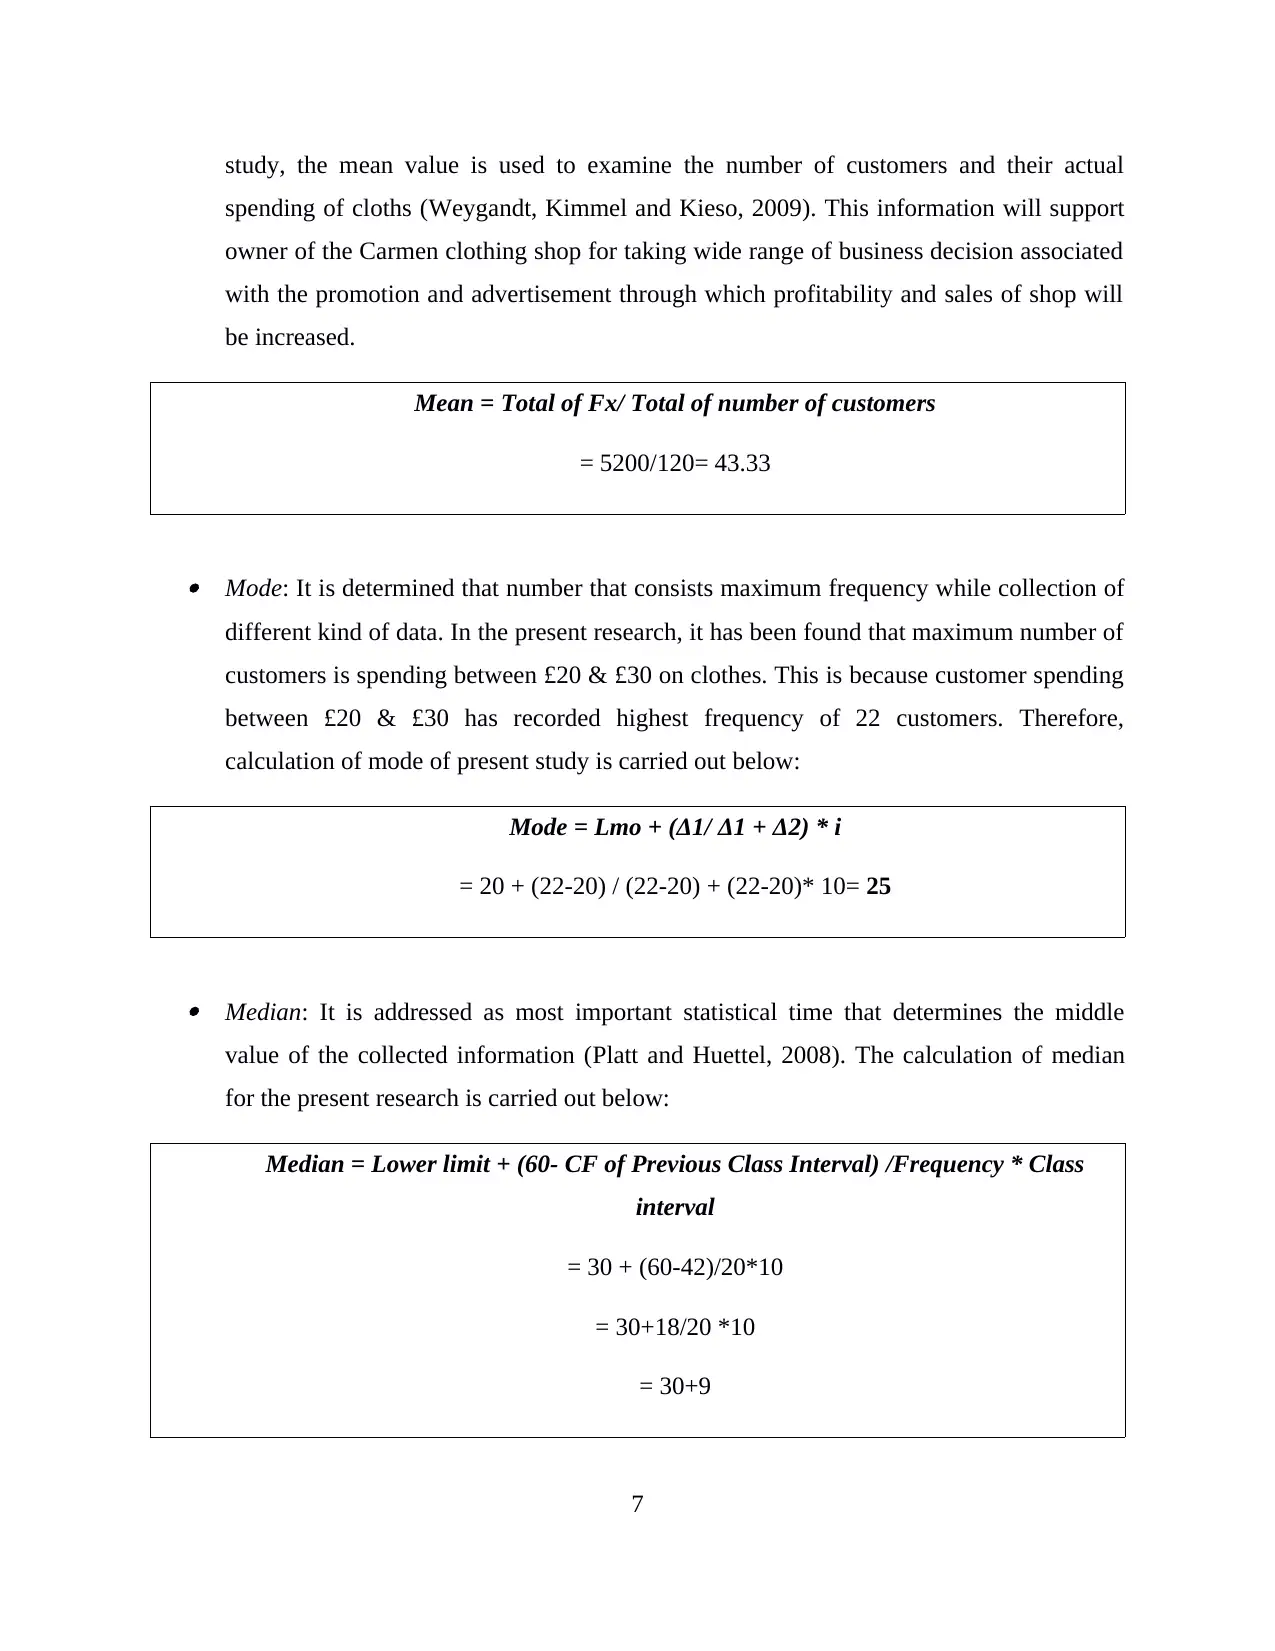
study, the mean value is used to examine the number of customers and their actual
spending of cloths (Weygandt, Kimmel and Kieso, 2009). This information will support
owner of the Carmen clothing shop for taking wide range of business decision associated
with the promotion and advertisement through which profitability and sales of shop will
be increased.
Mean = Total of Fx/ Total of number of customers
= 5200/120= 43.33
Mode: It is determined that number that consists maximum frequency while collection of
different kind of data. In the present research, it has been found that maximum number of
customers is spending between £20 & £30 on clothes. This is because customer spending
between £20 & £30 has recorded highest frequency of 22 customers. Therefore,
calculation of mode of present study is carried out below:
Mode = Lmo + (Δ1/ Δ1 + Δ2) * i
= 20 + (22-20) / (22-20) + (22-20)* 10= 25
Median: It is addressed as most important statistical time that determines the middle
value of the collected information (Platt and Huettel, 2008). The calculation of median
for the present research is carried out below:
Median = Lower limit + (60- CF of Previous Class Interval) /Frequency * Class
interval
= 30 + (60-42)/20*10
= 30+18/20 *10
= 30+9
7
Paraphrase This Document
Need a fresh take? Get an instant paraphrase of this document with our AI Paraphraser
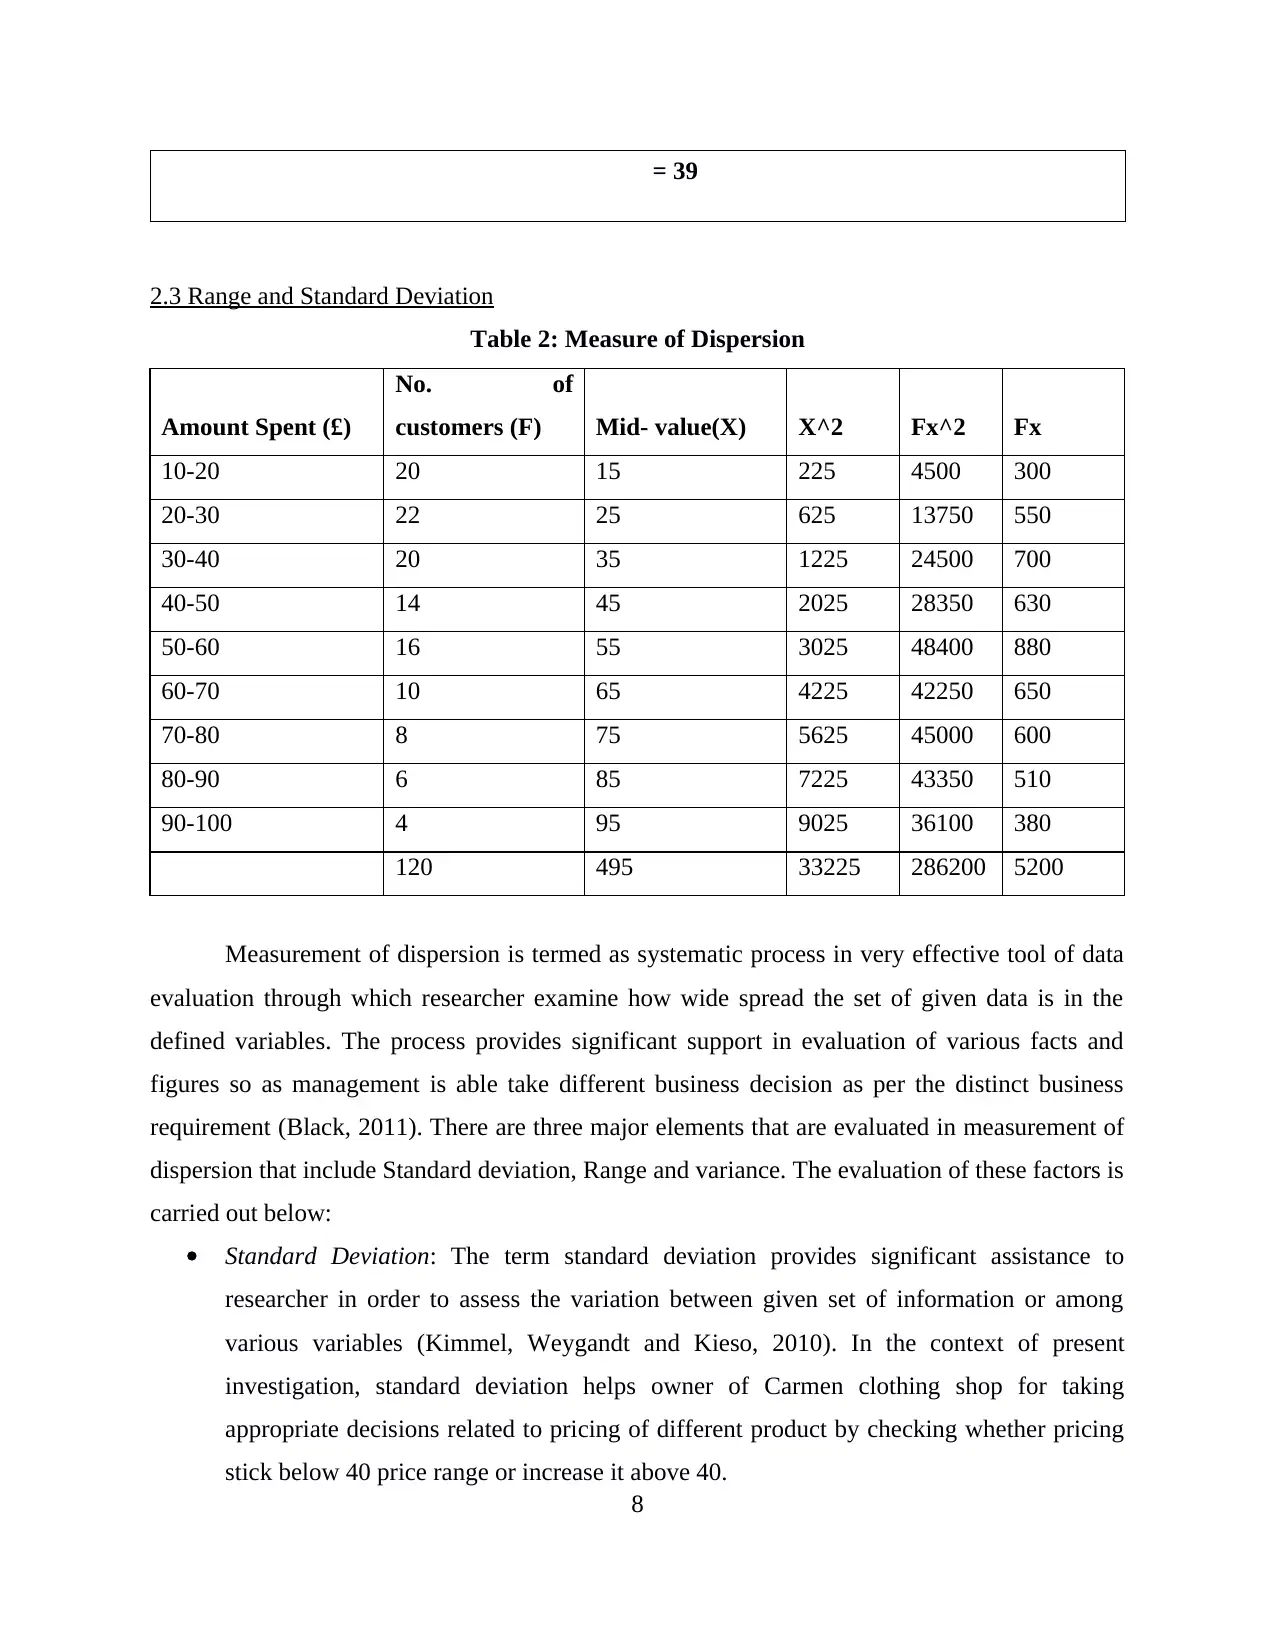
= 39
2.3 Range and Standard Deviation
Table 2: Measure of Dispersion
Amount Spent (£)
No. of
customers (F) Mid- value(X) X^2 Fx^2 Fx
10-20 20 15 225 4500 300
20-30 22 25 625 13750 550
30-40 20 35 1225 24500 700
40-50 14 45 2025 28350 630
50-60 16 55 3025 48400 880
60-70 10 65 4225 42250 650
70-80 8 75 5625 45000 600
80-90 6 85 7225 43350 510
90-100 4 95 9025 36100 380
120 495 33225 286200 5200
Measurement of dispersion is termed as systematic process in very effective tool of data
evaluation through which researcher examine how wide spread the set of given data is in the
defined variables. The process provides significant support in evaluation of various facts and
figures so as management is able take different business decision as per the distinct business
requirement (Black, 2011). There are three major elements that are evaluated in measurement of
dispersion that include Standard deviation, Range and variance. The evaluation of these factors is
carried out below:
Standard Deviation: The term standard deviation provides significant assistance to
researcher in order to assess the variation between given set of information or among
various variables (Kimmel, Weygandt and Kieso, 2010). In the context of present
investigation, standard deviation helps owner of Carmen clothing shop for taking
appropriate decisions related to pricing of different product by checking whether pricing
stick below 40 price range or increase it above 40.
8
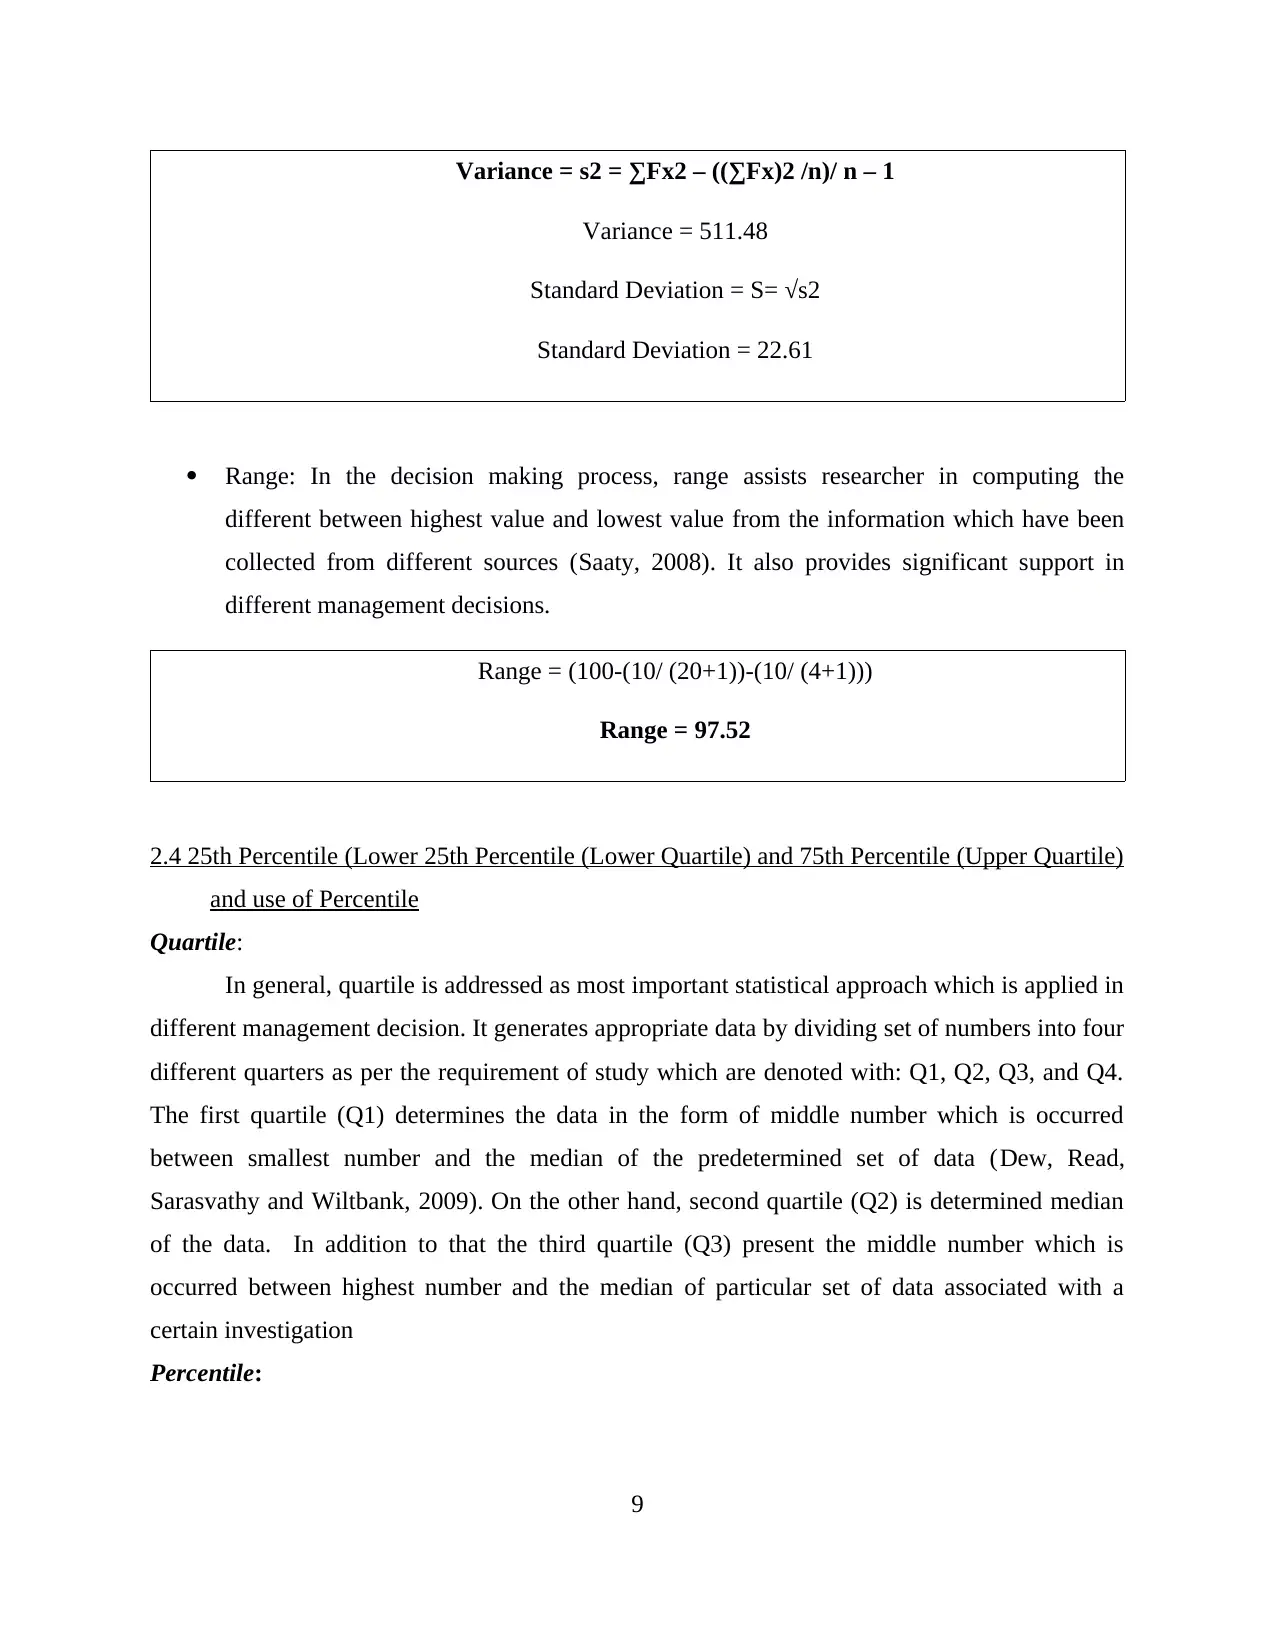
Variance = s2 = ∑Fx2 – ((∑Fx)2 /n)/ n – 1
Variance = 511.48
Standard Deviation = S= √s2
Standard Deviation = 22.61
Range: In the decision making process, range assists researcher in computing the
different between highest value and lowest value from the information which have been
collected from different sources (Saaty, 2008). It also provides significant support in
different management decisions.
Range = (100-(10/ (20+1))-(10/ (4+1)))
Range = 97.52
2.4 25th Percentile (Lower 25th Percentile (Lower Quartile) and 75th Percentile (Upper Quartile)
and use of Percentile
Quartile:
In general, quartile is addressed as most important statistical approach which is applied in
different management decision. It generates appropriate data by dividing set of numbers into four
different quarters as per the requirement of study which are denoted with: Q1, Q2, Q3, and Q4.
The first quartile (Q1) determines the data in the form of middle number which is occurred
between smallest number and the median of the predetermined set of data (Dew, Read,
Sarasvathy and Wiltbank, 2009). On the other hand, second quartile (Q2) is determined median
of the data. In addition to that the third quartile (Q3) present the middle number which is
occurred between highest number and the median of particular set of data associated with a
certain investigation
Percentile:
9
⊘ This is a preview!⊘
Do you want full access?
Subscribe today to unlock all pages.
Trusted by 1+ million students worldwide
1 out of 27
Related Documents


Your All-in-One AI-Powered Toolkit for Academic Success.
+13062052269
info@desklib.com
Available 24*7 on WhatsApp / Email
![[object Object]](/_next/static/media/star-bottom.7253800d.svg)
Unlock your academic potential
Copyright © 2020–2026 A2Z Services. All Rights Reserved. Developed and managed by ZUCOL.