Analysis of Business Decision Making for UK College Students
VerifiedAdded on 2023/04/04
|18
|4225
|220
Report
AI Summary
This report analyzes business decision-making processes, focusing on data collection, analysis, and interpretation within the context of UK College. It begins by outlining data collection methods, differentiating between primary and secondary data sources, and detailing survey methodologies, including questionnaire design and sample framing. The report then delves into data analysis, utilizing various tools and techniques like mean, median, and mode, along with measures of dispersion, quartile, percentile, and correlation analysis. Furthermore, it includes the use of graphs and trend lines for data visualization. The report also covers project planning, the use of software for decision-making, and the application of financial tools. This report is a comprehensive guide to business decision-making, providing practical insights and analysis.
Business Decision Making
Paraphrase This Document
Need a fresh take? Get an instant paraphrase of this document with our AI Paraphraser
Table of Contents
INTRODUCTION...........................................................................................................................3
TASK 1............................................................................................................................................4
1.1 Planning for collecting data..................................................................................................4
1.2 Survey methodology and sample framing.............................................................................6
1.3 Questionnaire for collecting data..........................................................................................7
TASK 2............................................................................................................................................8
2.1 & 2.2 Data analysis by using different tools and techniques and their interpretation..........8
2.3 Analysis of data by using the measures of dispersion...........................................................9
2.4 Explanation of quartile, percentile and coefficient correlation.............................................9
TASK 3..........................................................................................................................................11
3.1 Graph...................................................................................................................................11
3.2 Trend line............................................................................................................................11
3.3 To be covered in Power Point Presentation........................................................................12
3.4 Formal Report.....................................................................................................................12
TASK 4..........................................................................................................................................13
4.1 Use of software while making any decisions......................................................................13
4.2 Project plan and framing or critical path.............................................................................14
4.3 Financial tools for decision making....................................................................................16
CONCLUSION..............................................................................................................................17
REFERENCES..............................................................................................................................18
INTRODUCTION
Each and every company have to make appropriate decision so that they can attain the
success in the competitive market. A decision refers to the different course of action which
having a different purpose and on the basis of that they have to set the alternatives so that they
can manage all the organisational activities which helps in attaining the goals and objectives.
They have to reap the targets and ion the basis of that they have to make appropriate and relevant
decisions and according to that they have to earn best outcomes. In the growth of the firms,
decisions play a important role (Ford, and Richardson,2013). Along with this, successful firms in
the industry have to make relevant decisions so that they can reap the long term goals. The
present report is based on UK college of business along with the computing. In every college,
documents of the students should be needed so that they can get all the information about
students and get satisfied. In the below mentioned report, the employees have to do proper
evaluation by using primary and secondary data. To reap the good results, data collection process
needs to be done so that they can attain success.
TASK 1
1.1 Planning for collecting data
There are different sources which assist in collecting the data along with the information
so that they can attain the goals and objectives. They have to make the survey and it is helpful to
them in accomplishing the best results.
Primary Data-Primary data is an first hand collected data. The information is collected
through first hand published data. The primary data is considerably collected for specific
research projects. It is basically collected to meet the requirements of the research reports.
Primary data can be collected through questionnaire, interviews, direct observations
(Zimmerman,and Yahya-Zadeh, 2011). Collection of primary data- There are some common
methods of collecting primary source data. The methods are:
Interviews: The interviews are the meeting of people face to face or through telephonic
calls or through video conferencing. The interviews are the structured state of questions asked by
the user to get to know their ability skills knowledge and the experience what they feel.
Questionnaire: Questionnaire are basically the set of questions (Frey,, Schulz-Hardt, and
Stahlberg, 2013). The information is collected through questionnaire by sending a set of
⊘ This is a preview!⊘
Do you want full access?
Subscribe today to unlock all pages.
Trusted by 1+ million students worldwide
particular questions to the concerned person and in against requesting them to fill up and the
questionnaire and re send the mail. This is an cheap way of collecting data but as on the same
many people denied or not to feel to fill the questionnaire.
Observation Method: The observation method consist with the doing the observation to
the particular respondent. In the observation method the information is obtained by the
observation way. The investigator or the data collector observe the particular respondent or the
user and observe them. The direct observation on the working is observed. It is an free way of
collecting data without requiring the willingness of the user . Observation is considered as an
expensive method of collecting data and also considers as a time consuming method also
(Gigerenzer, and Gaissmaier,2011).
Scheduled Method: The scheduled methods are slightly similar to the questionnaire
method the basically difference between the both is the scheduled method are the particular set
of questions scheduled to ask from a particular set of people .questions are asked to only the
special assigned people in schedule method. This helps in removing the barriers and
misunderstanding which user feels for the particular questions.
Secondary Data- Secondary data are the second hand collected data. The information is
not directly collected by the user the information is through someone other than the particular
user. The secondary data is the second hand data that is already collected and available from the
other sources. The information is available in other sources of information (Lunenburg, 2011).
The secondary data is easily available information and it is an cheaper source of information.
The secondary data is an time consuming method. The secondary data is collected through the
magazines, newspaper,libraries,internet. The secondary data is collected in both quantitative and
qualitative terms in collecting data. The quantitative data consists surveys, financial statements,
statistics. The qualitative data consists through newspaper, dairies, transcripts. The secondary
data can be collected through internal and external to the organisation by the researcher.
The internal sources of collecting data are:
Sales Reports; The sales reports are the reports detailing about the products sold within a
particular year (Wu, and Pagell 2011).
Financial Statements : The financial Statements are the formal records collected to record
the financial activates of an businesses activities and for knowing the financial position of
the business.
Paraphrase This Document
Need a fresh take? Get an instant paraphrase of this document with our AI Paraphraser
Demographic profile of the customers:age,name, contact details - The demographic
information consists the personal information of the respondent.
Detailed study of the company information: The detailed studied consists the briefly
consisting information of the company including rules policies and past record data's
(Provost, and Fawcett 2013).
Reports and feedbacks from the respective customers, dealers: The information is
collected through the customers,dealers,distributor and the collected information is used
by the researcher for collection of data.
The external sources of collecting data are:
Libraries - Libraries considers different types of books collected together .
Business journals - A journal is considered as am way of collecting record or events of
the businesses. Business journal contains the information about the business past
activities and records.
Gathering information from the other government departments
Internet, where the world wide knowledge is available from the different sources.
1.2 Survey methodology and sample framing
Survey methodology is a field of applied statistics of the human research survey, survey
methodology which includes the sampling of the individual units from a population along with
the associated survey data by using the different collection techniques which includes the
questionnaire, interviews etc. as well as methods for improving the number as well as accuracy
of the responses to do surveys. Survey help the company is attaining the actual and correct
information and on the basis of that they can take the suggestions as well as opinions from the
consumers. The employees of the college by making the questionnaire and survey can be done
by them (Cronan, and et. al., 2011). Distinctive questions asked by the students and the answers
which are given by them helps in doing data evaluation and present that data or information into
statistical form. This methodology are classified into three types which includes personal
interview, mail survey, telephonic survey etc.
Personal Interview: The employees of the firm have to use this method of survey to
collect the actual information as this method helps in doing the personal interaction between the
investigator as well as respondent. A personal interview is considered as an face to face
interview. It is an face to face interview in which a respondent and interviewer had to face each
other .The interviewer asked questions to the respondent and respondent had to reply for the
particular question asked. The basic aim of doing personal interview is to get the deeper
knowledge of an particular respondent and get to know their personal knowledge ability skills.
The personal information also helps to observe the facial expressions of the respondent ( Isik,
Jones, and Sidorova, 2013).
Mail Survey: Mail survey are the quantitative tools of research. The structured questioned
are sent to the respondent and the in against the respondent has to fill up the questionnaire and
had to send it again to the the specific person. Mail survey basically aims to get to know the
customer satisfaction or the member satisfaction. Mail survey basically considers as an feedback
from the respondent as it helps in getting to know the customer satisfaction level. Mail survey is
also considered an economical way of collecting data.
Telephone Survey: A telephonic survey is considered as an structured way of collecting
data. A telephone survey is an public research of collecting data the data is collected through
random calls to the respondent. Out Of all the collection data method telephonic survey is
considered as most suitable by the respondent as all the user nearly access the telephones.
Telephone Survey also allowed to collect data in a accurate format with the proper time limit.
The structured questionnaires are asked particular respondent through the telephonic calls in
telephone survey (Shouzhen and et. al., 2014).
This methodology of survey which includes the sample framing in which they have to
accomplish the information and data through different number of person. In the sample framing
process, agency of UK college which helps in selecting the group of people which are distinctive
from each other. In this task, quality assurance agency have to use the random sampling method
in which employees of the college have to select the different number of person . Along with this
they have to prepare a questionnaire and asked by the students and filled up by them so that they
can collect the information and by using that data they can collect the best outcome.
1.3 Questionnaire for collecting data
The questionnaire is included in primary research as it helps in collecting the data or
information and it is based on the 200 students by using the random sampling. It helps the
college of UK in attaining the accurate information to know about all the students and on the
basis of that they can provide the proper satisfaction as well as experience.
Name:
⊘ This is a preview!⊘
Do you want full access?
Subscribe today to unlock all pages.
Trusted by 1+ million students worldwide
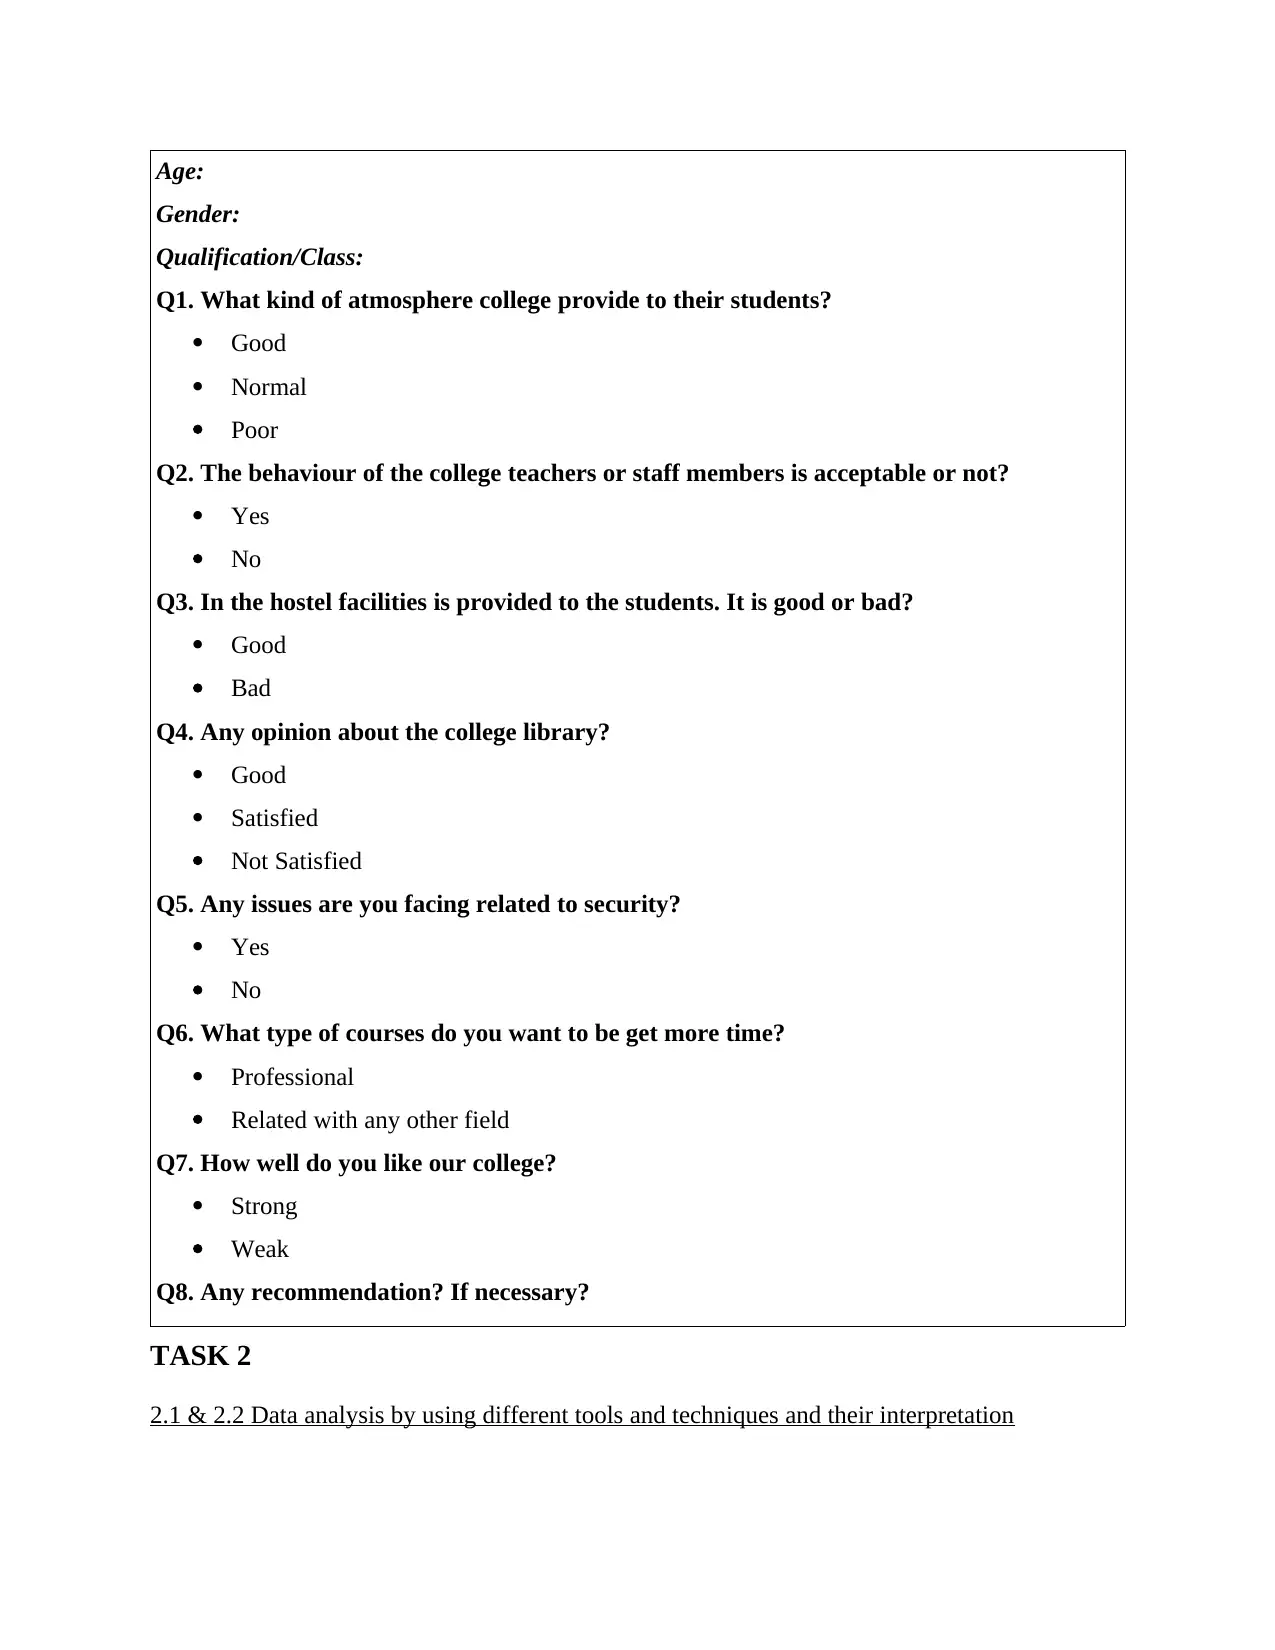
Age:
Gender:
Qualification/Class:
Q1. What kind of atmosphere college provide to their students?
Good
Normal
Poor
Q2. The behaviour of the college teachers or staff members is acceptable or not?
Yes
No
Q3. In the hostel facilities is provided to the students. It is good or bad?
Good
Bad
Q4. Any opinion about the college library?
Good
Satisfied
Not Satisfied
Q5. Any issues are you facing related to security?
Yes
No
Q6. What type of courses do you want to be get more time?
Professional
Related with any other field
Q7. How well do you like our college?
Strong
Weak
Q8. Any recommendation? If necessary?
TASK 2
2.1 & 2.2 Data analysis by using different tools and techniques and their interpretation
Paraphrase This Document
Need a fresh take? Get an instant paraphrase of this document with our AI Paraphraser
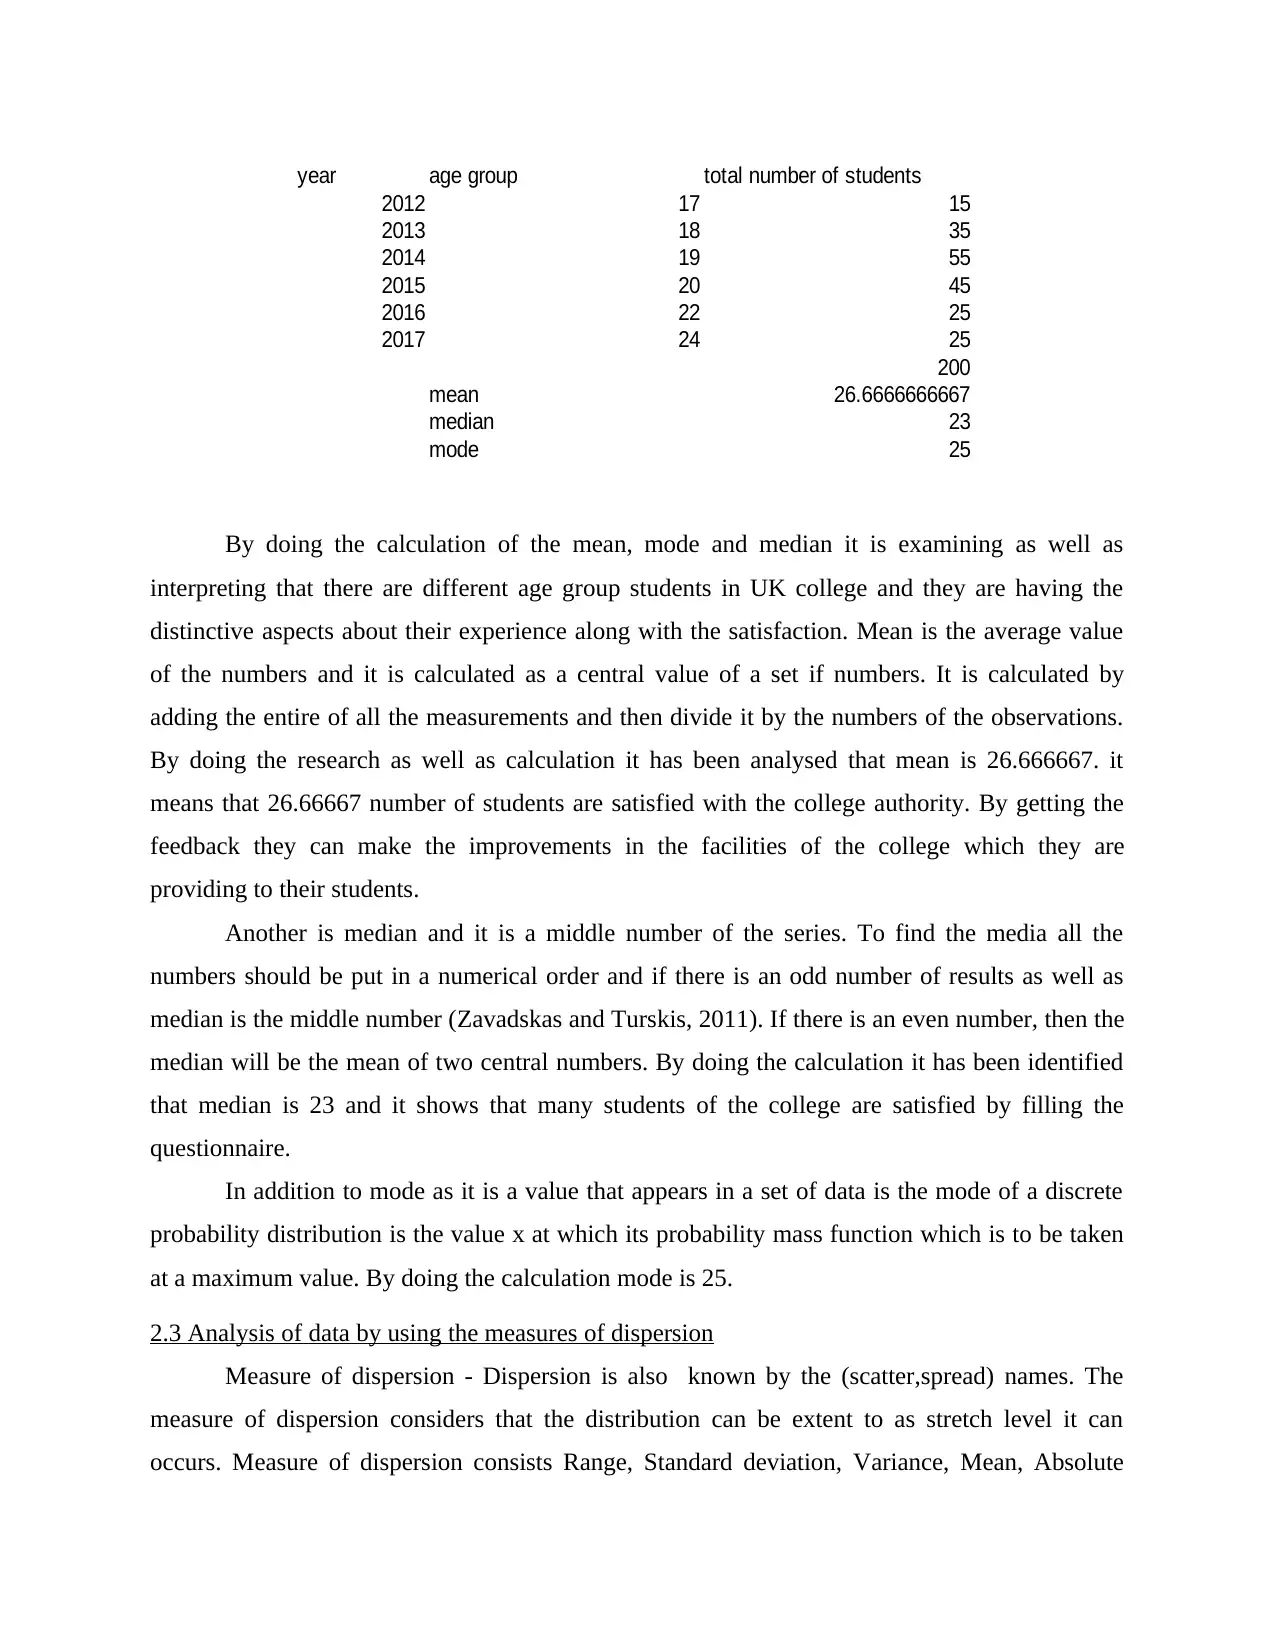
By doing the calculation of the mean, mode and median it is examining as well as
interpreting that there are different age group students in UK college and they are having the
distinctive aspects about their experience along with the satisfaction. Mean is the average value
of the numbers and it is calculated as a central value of a set if numbers. It is calculated by
adding the entire of all the measurements and then divide it by the numbers of the observations.
By doing the research as well as calculation it has been analysed that mean is 26.666667. it
means that 26.66667 number of students are satisfied with the college authority. By getting the
feedback they can make the improvements in the facilities of the college which they are
providing to their students.
Another is median and it is a middle number of the series. To find the media all the
numbers should be put in a numerical order and if there is an odd number of results as well as
median is the middle number (Zavadskas and Turskis, 2011). If there is an even number, then the
median will be the mean of two central numbers. By doing the calculation it has been identified
that median is 23 and it shows that many students of the college are satisfied by filling the
questionnaire.
In addition to mode as it is a value that appears in a set of data is the mode of a discrete
probability distribution is the value x at which its probability mass function which is to be taken
at a maximum value. By doing the calculation mode is 25.
2.3 Analysis of data by using the measures of dispersion
Measure of dispersion - Dispersion is also known by the (scatter,spread) names. The
measure of dispersion considers that the distribution can be extent to as stretch level it can
occurs. Measure of dispersion consists Range, Standard deviation, Variance, Mean, Absolute
year age group total number of students
2012 17 15
2013 18 35
2014 19 55
2015 20 45
2016 22 25
2017 24 25
200
mean 26.6666666667
median 23
mode 25
deviation. It basically aims at stretching of the data to an extent level. It is basically how the data
is spread out. The most common phrases of measure of dispersion are the range and the standard
deviation. A measure for the dispersion is considered as non negative number that is a real
number and the value is considered as a zero highlights that if the data is considers the same and
increase widely. Measures of dispersion is divided into three terms which includes: Standard
Deviation, Interquartile range along with the range. The fraction of the variance which is
explained called the coefficient of determination (Fassin and Buelens, 2011).
2.4 Explanation of quartile, percentile and coefficient correlation
Quartile, percentile and the correlation coefficient is a part of measures of dispersion and
it helps in calculating the statistical data so that they can do more expansion as well as
elaboration so that employees can understand the data in a easy way. The evaluation as well as
analysis needs to be done by using these three terms:
Quartile - A quartile is a method of quantile. Quartile are the mainly the value that is
divided into quarters. Each quartile is assigned a three data values which helps to allocate into
four equal value the considers as a quarter. The first quartile(Q1) is considered as middle
number between the smallest number and medium set. The second quartile (Q2)is the median of
the data. The third Quartile(Q3) is the medium value between the highest value and medium set.
Percentile - Percentile is the number or value indicating the number or percentage
position in a list. It signifies the percentage value of a number from the data (Gabrielsson, and
Gabrielsson, 2013). Percentile is considered as one value of one variable distributing the other
value frequency into the distribution level. It consider distributing the each value into equal level
frequency.
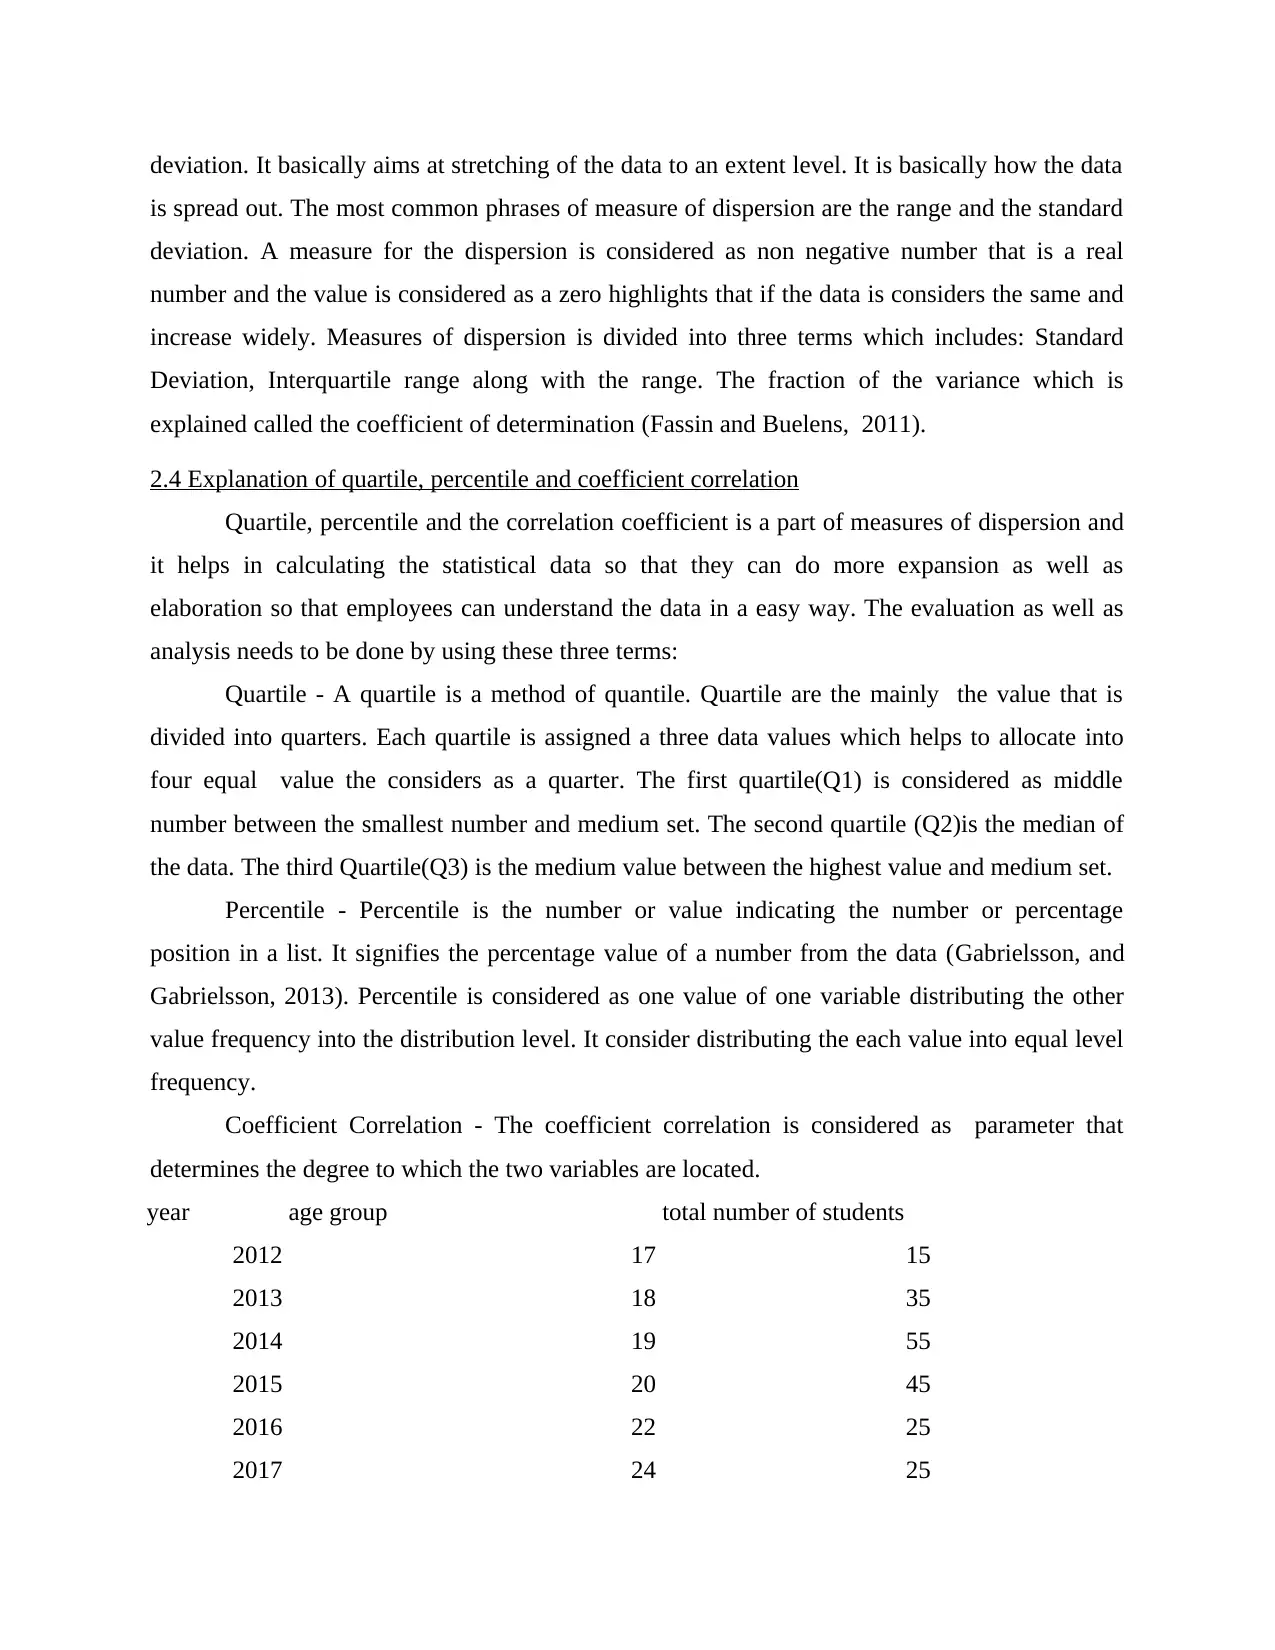
Coefficient Correlation - The coefficient correlation is considered as parameter that
determines the degree to which the two variables are located.
year age group total number of students
2012 17 15
2013 18 35
2014 19 55
2015 20 45
2016 22 25
2017 24 25
is spread out. The most common phrases of measure of dispersion are the range and the standard
deviation. A measure for the dispersion is considered as non negative number that is a real
number and the value is considered as a zero highlights that if the data is considers the same and
increase widely. Measures of dispersion is divided into three terms which includes: Standard
Deviation, Interquartile range along with the range. The fraction of the variance which is
explained called the coefficient of determination (Fassin and Buelens, 2011).
2.4 Explanation of quartile, percentile and coefficient correlation
Quartile, percentile and the correlation coefficient is a part of measures of dispersion and
it helps in calculating the statistical data so that they can do more expansion as well as
elaboration so that employees can understand the data in a easy way. The evaluation as well as
analysis needs to be done by using these three terms:
Quartile - A quartile is a method of quantile. Quartile are the mainly the value that is
divided into quarters. Each quartile is assigned a three data values which helps to allocate into
four equal value the considers as a quarter. The first quartile(Q1) is considered as middle
number between the smallest number and medium set. The second quartile (Q2)is the median of
the data. The third Quartile(Q3) is the medium value between the highest value and medium set.
Percentile - Percentile is the number or value indicating the number or percentage
position in a list. It signifies the percentage value of a number from the data (Gabrielsson, and
Gabrielsson, 2013). Percentile is considered as one value of one variable distributing the other
value frequency into the distribution level. It consider distributing the each value into equal level
frequency.
Coefficient Correlation - The coefficient correlation is considered as parameter that
determines the degree to which the two variables are located.
year age group total number of students
2012 17 15
2013 18 35
2014 19 55
2015 20 45
2016 22 25
2017 24 25
⊘ This is a preview!⊘
Do you want full access?
Subscribe today to unlock all pages.
Trusted by 1+ million students worldwide
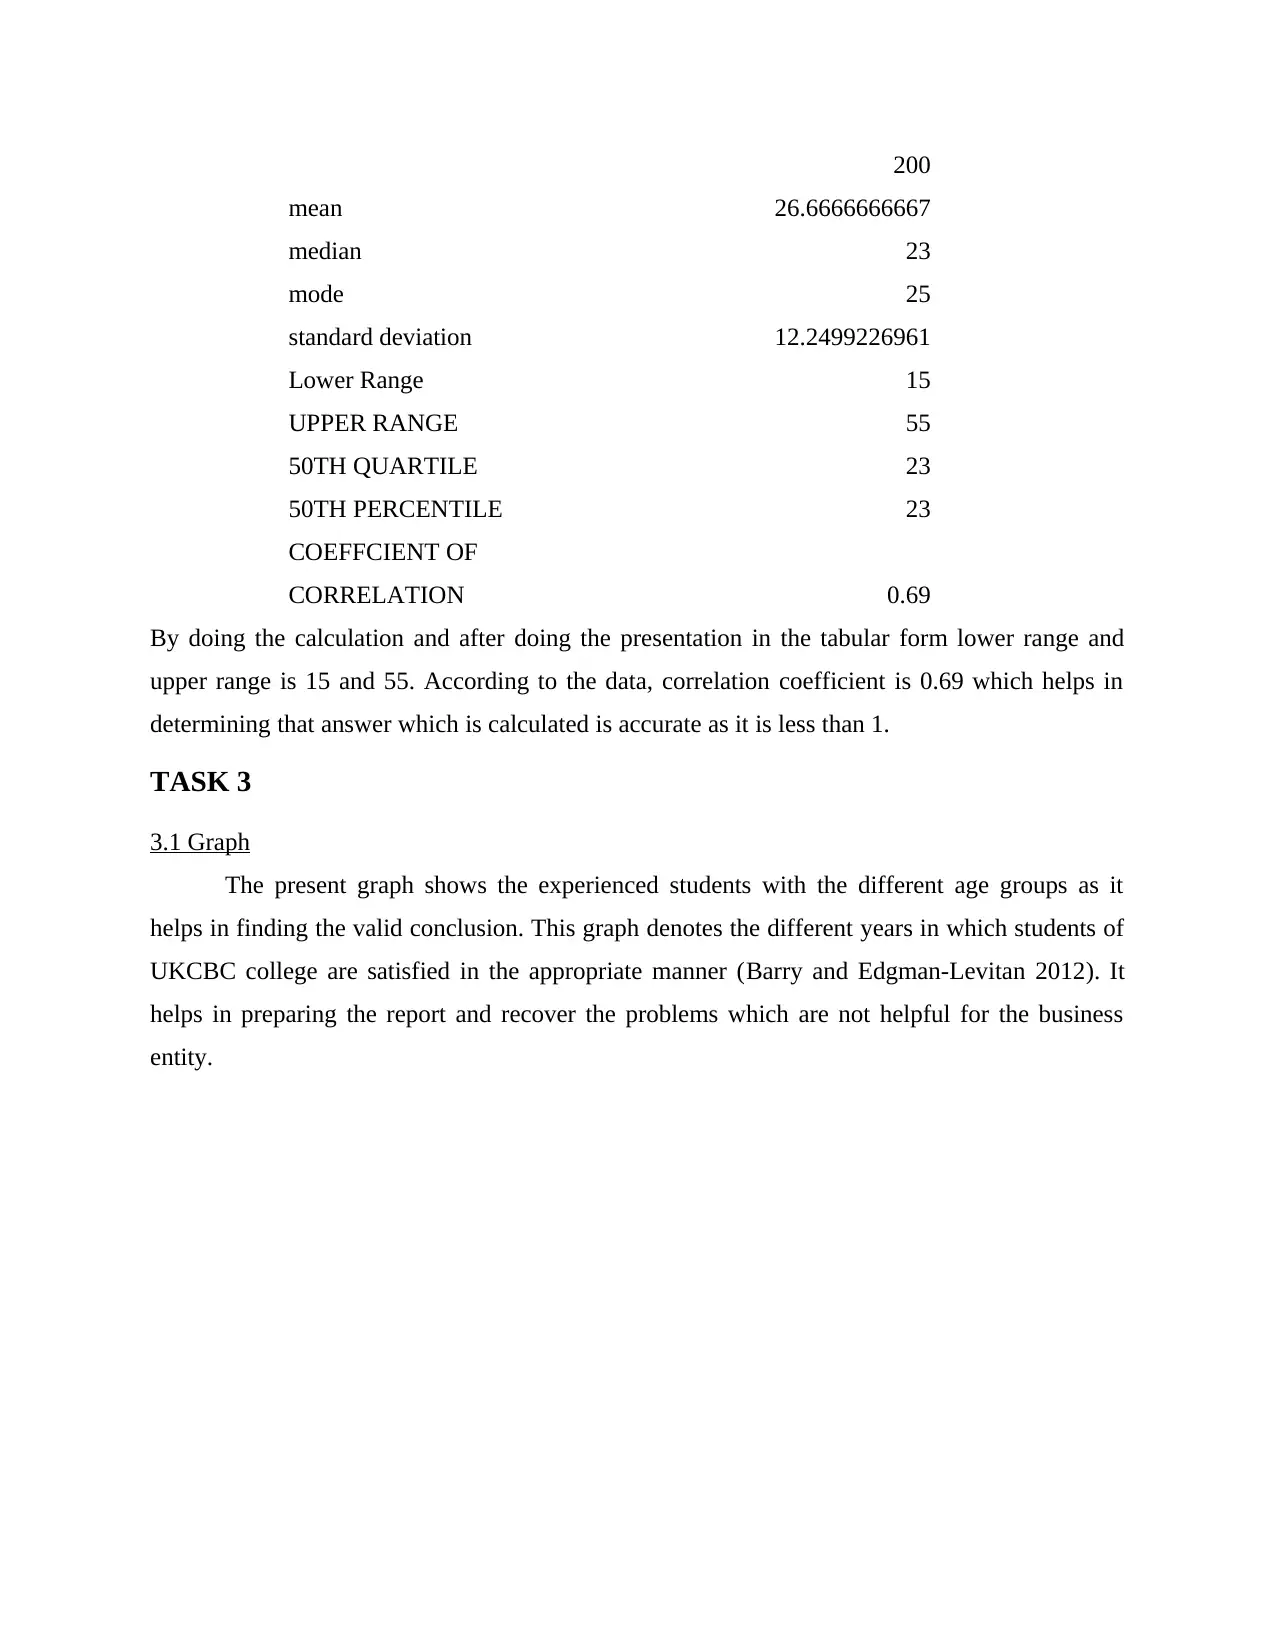
200
mean 26.6666666667
median 23
mode 25
standard deviation 12.2499226961
Lower Range 15
UPPER RANGE 55
50TH QUARTILE 23
50TH PERCENTILE 23
COEFFCIENT OF
CORRELATION 0.69
By doing the calculation and after doing the presentation in the tabular form lower range and
upper range is 15 and 55. According to the data, correlation coefficient is 0.69 which helps in
determining that answer which is calculated is accurate as it is less than 1.
TASK 3
3.1 Graph
The present graph shows the experienced students with the different age groups as it
helps in finding the valid conclusion. This graph denotes the different years in which students of
UKCBC college are satisfied in the appropriate manner (Barry and Edgman-Levitan 2012). It
helps in preparing the report and recover the problems which are not helpful for the business
entity.
Paraphrase This Document
Need a fresh take? Get an instant paraphrase of this document with our AI Paraphraser
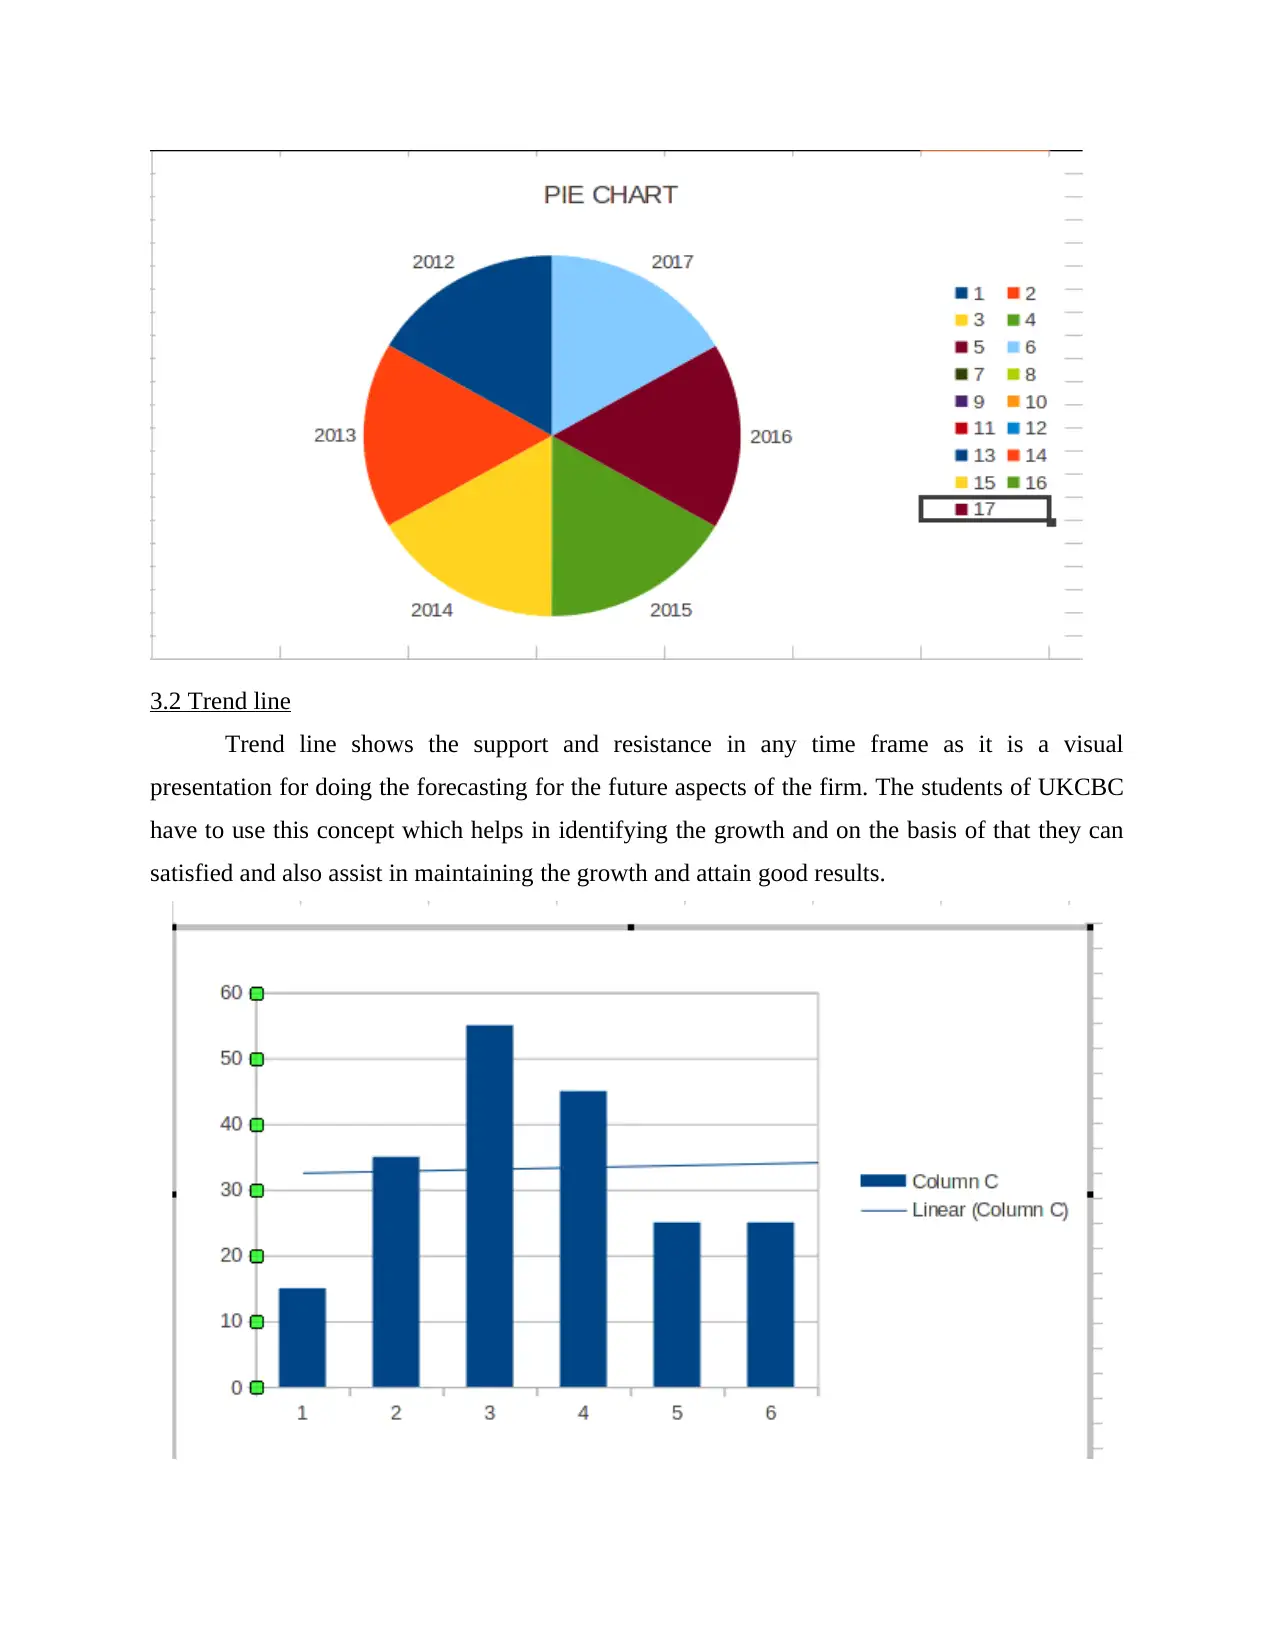
3.2 Trend line
Trend line shows the support and resistance in any time frame as it is a visual
presentation for doing the forecasting for the future aspects of the firm. The students of UKCBC
have to use this concept which helps in identifying the growth and on the basis of that they can
satisfied and also assist in maintaining the growth and attain good results.
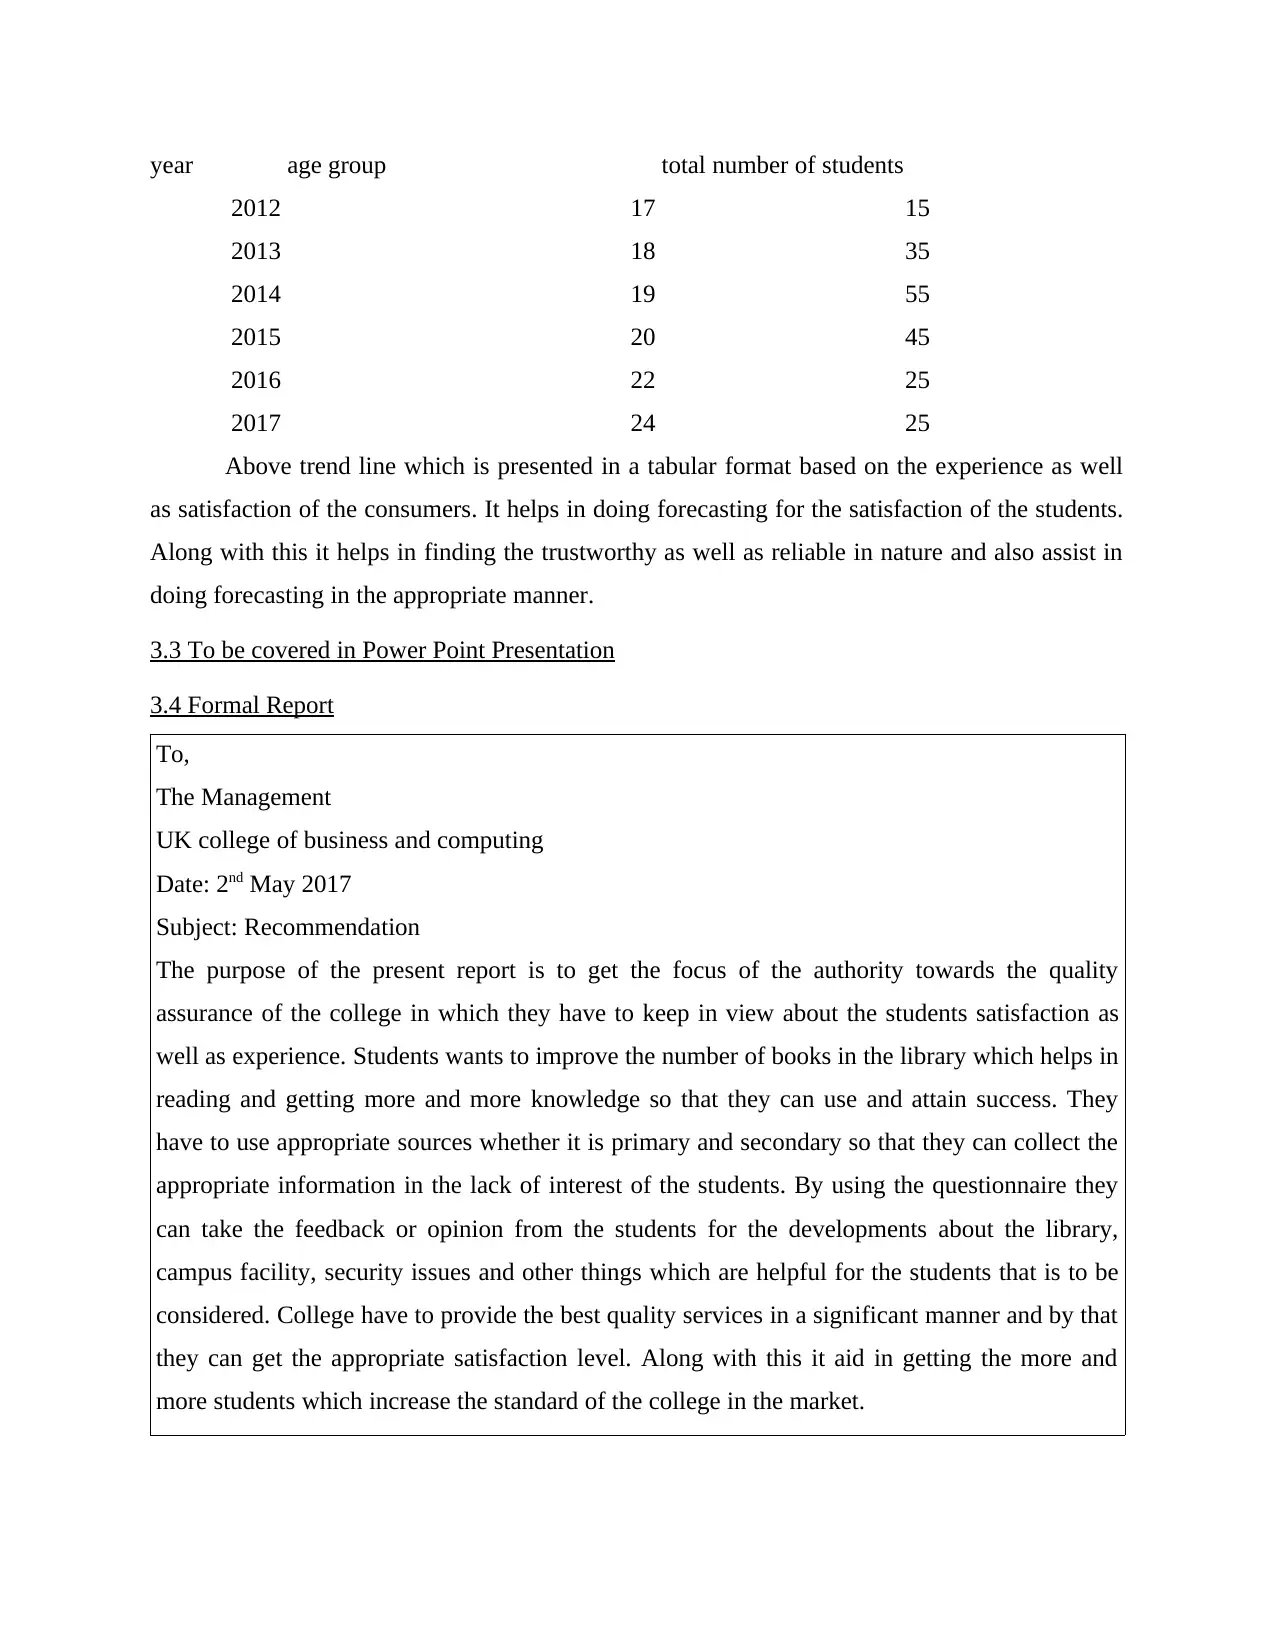
year age group total number of students
2012 17 15
2013 18 35
2014 19 55
2015 20 45
2016 22 25
2017 24 25
Above trend line which is presented in a tabular format based on the experience as well
as satisfaction of the consumers. It helps in doing forecasting for the satisfaction of the students.
Along with this it helps in finding the trustworthy as well as reliable in nature and also assist in
doing forecasting in the appropriate manner.
3.3 To be covered in Power Point Presentation
3.4 Formal Report
To,
The Management
UK college of business and computing
Date: 2nd May 2017
Subject: Recommendation
The purpose of the present report is to get the focus of the authority towards the quality
assurance of the college in which they have to keep in view about the students satisfaction as
well as experience. Students wants to improve the number of books in the library which helps in
reading and getting more and more knowledge so that they can use and attain success. They
have to use appropriate sources whether it is primary and secondary so that they can collect the
appropriate information in the lack of interest of the students. By using the questionnaire they
can take the feedback or opinion from the students for the developments about the library,
campus facility, security issues and other things which are helpful for the students that is to be
considered. College have to provide the best quality services in a significant manner and by that
they can get the appropriate satisfaction level. Along with this it aid in getting the more and
more students which increase the standard of the college in the market.
⊘ This is a preview!⊘
Do you want full access?
Subscribe today to unlock all pages.
Trusted by 1+ million students worldwide
1 out of 18
Related Documents


Your All-in-One AI-Powered Toolkit for Academic Success.
+13062052269
info@desklib.com
Available 24*7 on WhatsApp / Email
![[object Object]](/_next/static/media/star-bottom.7253800d.svg)
Unlock your academic potential
Copyright © 2020–2026 A2Z Services. All Rights Reserved. Developed and managed by ZUCOL.