Business Decision Making: Data Analysis, Survey, and Business Report
VerifiedAdded on 2020/06/05
|20
|5541
|32
Report
AI Summary
This report delves into the critical aspects of business decision-making, focusing on data analysis, survey methodologies, and financial tools within the context of a restaurant business, specifically Balti Palace, planning to open a new outlet in London. The report begins with an introduction highlighting the importance of data in the current business environment and the role of statistical tools. It outlines the planning process for gathering primary and secondary data, including survey methodology, sampling frames, and questionnaire design. The analysis encompasses the summarization of collected data, application of measures of central tendency and dispersion, and the use of quartile, percentile, and correlation coefficients. Furthermore, the report incorporates data visualization techniques such as graphs and trend lines, and discusses the development of business presentations and formal reports. Task 3 explores information processing tools, the critical path method, and the application of financial tools like NPV and IRR in the decision-making process. The conclusion summarizes the key findings and recommendations for the restaurant's strategic decisions.

BUSINESS
DECISION MAKING
DECISION MAKING
Paraphrase This Document
Need a fresh take? Get an instant paraphrase of this document with our AI Paraphraser
TABLE OF CONTENTS
INTRODUCTION...........................................................................................................................1
TASK 1 ...........................................................................................................................................1
1.1 Planning for gathering of primary and secondary data.........................................................1
1.2 Survey methodology and sampling frame ............................................................................2
1.3 Questionnaire and justification of its designing....................................................................3
2.1 Summarisation of collected data ..........................................................................................5
2.2 Use of measurement of central tendency for analysing data.................................................7
2.3 Application of measures of dispersion .................................................................................8
2.4 Use of quartile, percentile and correlation coefficient in making correct decision ..............8
TASK 2............................................................................................................................................9
3.1 Graph and chart.....................................................................................................................9
3.2 Trend line............................................................................................................................11
3.3 Business presentation..........................................................................................................11
3.4 Formal business report........................................................................................................12
TASK 3..........................................................................................................................................13
4.1 Usage of information processing tool ................................................................................13
4.2 Critical path ........................................................................................................................14
4.3 Using financial tools in the process of decision making.....................................................15
CONCLUSION..............................................................................................................................15
REFERENCES..............................................................................................................................17
INTRODUCTION
The importance of information and data is increasing in this swiftly changing business
environment. Companies are using various types of statistical tools for formation of a plan. This
provide them some additional benefits which other firms of an industry may not see. Correct
decision is the key for reaching at long term goals. Some enterprises do not process and analyse
the information which results in inappropriate utilisation of the available resources. Doing
investment without taking an estimation about incurring cost and expected profit may hamper the
growth of an enterprise (Vercellis, 2011). Finding needs of customers can assist a company in
forwarding towards their vision. Balti palace is an organisation that is running their business in
restaurant industry. They want to open an outlet in London. This assignment will discuss about
gathering of primary and secondary information. Different methods of survey and sampling
frame which are used in the research will also become part of this project. A questionnaire will
be designed for finding the views of customers. Measures of central tendencies and dispersion
will be included in this file. Trend line and graphs will be used for better representation of data.
Important values like NPV and IRR will also be determined in the project.
TASK 1
1.1 Planning for gathering of primary and secondary data
Formation of a sound plan is dependent on the information which a company have in
their organisation. One can easily find lots of data on internet and magazines but there is a big
question mark on their reliability. Planning help an enterprise in minimising the risks, it also
provide great assistance in best utilisation of the resources. Following the program for collection
of information:
Plan selection method – A researcher need to make a decision regarding gathering of
content. Mainly, there are two forms of data, one is primary and second is secondary. Earlier one
is known as the information which is collected for the first time. Later is related to the already
existing matter, it can be taken from newspapers, internet etc. The person who is conducting
research must select one option between the two according to the need of situation (Laudon and
Laudon, 2015). There are many researchers who like to go with primary data because it is more
reliable and they can get the exact information which they are exploring. Some people choose
1
⊘ This is a preview!⊘
Do you want full access?
Subscribe today to unlock all pages.
Trusted by 1+ million students worldwide
secondary content as it is easily available and more matter can be collected in short period of
time.
Quantitative and qualitative are other two types of data, prior one deals with numbers and
record option of a participants by giving them choices in figures. Other focuses on observation, it
cannot be measured in numerics. Both kind of research have their own importance but qualitative
is getting more popularity in present era.
Planning of needed resources – Gathering of content is a complicated and expensive
process. The cost of resources which will be required in research depend on the broadness of the
program. An organisation has to select right people so they can gather correct and reliable
information (Maxwell, Jeffrey and Lévesque, 2011). They should find the appropriate
individuals who can become the part of the research. Some companies like to use the old data
which they have collected in previous years. There are many firm who like to gather content
from the various government authority’s websites because they find authentic information on
these sites. There was a time when enterprises were not interested in promoting their research
(What is primary data and secondary data in Statistics and research methods?, 2017). This work
was done in a silently, but now they advertise their program so more people can become its part
and they researcher get better result. Significant amount of resources is needed for planning of
marketing.
Planning for correction time of recording data – If an information is collected in
wrong period of time then it will not deliver appropriate outcome (Nowduri, 2011). For example,
sometime shareholder invest amount in a company by checking their mid-term financial figures,
it may show profit but at the end of the year they may end up in huge loss. Research must try to
determine the correct period in order to get effective result.
1.2 Survey methodology and sampling frame
The person who perform the research, has to deal with various kind of challenges, survey
methodology is related to work like construction of questionnaire, improving accuracy of the
outcomes which researcher get from participants etc. Primary and secondary, both kind of data
has their own importance then shortcomings, Balti Palace can go with earlier one because they of
its reliability factor. Adopting both options is not a bad choice but it may cost them huge amount.
In their survey, they can take views rewarding new dishes or location of restaurant in London
etc.
2
Paraphrase This Document
Need a fresh take? Get an instant paraphrase of this document with our AI Paraphraser
A researcher cannot take interview of complete population, they cannot every single
person, who visit restaurant to fill a questionnaire. They have to select correct size and people for
conducting a survey. Management of mentioned restaurant should check their financial resources
before selecting the right approach. Random sampling is one of the most popular method for
choosing a sample (Provost and Fawcett, 2013). Instead of following a pattern, participant are
selected randomly i.e. without making any logic. This is an easy approach and it does not cost
much amount. Stratified is the better version of prior method. In this technique, whole population
is divided into some subgroups and then a group is randomly selected from available option.
Cost involve in this approach is not too high and but it take more time than random sampling.
Most of the companies look for only two factors at the time of choosing a sample, first is
expenses and other is simplicity. They must also think about crucial points like biasness because
it can make huge negative impact on the complete research.
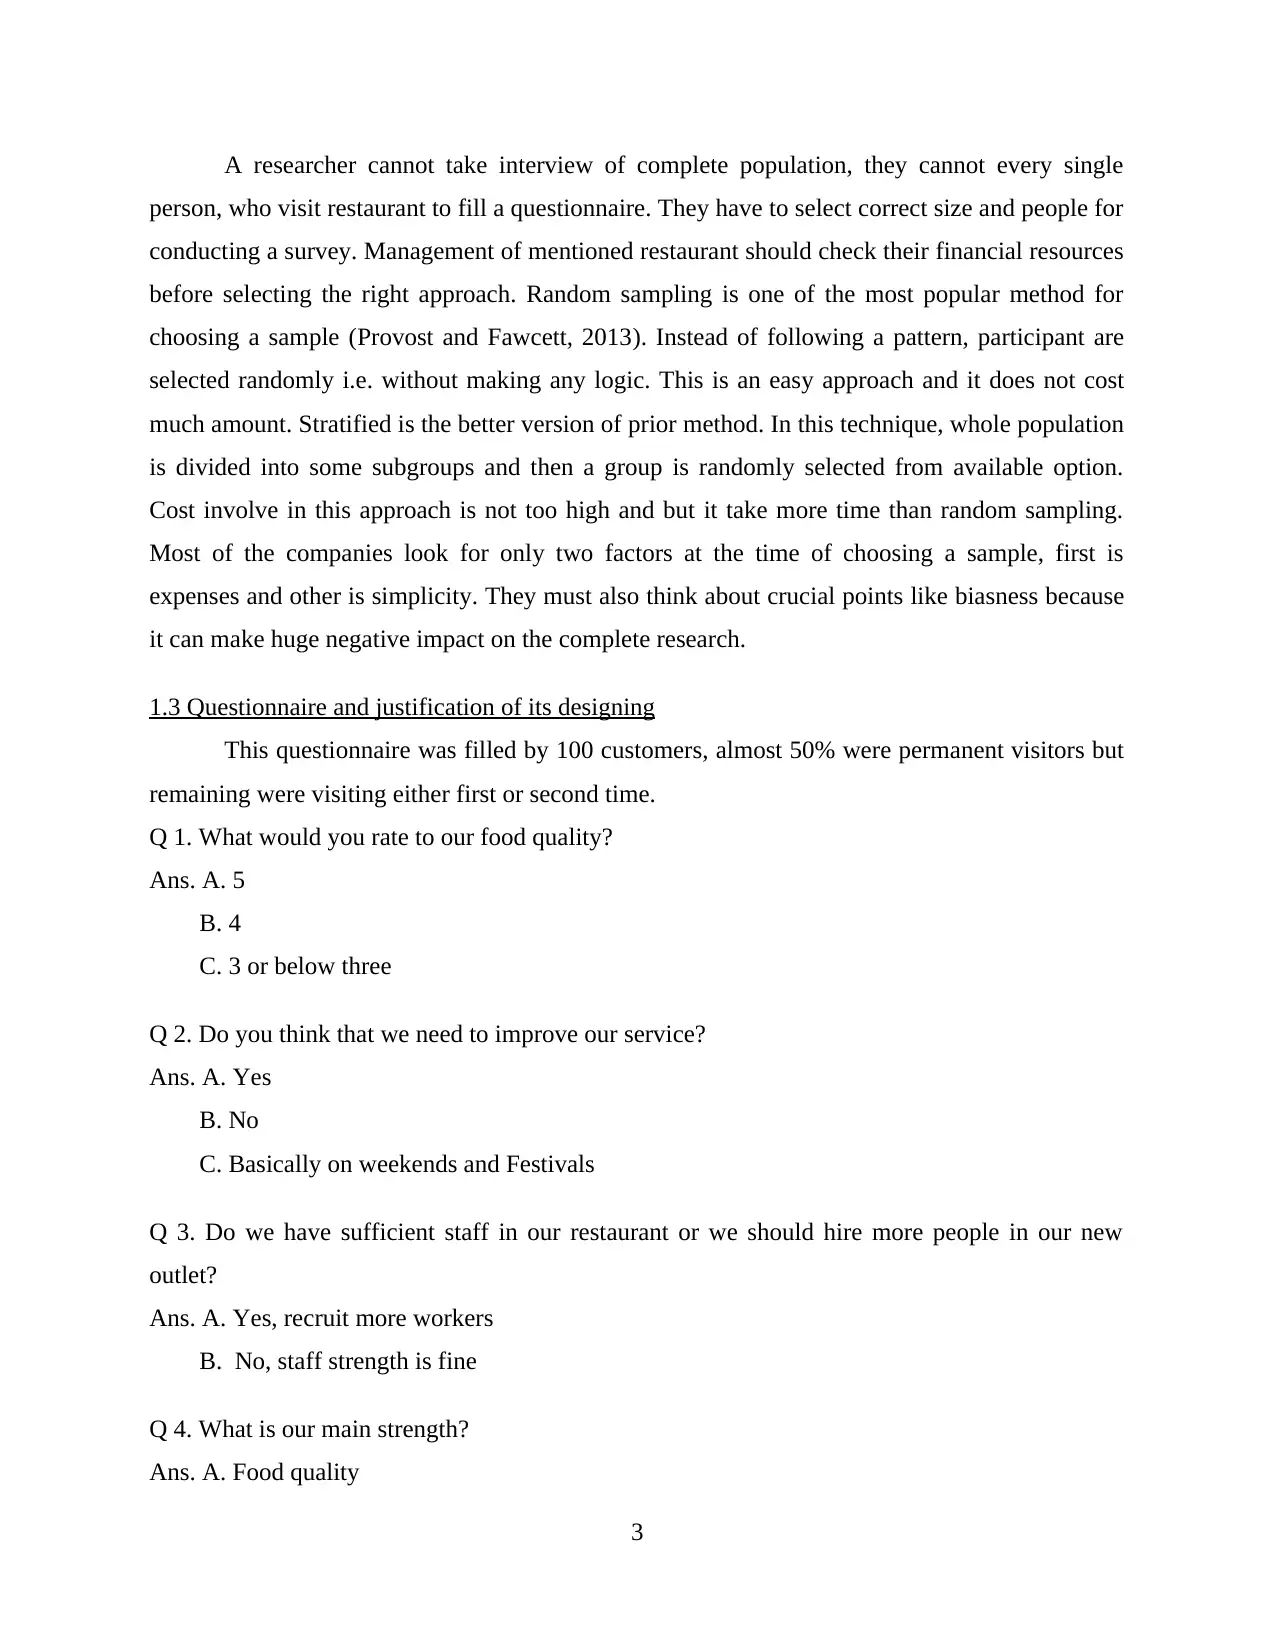
1.3 Questionnaire and justification of its designing
This questionnaire was filled by 100 customers, almost 50% were permanent visitors but
remaining were visiting either first or second time.
Q 1. What would you rate to our food quality?
Ans. A. 5
B. 4
C. 3 or below three
Q 2. Do you think that we need to improve our service?
Ans. A. Yes
B. No
C. Basically on weekends and Festivals
Q 3. Do we have sufficient staff in our restaurant or we should hire more people in our new
outlet?
Ans. A. Yes, recruit more workers
B. No, staff strength is fine
Q 4. What is our main strength?
Ans. A. Food quality
3
person, who visit restaurant to fill a questionnaire. They have to select correct size and people for
conducting a survey. Management of mentioned restaurant should check their financial resources
before selecting the right approach. Random sampling is one of the most popular method for
choosing a sample (Provost and Fawcett, 2013). Instead of following a pattern, participant are
selected randomly i.e. without making any logic. This is an easy approach and it does not cost
much amount. Stratified is the better version of prior method. In this technique, whole population
is divided into some subgroups and then a group is randomly selected from available option.
Cost involve in this approach is not too high and but it take more time than random sampling.
Most of the companies look for only two factors at the time of choosing a sample, first is
expenses and other is simplicity. They must also think about crucial points like biasness because
it can make huge negative impact on the complete research.
1.3 Questionnaire and justification of its designing
This questionnaire was filled by 100 customers, almost 50% were permanent visitors but
remaining were visiting either first or second time.
Q 1. What would you rate to our food quality?
Ans. A. 5
B. 4
C. 3 or below three
Q 2. Do you think that we need to improve our service?
Ans. A. Yes
B. No
C. Basically on weekends and Festivals
Q 3. Do we have sufficient staff in our restaurant or we should hire more people in our new
outlet?
Ans. A. Yes, recruit more workers
B. No, staff strength is fine
Q 4. What is our main strength?
Ans. A. Food quality
3

B. Service
C. Location of restaurant
Q 5. Which countries food should be introduce in our new outlet?
Ans. A. Indian
B. Mexican
C. Lebanese
D. Spanish
Q 6. Where would you like to see our new restaurant?
Ans. A. In the centre of the city
B. Outer areas of London
C. Any of the above
Q 7. Which type of food should we not serve in new outlet?
Ans. A. Italian
B. Japanese
C. Brazilian
D. Pakistani
Q 7. Should we change our existing crockeries?
Ans. A. Yes
B. No
C. Some of them
Q 8. Do you like our specials which we serve on weekends?
Ans. A. No
B. Yes
C. Some of them
Q 9. In which area restaurant need to do improvement?
Ans. A. Quality of eatables
B. Service
C. Crockeries
4
⊘ This is a preview!⊘
Do you want full access?
Subscribe today to unlock all pages.
Trusted by 1+ million students worldwide
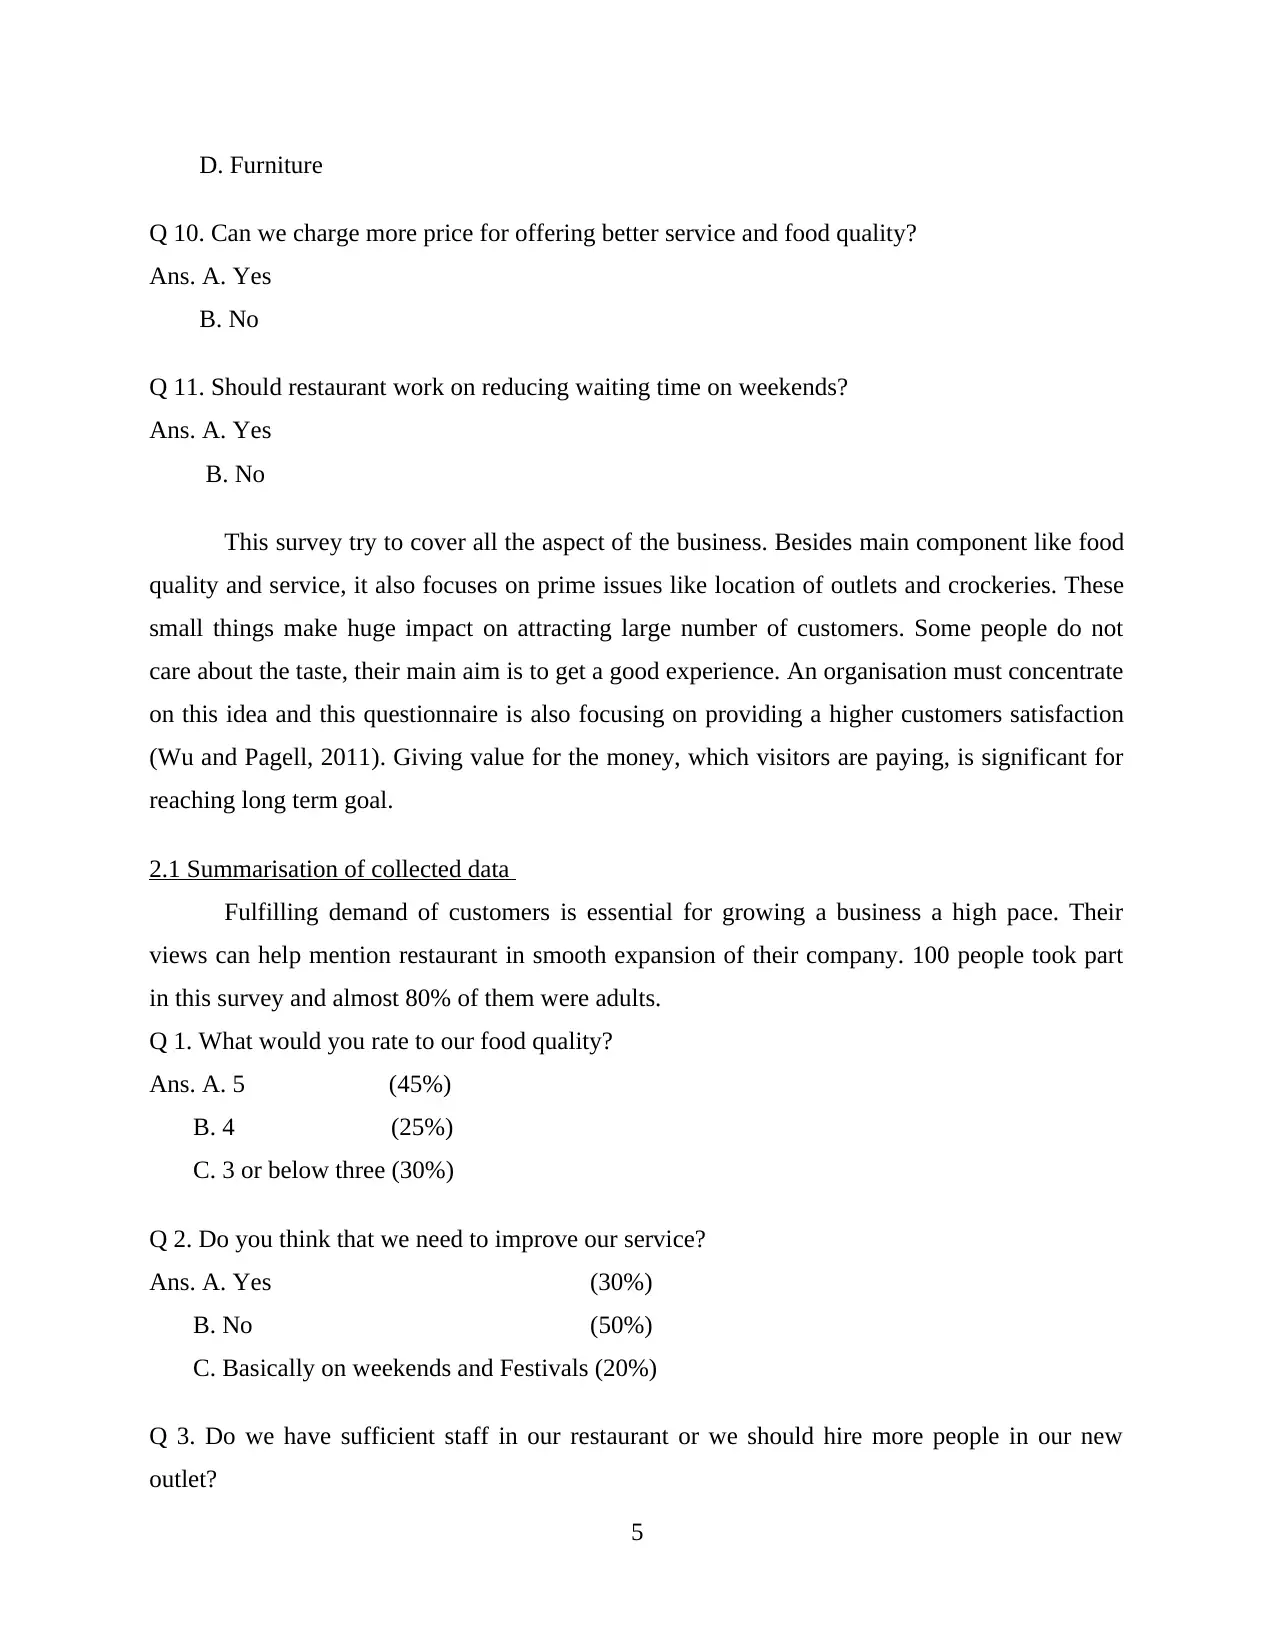
D. Furniture
Q 10. Can we charge more price for offering better service and food quality?
Ans. A. Yes
B. No
Q 11. Should restaurant work on reducing waiting time on weekends?
Ans. A. Yes
B. No
This survey try to cover all the aspect of the business. Besides main component like food
quality and service, it also focuses on prime issues like location of outlets and crockeries. These
small things make huge impact on attracting large number of customers. Some people do not
care about the taste, their main aim is to get a good experience. An organisation must concentrate
on this idea and this questionnaire is also focusing on providing a higher customers satisfaction
(Wu and Pagell, 2011). Giving value for the money, which visitors are paying, is significant for
reaching long term goal.
2.1 Summarisation of collected data
Fulfilling demand of customers is essential for growing a business a high pace. Their
views can help mention restaurant in smooth expansion of their company. 100 people took part
in this survey and almost 80% of them were adults.
Q 1. What would you rate to our food quality?
Ans. A. 5 (45%)
B. 4 (25%)
C. 3 or below three (30%)
Q 2. Do you think that we need to improve our service?
Ans. A. Yes (30%)
B. No (50%)
C. Basically on weekends and Festivals (20%)
Q 3. Do we have sufficient staff in our restaurant or we should hire more people in our new
outlet?
5
Paraphrase This Document
Need a fresh take? Get an instant paraphrase of this document with our AI Paraphraser
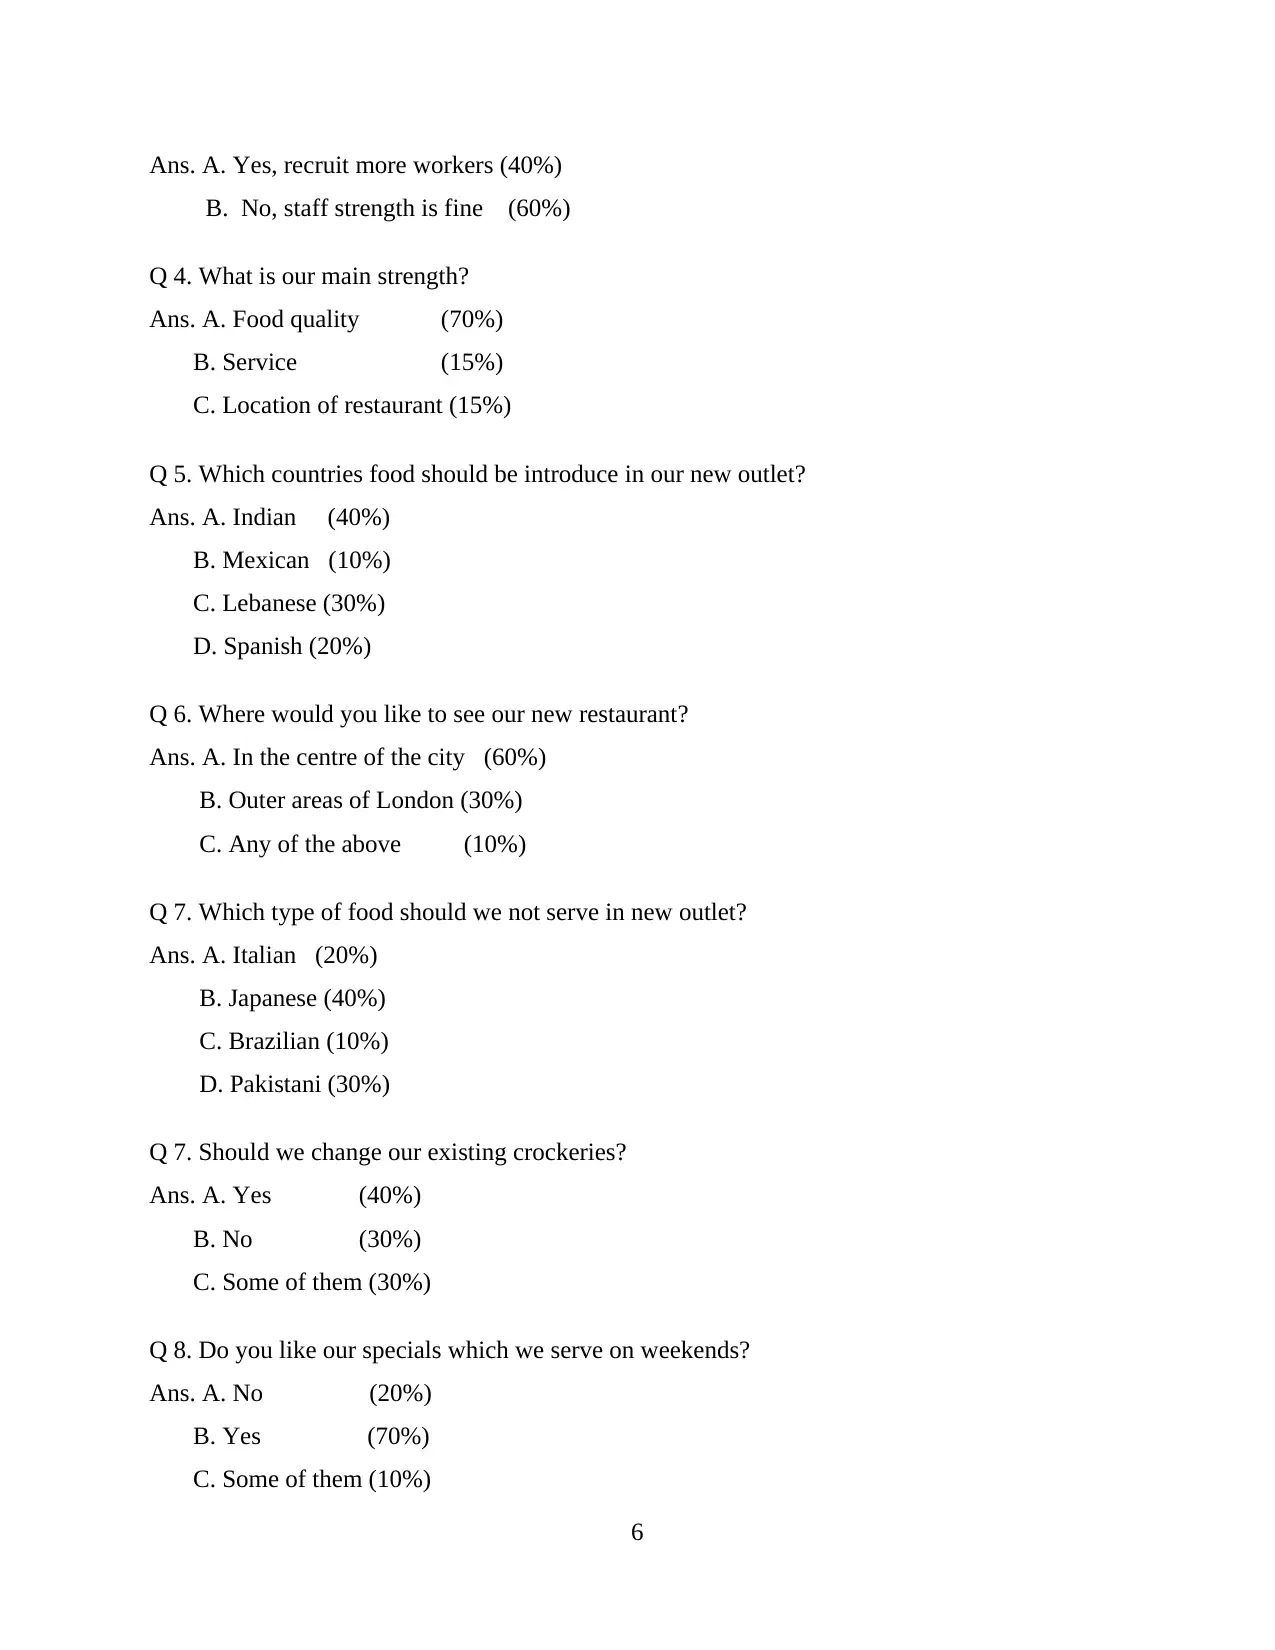
Ans. A. Yes, recruit more workers (40%)
B. No, staff strength is fine (60%)
Q 4. What is our main strength?
Ans. A. Food quality (70%)
B. Service (15%)
C. Location of restaurant (15%)
Q 5. Which countries food should be introduce in our new outlet?
Ans. A. Indian (40%)
B. Mexican (10%)
C. Lebanese (30%)
D. Spanish (20%)
Q 6. Where would you like to see our new restaurant?
Ans. A. In the centre of the city (60%)
B. Outer areas of London (30%)
C. Any of the above (10%)
Q 7. Which type of food should we not serve in new outlet?
Ans. A. Italian (20%)
B. Japanese (40%)
C. Brazilian (10%)
D. Pakistani (30%)
Q 7. Should we change our existing crockeries?
Ans. A. Yes (40%)
B. No (30%)
C. Some of them (30%)
Q 8. Do you like our specials which we serve on weekends?
Ans. A. No (20%)
B. Yes (70%)
C. Some of them (10%)
6
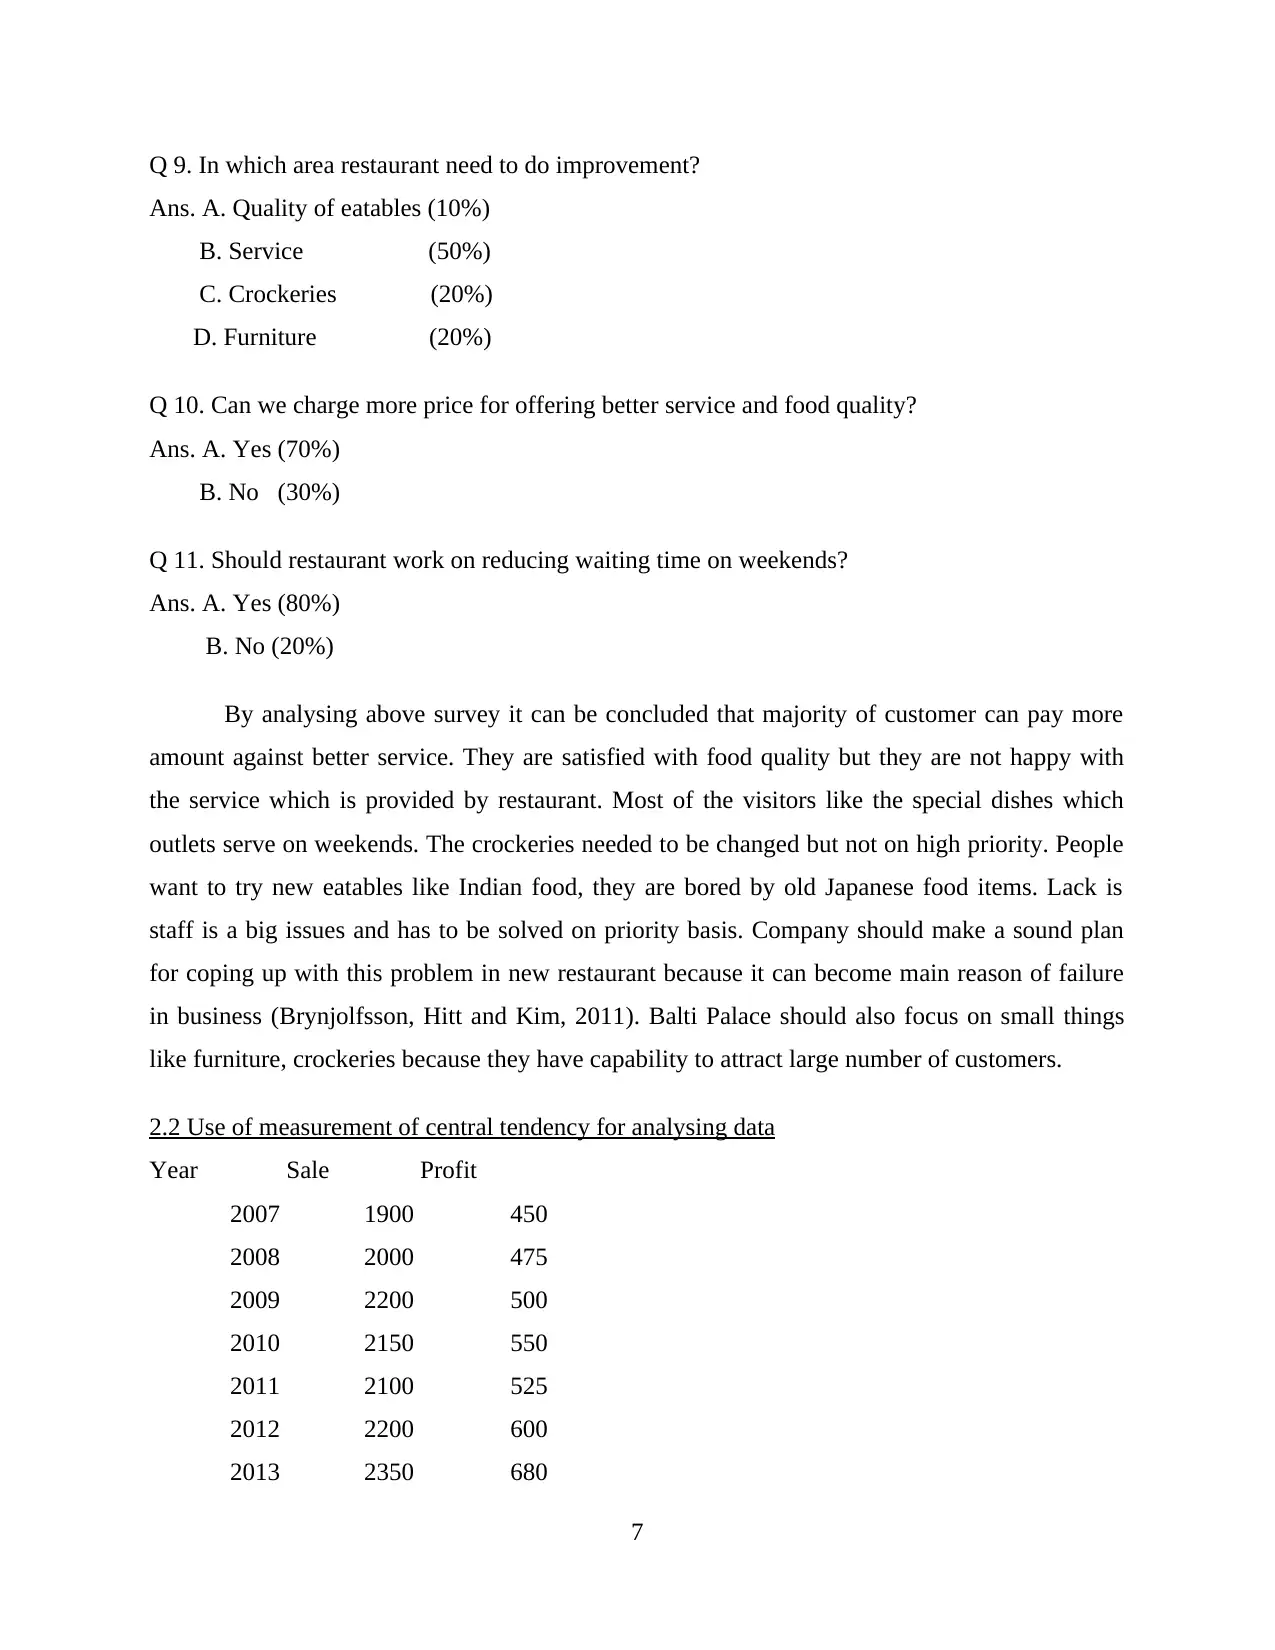
Q 9. In which area restaurant need to do improvement?
Ans. A. Quality of eatables (10%)
B. Service (50%)
C. Crockeries (20%)
D. Furniture (20%)
Q 10. Can we charge more price for offering better service and food quality?
Ans. A. Yes (70%)
B. No (30%)
Q 11. Should restaurant work on reducing waiting time on weekends?
Ans. A. Yes (80%)
B. No (20%)
By analysing above survey it can be concluded that majority of customer can pay more
amount against better service. They are satisfied with food quality but they are not happy with
the service which is provided by restaurant. Most of the visitors like the special dishes which
outlets serve on weekends. The crockeries needed to be changed but not on high priority. People
want to try new eatables like Indian food, they are bored by old Japanese food items. Lack is
staff is a big issues and has to be solved on priority basis. Company should make a sound plan
for coping up with this problem in new restaurant because it can become main reason of failure
in business (Brynjolfsson, Hitt and Kim, 2011). Balti Palace should also focus on small things
like furniture, crockeries because they have capability to attract large number of customers.
2.2 Use of measurement of central tendency for analysing data
Year Sale Profit
2007 1900 450
2008 2000 475
2009 2200 500
2010 2150 550
2011 2100 525
2012 2200 600
2013 2350 680
7
⊘ This is a preview!⊘
Do you want full access?
Subscribe today to unlock all pages.
Trusted by 1+ million students worldwide
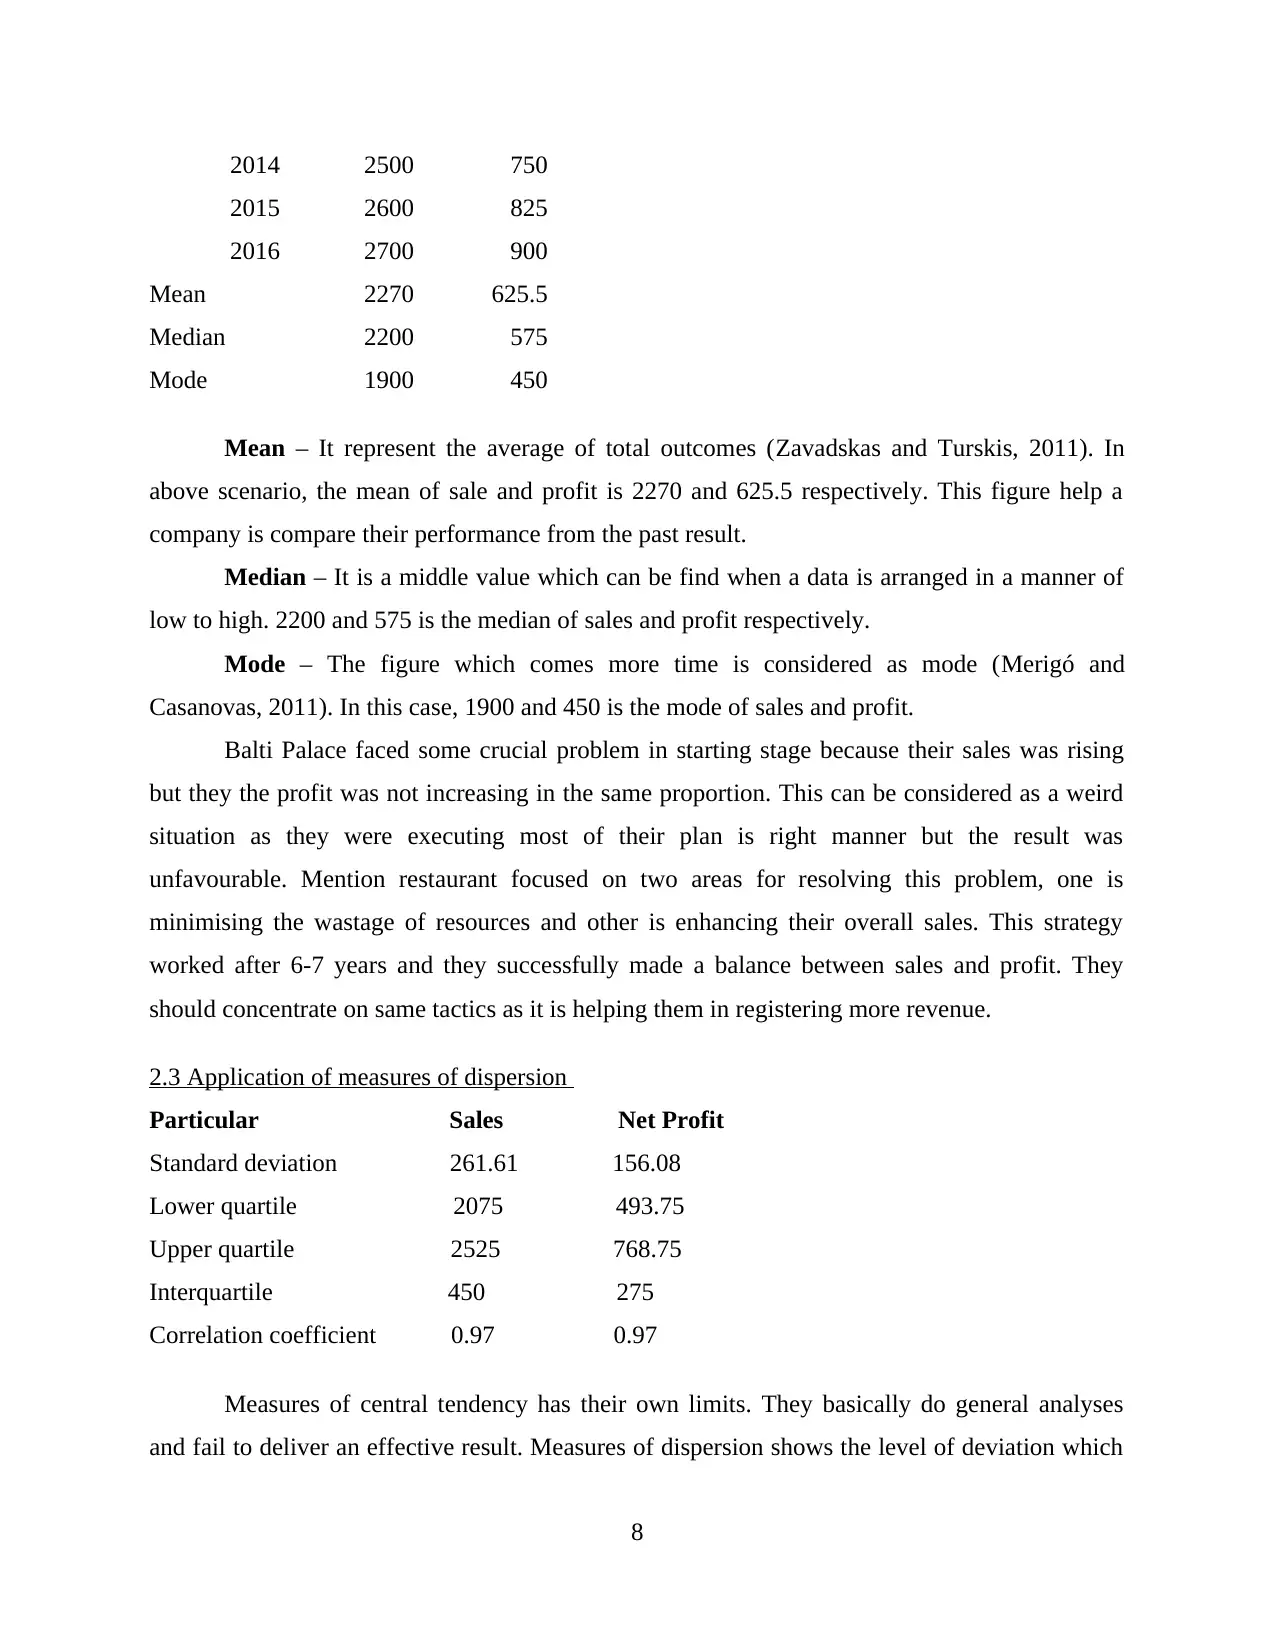
2014 2500 750
2015 2600 825
2016 2700 900
Mean 2270 625.5
Median 2200 575
Mode 1900 450
Mean – It represent the average of total outcomes (Zavadskas and Turskis, 2011). In
above scenario, the mean of sale and profit is 2270 and 625.5 respectively. This figure help a
company is compare their performance from the past result.
Median – It is a middle value which can be find when a data is arranged in a manner of
low to high. 2200 and 575 is the median of sales and profit respectively.
Mode – The figure which comes more time is considered as mode (Merigó and
Casanovas, 2011). In this case, 1900 and 450 is the mode of sales and profit.
Balti Palace faced some crucial problem in starting stage because their sales was rising
but they the profit was not increasing in the same proportion. This can be considered as a weird
situation as they were executing most of their plan is right manner but the result was
unfavourable. Mention restaurant focused on two areas for resolving this problem, one is
minimising the wastage of resources and other is enhancing their overall sales. This strategy
worked after 6-7 years and they successfully made a balance between sales and profit. They
should concentrate on same tactics as it is helping them in registering more revenue.
2.3 Application of measures of dispersion
Particular Sales Net Profit
Standard deviation 261.61 156.08
Lower quartile 2075 493.75
Upper quartile 2525 768.75
Interquartile 450 275
Correlation coefficient 0.97 0.97
Measures of central tendency has their own limits. They basically do general analyses
and fail to deliver an effective result. Measures of dispersion shows the level of deviation which
8
Paraphrase This Document
Need a fresh take? Get an instant paraphrase of this document with our AI Paraphraser
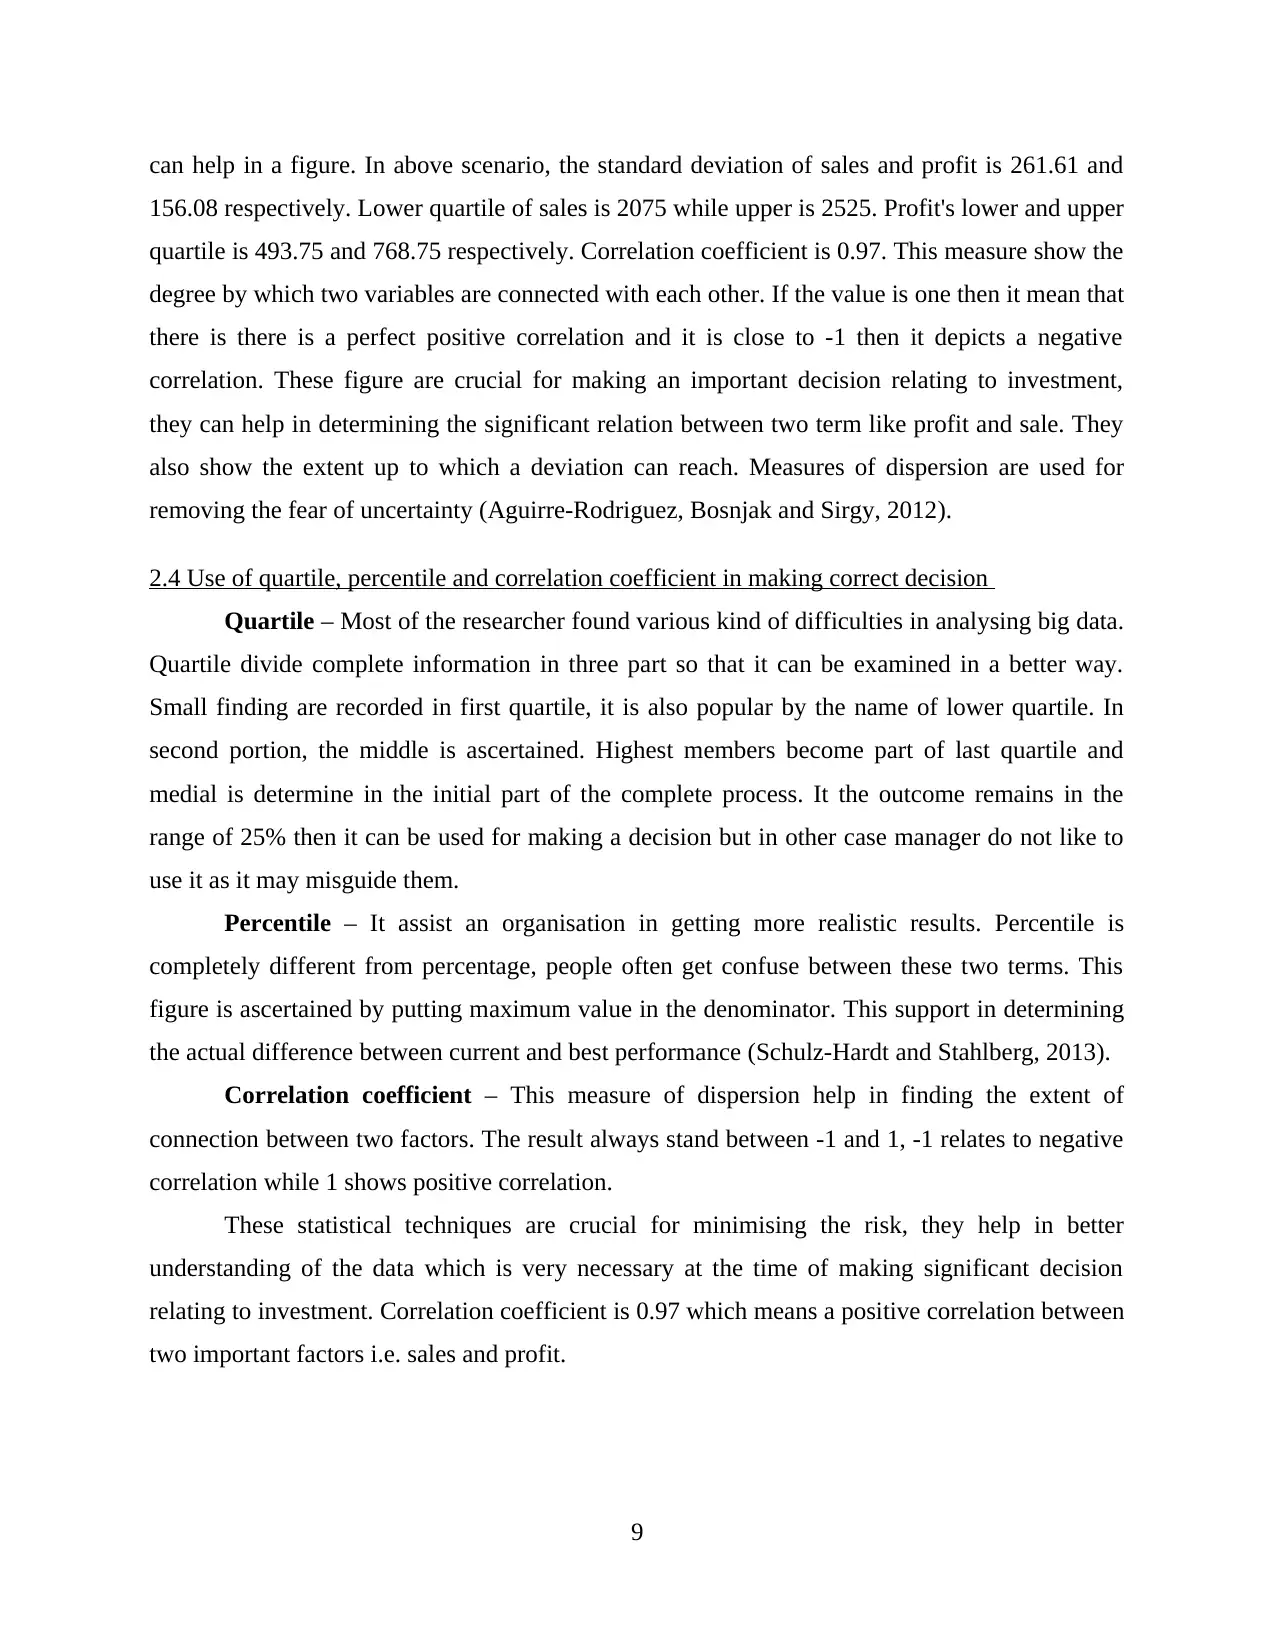
can help in a figure. In above scenario, the standard deviation of sales and profit is 261.61 and
156.08 respectively. Lower quartile of sales is 2075 while upper is 2525. Profit's lower and upper
quartile is 493.75 and 768.75 respectively. Correlation coefficient is 0.97. This measure show the
degree by which two variables are connected with each other. If the value is one then it mean that
there is there is a perfect positive correlation and it is close to -1 then it depicts a negative
correlation. These figure are crucial for making an important decision relating to investment,
they can help in determining the significant relation between two term like profit and sale. They
also show the extent up to which a deviation can reach. Measures of dispersion are used for
removing the fear of uncertainty (Aguirre-Rodriguez, Bosnjak and Sirgy, 2012).
2.4 Use of quartile, percentile and correlation coefficient in making correct decision
Quartile – Most of the researcher found various kind of difficulties in analysing big data.
Quartile divide complete information in three part so that it can be examined in a better way.
Small finding are recorded in first quartile, it is also popular by the name of lower quartile. In
second portion, the middle is ascertained. Highest members become part of last quartile and
medial is determine in the initial part of the complete process. It the outcome remains in the
range of 25% then it can be used for making a decision but in other case manager do not like to
use it as it may misguide them.
Percentile – It assist an organisation in getting more realistic results. Percentile is
completely different from percentage, people often get confuse between these two terms. This
figure is ascertained by putting maximum value in the denominator. This support in determining
the actual difference between current and best performance (Schulz-Hardt and Stahlberg, 2013).
Correlation coefficient – This measure of dispersion help in finding the extent of
connection between two factors. The result always stand between -1 and 1, -1 relates to negative
correlation while 1 shows positive correlation.
These statistical techniques are crucial for minimising the risk, they help in better
understanding of the data which is very necessary at the time of making significant decision
relating to investment. Correlation coefficient is 0.97 which means a positive correlation between
two important factors i.e. sales and profit.
9
TASK 2
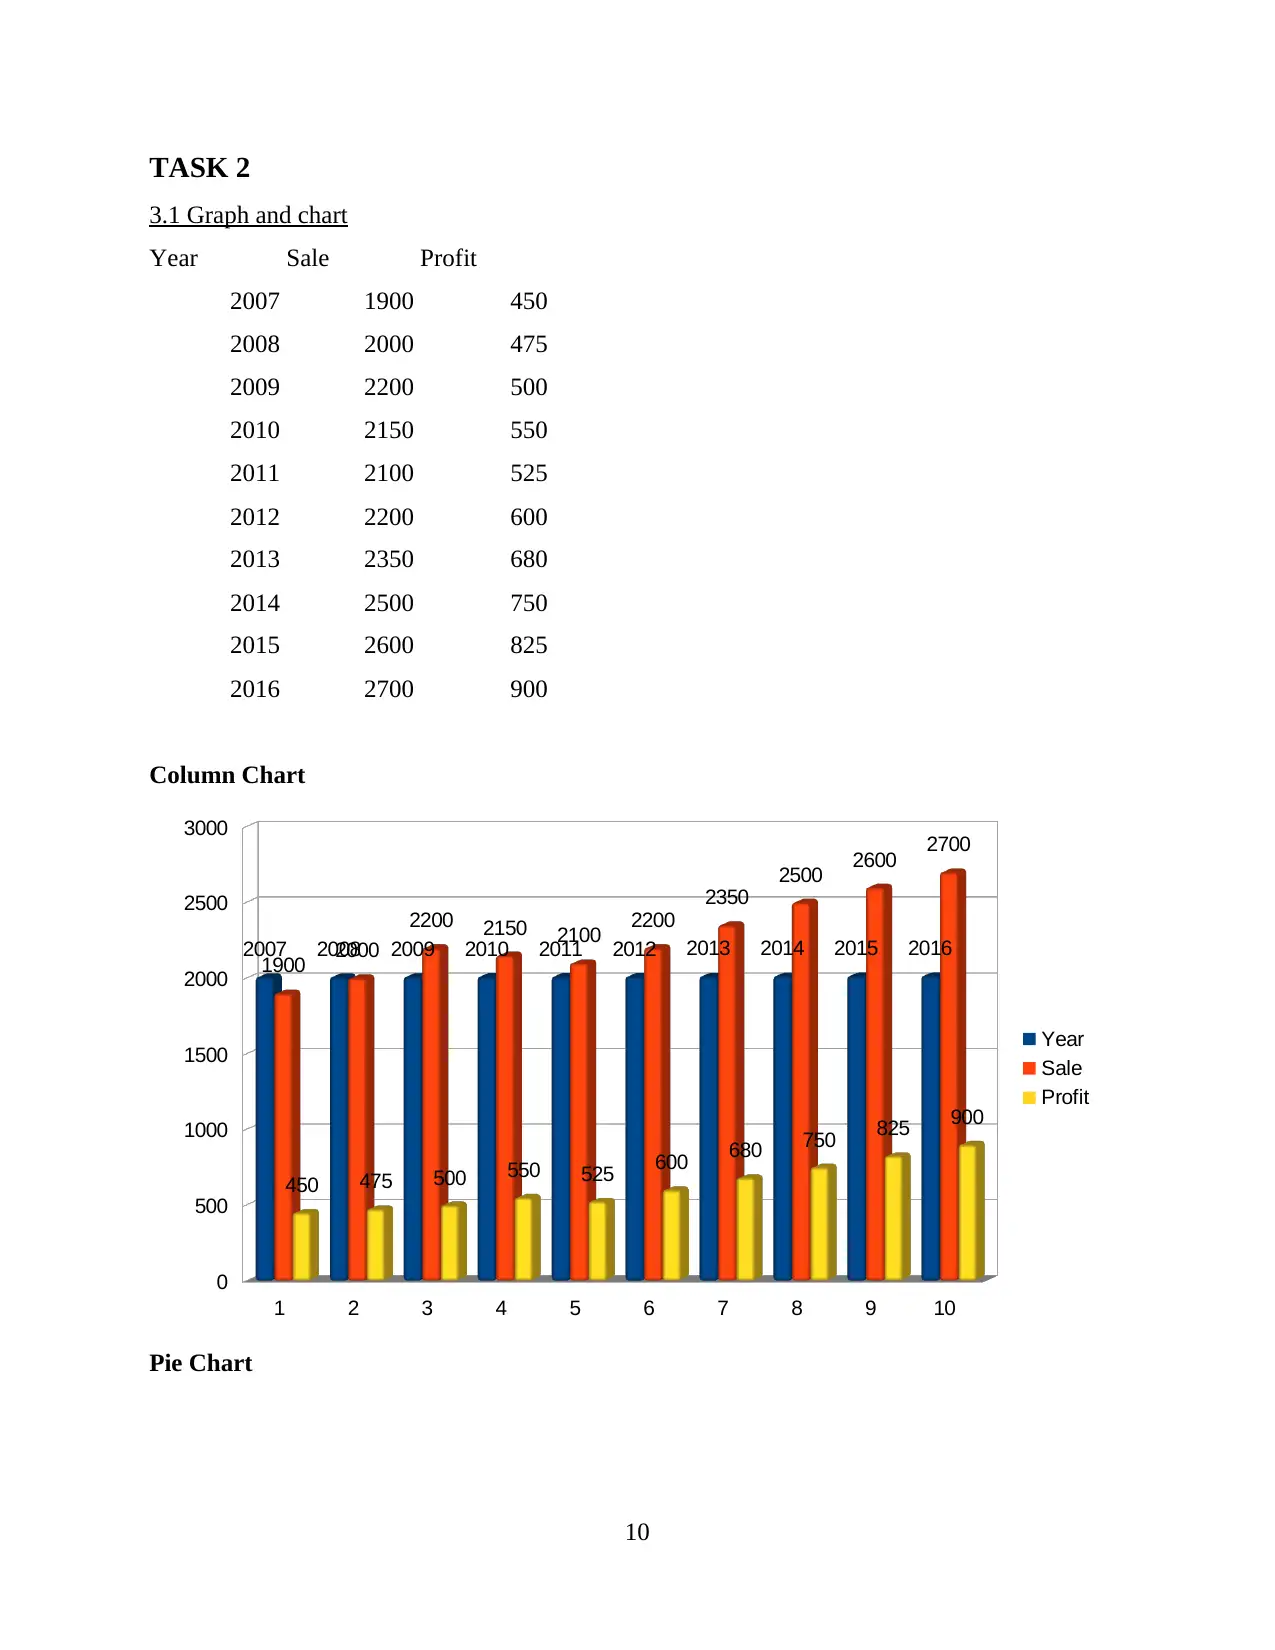
3.1 Graph and chart
Year Sale Profit
2007 1900 450
2008 2000 475
2009 2200 500
2010 2150 550
2011 2100 525
2012 2200 600
2013 2350 680
2014 2500 750
2015 2600 825
2016 2700 900
Column Chart
Pie Chart
10
1 2 3 4 5 6 7 8 9 10
0
500
1000
1500
2000
2500
3000
2007 2008 2009 2010 2011 2012 2013 2014 2015 2016
1900 2000
2200 2150 2100 2200
2350
2500 2600 2700
450 475 500 550 525 600 680 750 825 900
Year
Sale
Profit
⊘ This is a preview!⊘
Do you want full access?
Subscribe today to unlock all pages.
Trusted by 1+ million students worldwide
1 out of 20
Related Documents


Your All-in-One AI-Powered Toolkit for Academic Success.
+13062052269
info@desklib.com
Available 24*7 on WhatsApp / Email
![[object Object]](/_next/static/media/star-bottom.7253800d.svg)
Unlock your academic potential
Copyright © 2020–2026 A2Z Services. All Rights Reserved. Developed and managed by ZUCOL.