Business Decision-Making Report: Data Analysis and Recommendations
VerifiedAdded on 2020/01/23
|20
|4086
|419
Report
AI Summary
This report provides a comprehensive analysis of business decision-making, focusing on a case study involving the launch of a new coffee sachet business in London. The report begins with a detailed plan for collecting primary and secondary data, including survey methodology and questionnaire design. It then delves into statistical analysis, calculating mean, mode, median, and measures of dispersion, as well as correlation coefficients to understand relationships between variables such as temperature and sales. The report further includes the creation of line and bar graphs to visualize trends in sales, costs, and profits and also includes a trend line analysis for forecasting. A critical path analysis and investment appraisal techniques are used to assess project viability. The report culminates in a formal business report and presentation of the findings, providing valuable insights and recommendations for the business venture.

Business Decision-Making
Paraphrase This Document
Need a fresh take? Get an instant paraphrase of this document with our AI Paraphraser
Table of Contents
INTRODUCTION...........................................................................................................................3
TASK 1............................................................................................................................................3
1.1 Plan for the collection of primary and secondary data collection.........................................3
1.2 Stating the survey methodology and sampling frame............................................................4
1.3 Preparing a questionnaire......................................................................................................4
TASK 2............................................................................................................................................7
2.1 Calculating mean, mode and median.....................................................................................7
2.2 Analysing the measures which are used for the purpose of decision making.......................8
2.3 Analyzing measures of dispersion.........................................................................................8
2.4 Calculating correlation coefficient......................................................................................10
TASK 3..........................................................................................................................................10
3.1 Producing line and bar graphs.............................................................................................10
3.2 Drawing trend line for forecasting the future trend or patterns...........................................12
3.3 Preparing a presentation which presents the result..............................................................13
3.4 Formal business report.........................................................................................................13
TASK 4..........................................................................................................................................14
4.1 Analysing the critical path and project duration..................................................................14
TASK 5..........................................................................................................................................15
4.2 Assessing the viability of project by using investment appraisal techniques......................15
CONCLUSION..............................................................................................................................16
REFERENCES..............................................................................................................................17

⊘ This is a preview!⊘
Do you want full access?
Subscribe today to unlock all pages.
Trusted by 1+ million students worldwide
INTRODUCTION
In the business unit, the manager is filled up with the responsibility to take suitable
decisions which aid in the growth and profitability of the firm. Moreover, with the aim to success
in the dynamic business environment, it is highly required for the manager to take a decision by
conducting the in-depth investigation of each factor. Through this, a business unit would become
able to develop highly strategic and policy framework for the near future. The present report is
based on the case scenario which entails that individual wants to open new coffee sachet in
London. In this context, the report will describe the extent to which such business project is
viable regarding both financial and non-financial through the means of primary and secondary
investigation. Besides this, it will also shed light on the ways through which business entity can
select the best investment proposal out of several alternatives.
TASK 1
1.1 Plan for the collection of primary and secondary data collection
A collection of primary data: In the present time, business organisations and entrepreneur places
the high level of emphasis on the collection of primary data. The rationale behind this, it
provides researcher and concerned organisation with highly reliable information for decision
making according to the issue as well as the purpose of investigation (Hwang and Yoon, 2012).
On the basis of the case, scenario client wants to introduce a new coffee sachet brand in London.
In this regard, with the aim to get primary data researcher will conduct a survey with the help of
a questionnaire.
It is one of the most effectual sources of data collection which in turn helps in assessing
the viewpoints of men and women towards the new coffee brand. Hence, sample selection is
required for conducting survey more effectively and efficiently. Thus, by using simple random
sampling 30 people including both men and women has been selected by the scholar through the
means of simple random sampling technique (Popescu and et.al., 2012). After that, the researcher
will prepare questionnaire by including questions about price, taste, preferences, etc. In this way,
the survey will be conducted by the researcher through the means of open and close ended
questionnaire.
Paraphrase This Document
Need a fresh take? Get an instant paraphrase of this document with our AI Paraphraser
Secondary data collection: In order to evaluate the market trend and pattern researcher will also
gather secondary data before introducing a new coffee sachet. Hence, the investigator will take
the assistance of books, journals and scholarly articles with the aim to get information about the
extent to which customer prefer to go and spend money in beverages made with coffee (Chai,
Liu and Ngai, 2013). Along with his, data regarding sales of other famous small store of London
will also be gathered by the researcher for understanding the purchasing behaviour of customers
(Yager and Kacprzyk, 2012). Thus, by using both primary and secondary information scholar
would become able to make a competent framework for the near future.
1.2 Stating the survey methodology and sampling frame
Methodology: Researcher has developed the methodology with the aim to conduct the
whole study in an appropriate manner. The rationale behind this predetermined plan reduces the
possibility of mistakes to the large extent. There are several types of survey techniques which
can be used for the purpose of investigation such as cross-sectional, longitudinal, online, etc.
(Types of the survey, 2016). Hence, online survey methodology has been selected by the scholar
for the collection of primary data. This technique is highly effective in turn helps in gathering
data at affordable prices. Besides this, it also offers a high level of convenience to the scholar in
the collection of data (Bounfour and Edvinsson, 2012). Thus, according to such aspect scholar
will send a questionnaire on the mail id of the respondents by taking permission from them.
Further, the scholar will also encourage respondents to fill suitable answer in the questionnaire
and revert it back. Hence, by following such process researcher will collect primary data.
Sampling frame: In a survey, a scholar has to select sample because it is not possible to
carry out the study on the whole population. The sampling frame can be developed by the
researcher more effectually with the help of probabilistic and non-probabilistic techniques. Thus,
simple random sampling technique has been selected by the scholar in which each respondent
gets the equal chance to being elected as a sample (Crossan, Mazutis and Seijts, 2013). Hence,
by using such technique 30 respondents have been selected by the scholar on which the whole
study will be focused.
1.3 Preparing a questionnaire
The questionnaire is the main source which helps in extracting the suitable and reliable
information from respondents (Levine, Thompson and Messick, 2013). Thus, both close and
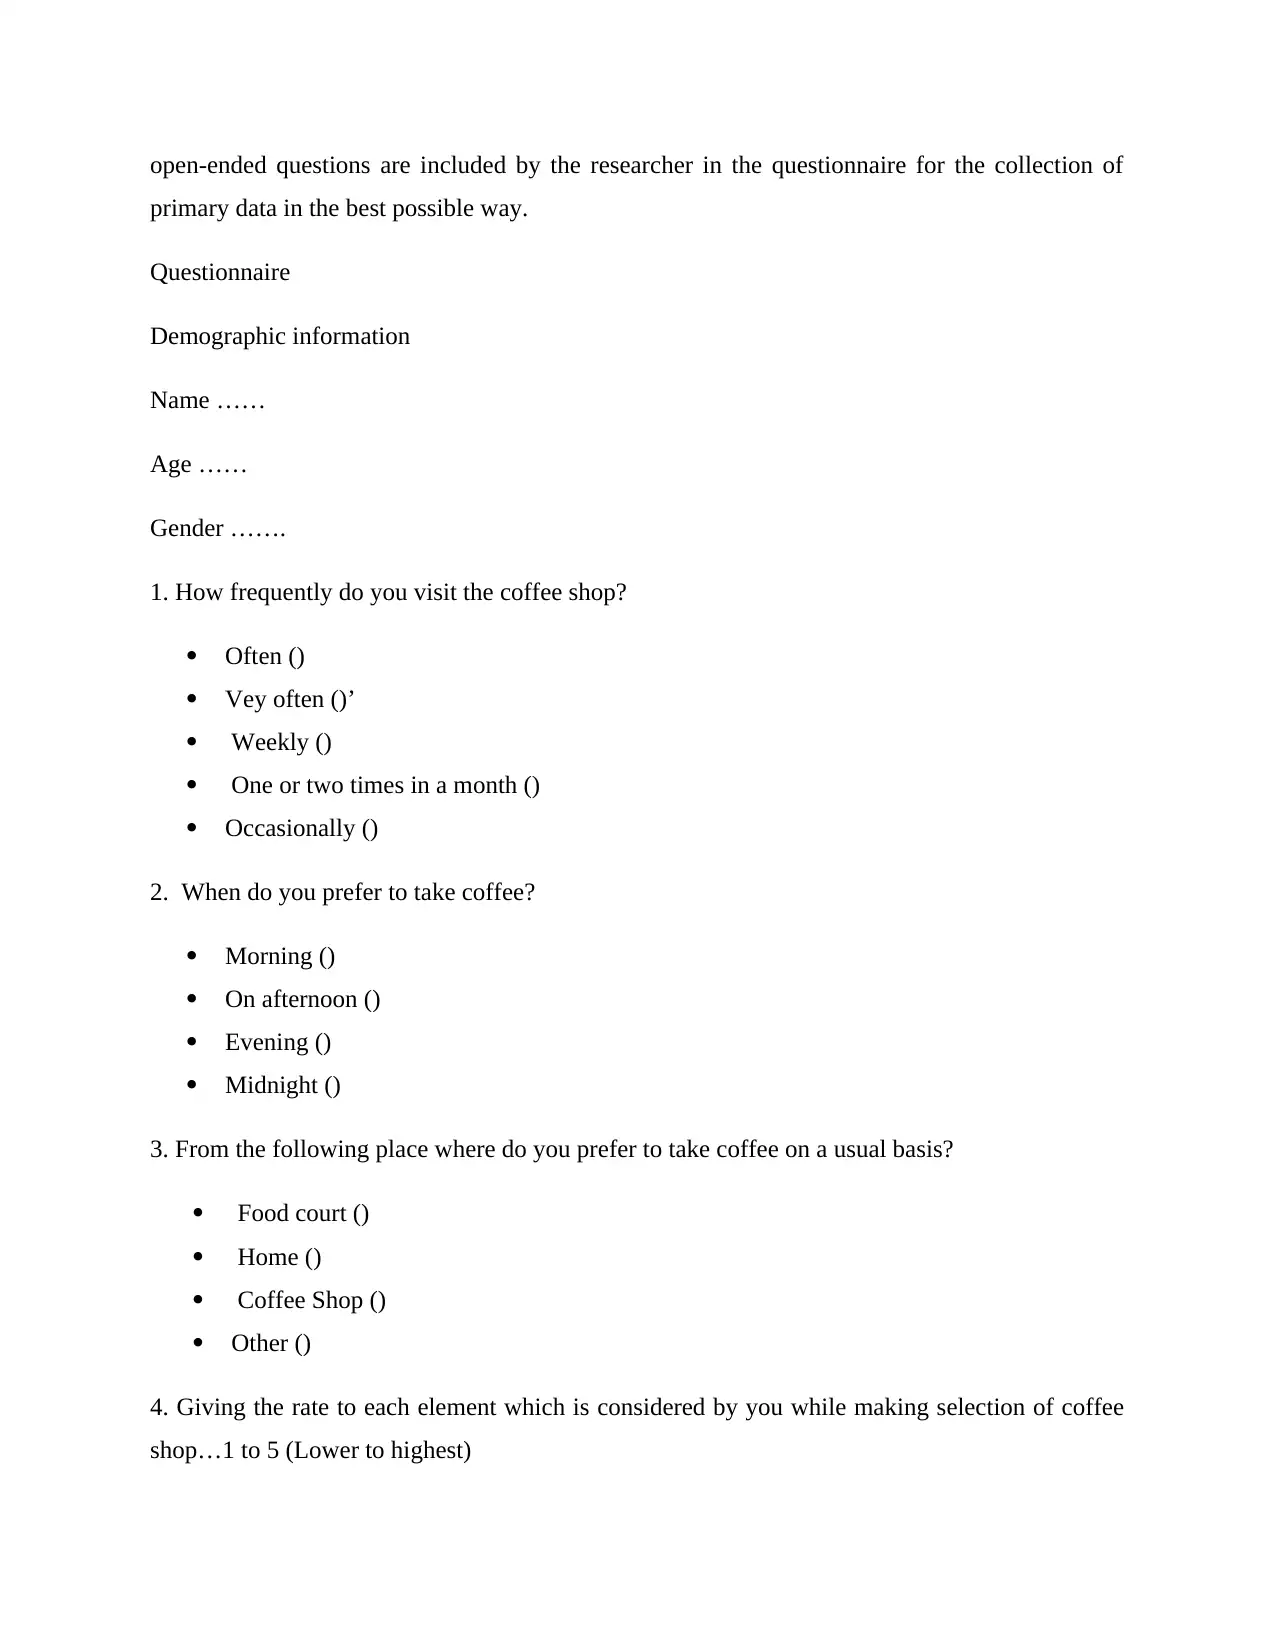
open-ended questions are included by the researcher in the questionnaire for the collection of
primary data in the best possible way.
Questionnaire
Demographic information
Name ……
Age ……
Gender …….
1. How frequently do you visit the coffee shop?
Often ()
Vey often ()’
Weekly ()
One or two times in a month ()
Occasionally ()
2. When do you prefer to take coffee?
Morning ()
On afternoon ()
Evening ()
Midnight ()
3. From the following place where do you prefer to take coffee on a usual basis?
Food court ()
Home ()
Coffee Shop ()
Other ()
4. Giving the rate to each element which is considered by you while making selection of coffee
shop…1 to 5 (Lower to highest)
⊘ This is a preview!⊘
Do you want full access?
Subscribe today to unlock all pages.
Trusted by 1+ million students worldwide
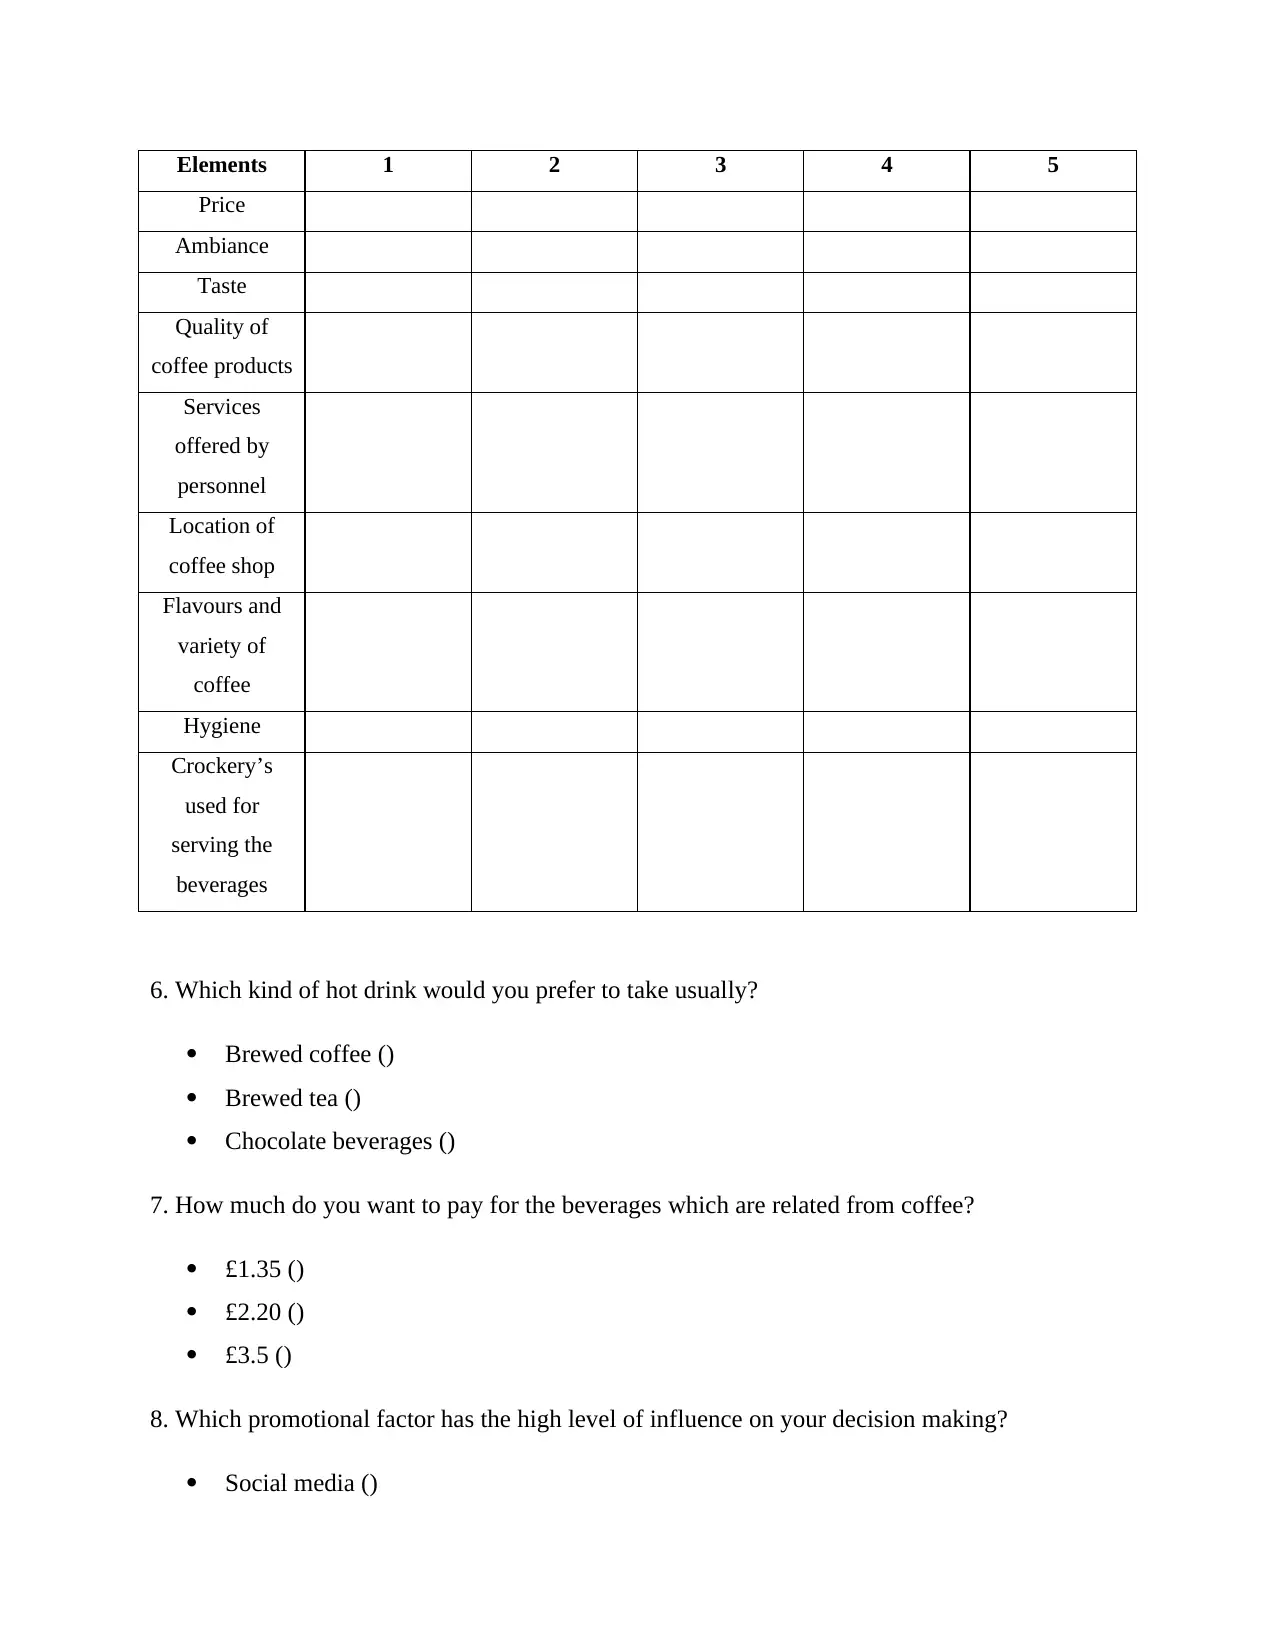
Elements 1 2 3 4 5
Price
Ambiance
Taste
Quality of
coffee products
Services
offered by
personnel
Location of
coffee shop
Flavours and
variety of
coffee
Hygiene
Crockery’s
used for
serving the
beverages
6. Which kind of hot drink would you prefer to take usually?
Brewed coffee ()
Brewed tea ()
Chocolate beverages ()
7. How much do you want to pay for the beverages which are related from coffee?
£1.35 ()
£2.20 ()
£3.5 ()
8. Which promotional factor has the high level of influence on your decision making?
Social media ()
Paraphrase This Document
Need a fresh take? Get an instant paraphrase of this document with our AI Paraphraser
Word of mouth publicity ()
Other …. Kindly specify ()
9. Which brand comes in your mind first while taking a decision about the coffee shop?
…………………………………………………………….
10. Do you want to give any recommendation about the changes which do you want in the
coffee shop or brand ……………………………………………………………………………….
TASK 2
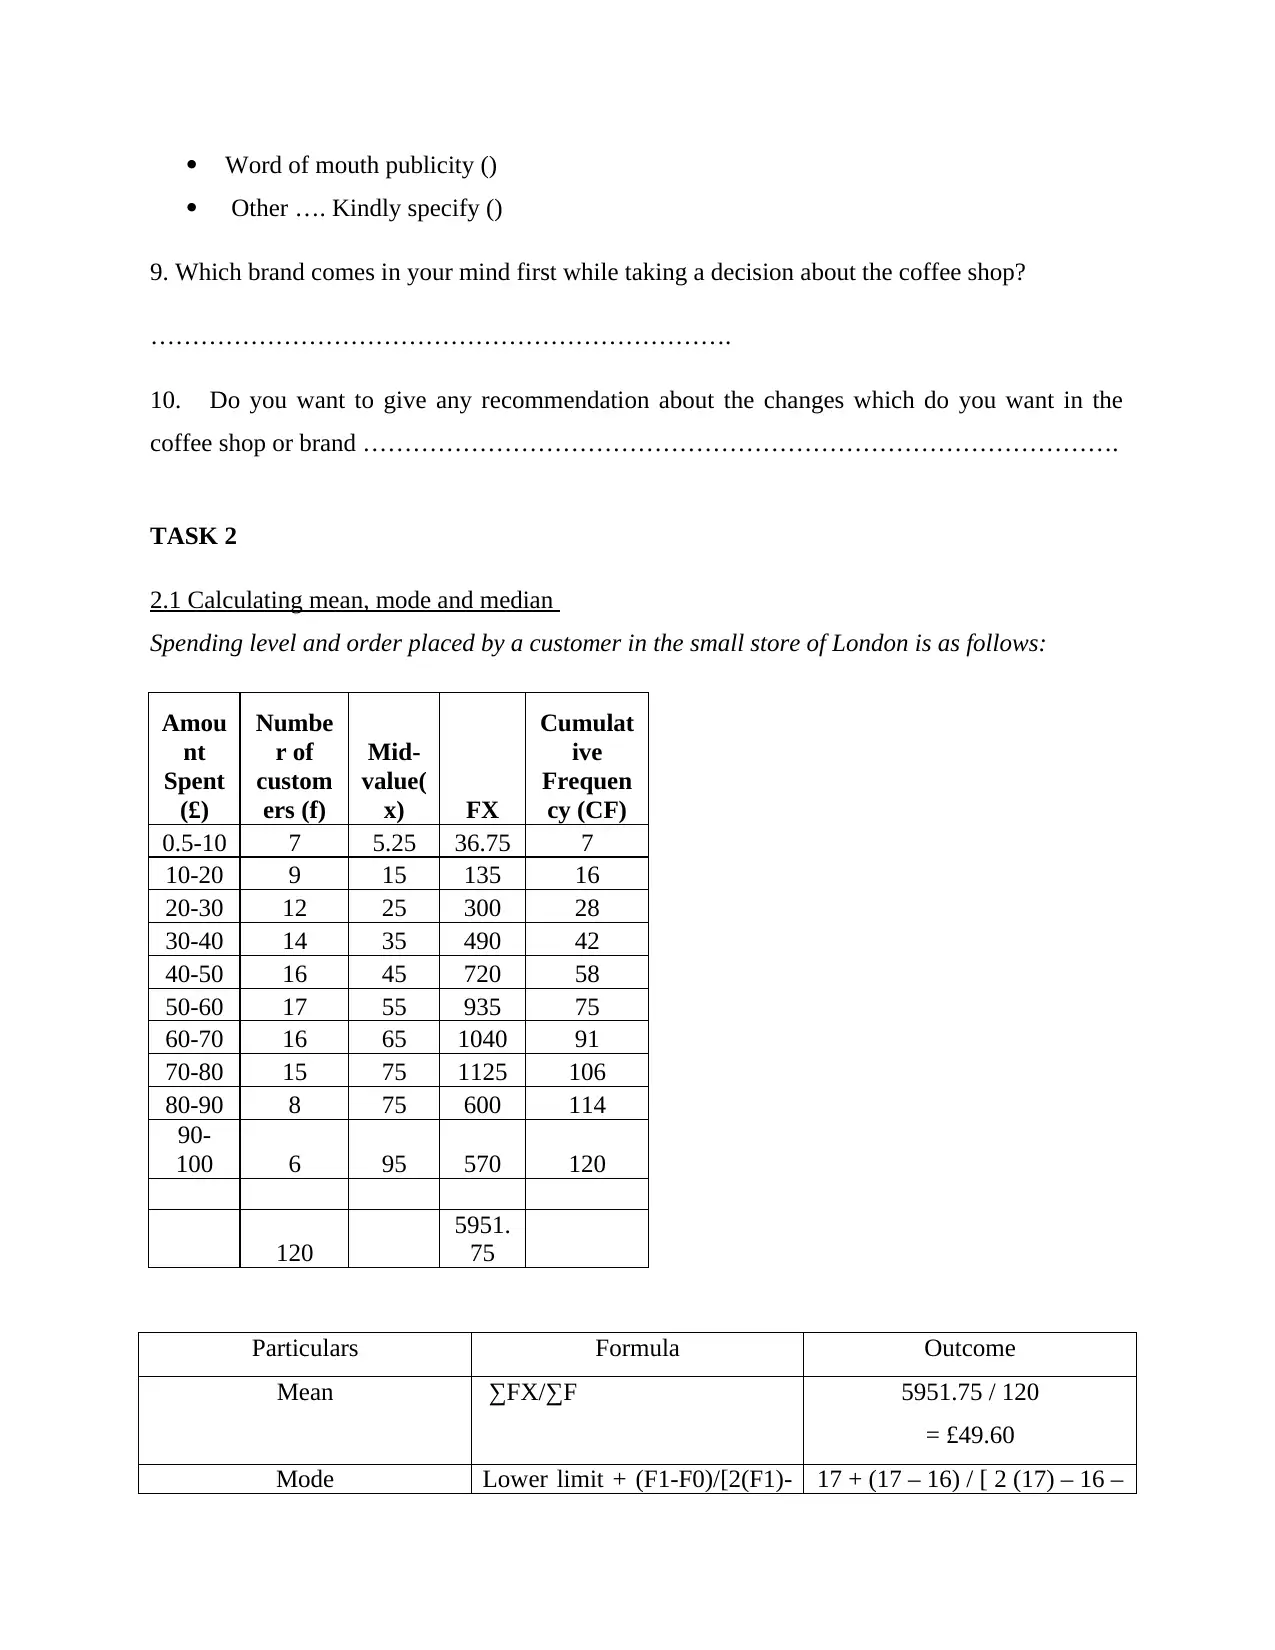
2.1 Calculating mean, mode and median
Spending level and order placed by a customer in the small store of London is as follows:
Amou
nt
Spent
(£)
Numbe
r of
custom
ers (f)
Mid-
value(
x) FX
Cumulat
ive
Frequen
cy (CF)
0.5-10 7 5.25 36.75 7
10-20 9 15 135 16
20-30 12 25 300 28
30-40 14 35 490 42
40-50 16 45 720 58
50-60 17 55 935 75
60-70 16 65 1040 91
70-80 15 75 1125 106
80-90 8 75 600 114
90-
100 6 95 570 120
120
5951.
75
Particulars Formula Outcome
Mean ∑FX/∑F 5951.75 / 120
= £49.60
Mode Lower limit + (F1-F0)/[2(F1)- 17 + (17 – 16) / [ 2 (17) – 16 –
Other …. Kindly specify ()
9. Which brand comes in your mind first while taking a decision about the coffee shop?
…………………………………………………………….
10. Do you want to give any recommendation about the changes which do you want in the
coffee shop or brand ……………………………………………………………………………….
TASK 2
2.1 Calculating mean, mode and median
Spending level and order placed by a customer in the small store of London is as follows:
Amou
nt
Spent
(£)
Numbe
r of
custom
ers (f)
Mid-
value(
x) FX
Cumulat
ive
Frequen
cy (CF)
0.5-10 7 5.25 36.75 7
10-20 9 15 135 16
20-30 12 25 300 28
30-40 14 35 490 42
40-50 16 45 720 58
50-60 17 55 935 75
60-70 16 65 1040 91
70-80 15 75 1125 106
80-90 8 75 600 114
90-
100 6 95 570 120
120
5951.
75
Particulars Formula Outcome
Mean ∑FX/∑F 5951.75 / 120
= £49.60
Mode Lower limit + (F1-F0)/[2(F1)- 17 + (17 – 16) / [ 2 (17) – 16 –
F0-F2)*10 15) * 10
= 53
Median ∑F/2 120 / 2 = 60
On the basis of this aspect
class interval of 50-60 is
selected
Median= L1+ [(N/2 – C)/F]* i
(difference between the class
interval)
M = 50 +[ (120 / 2 – 58 ) /
17] * 10
M = 50 + 1.18 = £51.18
2.2 Analysing the measures which are used for the purpose of decision-making
By taking into consideration the above statistical aspects it can be stated that average
value which is spent by customers in the store of Stephanie is £49.60. Thus, 16 orders which are
placed by the customers are in the range of £49.60. In addition to this, 50% amount which is
incurred by the customers on coffee products was £51.18. Thus, approximately 17orders which
were received by the firm are related to the price of £51.18 which is good. Thus, by taking into
consideration such aspect it can be said that both mean and median level sales are highly near to
each other and maximum spending is related to the range of £49 to £51.
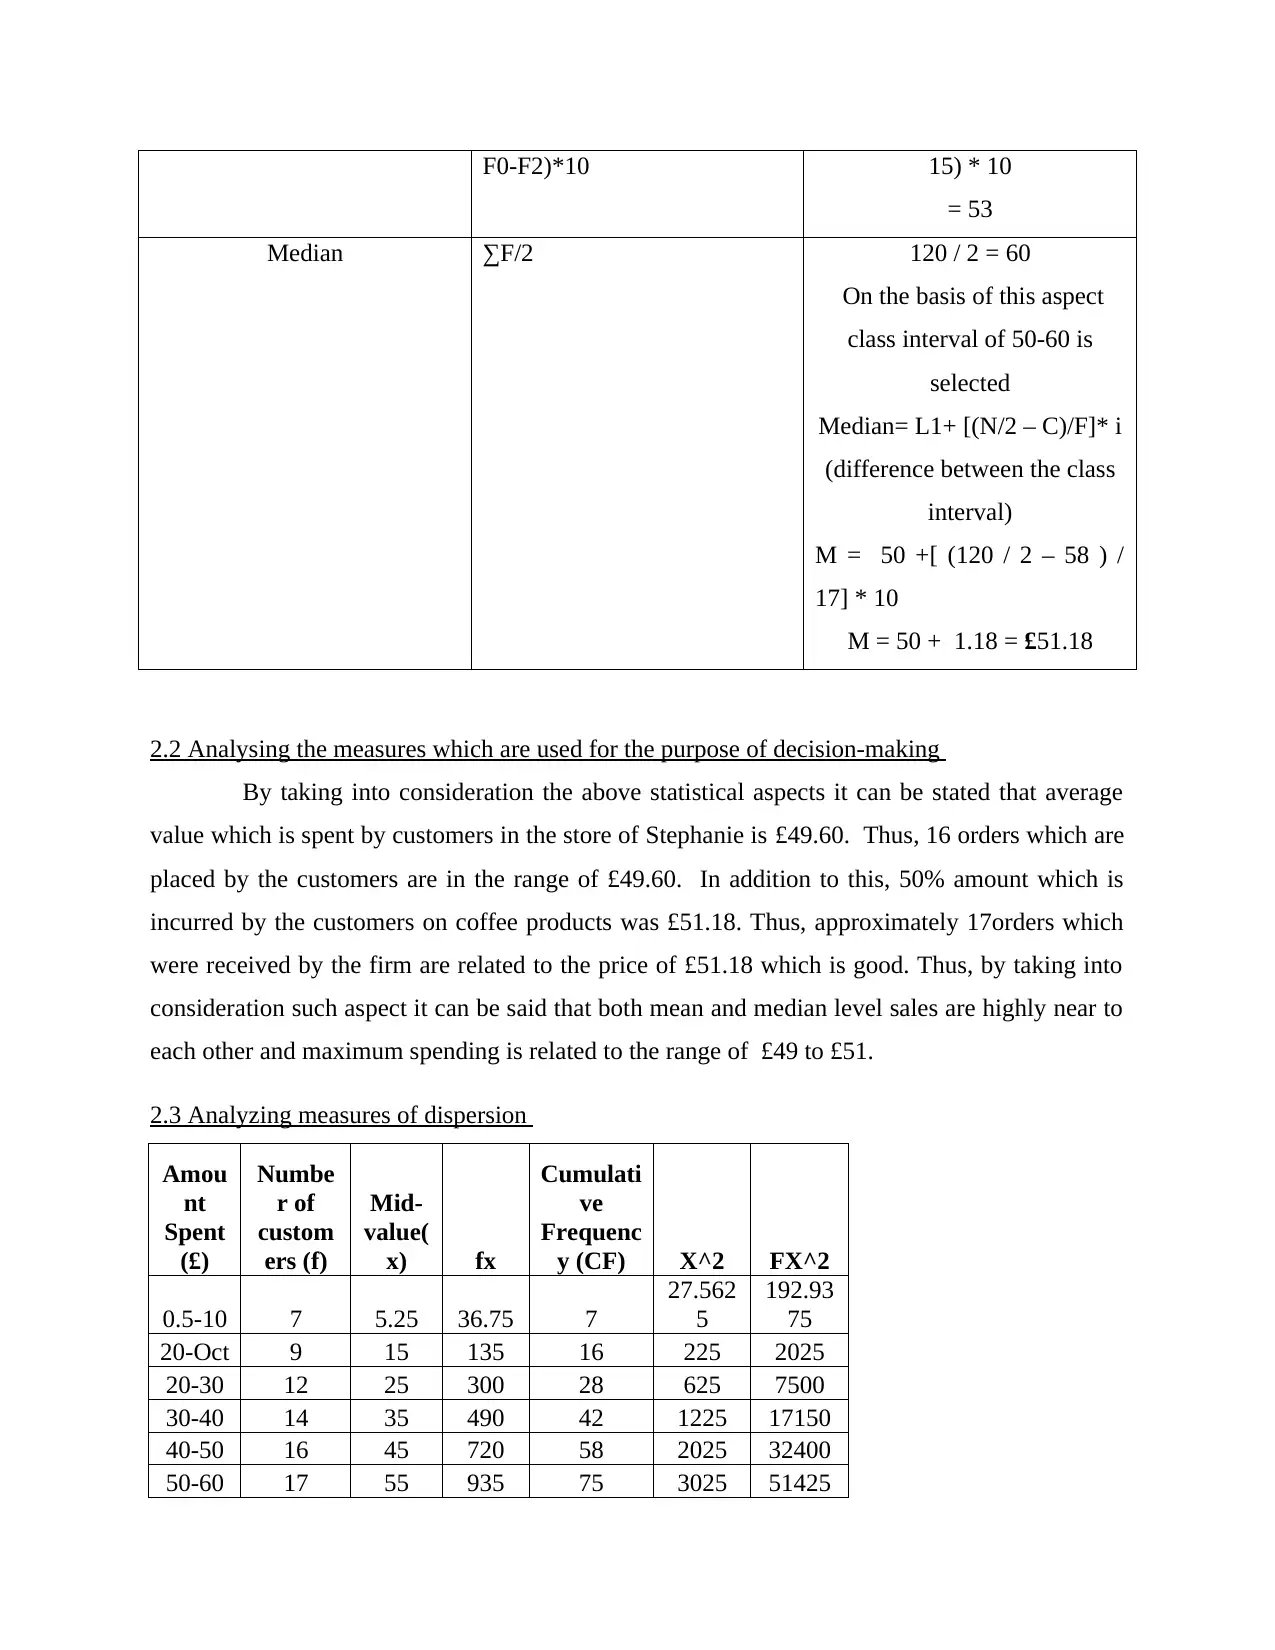
2.3 Analyzing measures of dispersion
Amou
nt
Spent
(£)
Numbe
r of
custom
ers (f)
Mid-
value(
x) fx
Cumulati
ve
Frequenc
y (CF) X^2 FX^2
0.5-10 7 5.25 36.75 7
27.562
5
192.93
75
20-Oct 9 15 135 16 225 2025
20-30 12 25 300 28 625 7500
30-40 14 35 490 42 1225 17150
40-50 16 45 720 58 2025 32400
50-60 17 55 935 75 3025 51425
= 53
Median ∑F/2 120 / 2 = 60
On the basis of this aspect
class interval of 50-60 is
selected
Median= L1+ [(N/2 – C)/F]* i
(difference between the class
interval)
M = 50 +[ (120 / 2 – 58 ) /
17] * 10
M = 50 + 1.18 = £51.18
2.2 Analysing the measures which are used for the purpose of decision-making
By taking into consideration the above statistical aspects it can be stated that average
value which is spent by customers in the store of Stephanie is £49.60. Thus, 16 orders which are
placed by the customers are in the range of £49.60. In addition to this, 50% amount which is
incurred by the customers on coffee products was £51.18. Thus, approximately 17orders which
were received by the firm are related to the price of £51.18 which is good. Thus, by taking into
consideration such aspect it can be said that both mean and median level sales are highly near to
each other and maximum spending is related to the range of £49 to £51.
2.3 Analyzing measures of dispersion
Amou
nt
Spent
(£)
Numbe
r of
custom
ers (f)
Mid-
value(
x) fx
Cumulati
ve
Frequenc
y (CF) X^2 FX^2
0.5-10 7 5.25 36.75 7
27.562
5
192.93
75
20-Oct 9 15 135 16 225 2025
20-30 12 25 300 28 625 7500
30-40 14 35 490 42 1225 17150
40-50 16 45 720 58 2025 32400
50-60 17 55 935 75 3025 51425
⊘ This is a preview!⊘
Do you want full access?
Subscribe today to unlock all pages.
Trusted by 1+ million students worldwide
60-70 16 65 1040 91 4225 67600
70-80 15 75 1125 106 5625 84375
80-90 8 75 600 114 5625 45000
90-
100 6 95 570 120 9025 54150
120
5951.
75
31652.
56
361817
.9
Particulars Formula Outcome
Variance ∑Fx2 – ((∑Fx)2 /n)/ n – 1 = 361817.9 – (5951.75)^2 /
120 / (120-1)
= 559.86
Standard deviation √ Variance = √ 559.86
= 23.66
Quartile 1 Q1 = ∑F/4
Q1 = L1 + (∑F/4 – C)/F * i
120 / 4
= 30
Such figure lies between the
range of 30-40
= 30 + (30 - 28) / 14 * 10
= 30 + 1.43
= 31.43
Quartile 2 q3 = 3(∑F/4) 3 (120 / 4)
= 90
Such figure lies between the
range of 60-70
= 60 + (90 - 75) / 16 * 10
= 50 + 9.375
= 59.37
Inter-quartile range (Q3 - Q1) 59.37 – 31.43
Paraphrase This Document
Need a fresh take? Get an instant paraphrase of this document with our AI Paraphraser
= 27.94
25th Percentile As similar to quartile 1 31.43
75th percentile As similar to quartile 3 59.37
2.4 Calculating correlation coefficient
Correlation coefficient: This measure of statistics helps in determining the degree to which two
variables are highly associated with each other (Chwolka and Raith, 2012). Hence, by identifying
such aspect business entity can develop highly suitable and competent framework for the near
future.
Temperature Sales
(in £) XY X^2 Y^2
20 320 6400 400 102400
24 411 9864 576 168921
11 192 2112 121 36864
17 259 4403 289 67081
9 170 1530 81 28900
15 243 3645 225 59049
25 430 10750 625 184900
121 2025 38704 2317 648115
R = N∑xy – (∑X) ( ∑Y) / √[N∑X^2 – (∑X)^2 – (∑Y)^2] (Correlation coefficient, 2016)
= 8*38704 – (121) (2025) - √8*2317 – (121)^2-(2025)^2]
= .99
Calculation of correlation coefficient
Particulars Sales Temperature
Sales 1 .99
Temperature .99 1
The above-mentioned calculation presents that both sales revenue and temperature is
highly correlated with each other. It shows that customers prefer to visit the restaurant more
when the temperature is pleasant. Hence, sales revenue of the firm will increase or decrease by
the temperature level (Häfeli and et.al., 2013). Thus, the coffee shop needs to make the focus on
finding the suitable alternatives which in turn helps them in enhancing sales to a large extent.
TASK 3
3.1 Producing line and bar graphs
Sales, cost and profit figures of Graham Consultants Ltd is as follows:
Year Sales (in £ ‘000) Costs (Direct and
indirect)
Final profit
2000 165 135 45
2001 185 125 65
2002 225 145 85
2003 235 145 95
2004 315 175 145
2005 335 175 165
2006 265 165 105
2007 245 145 105
2008 245 175 75
2009 255 155 105
2010 295 155 145
Bar chart
⊘ This is a preview!⊘
Do you want full access?
Subscribe today to unlock all pages.
Trusted by 1+ million students worldwide
1 out of 20
Related Documents


Your All-in-One AI-Powered Toolkit for Academic Success.
+13062052269
info@desklib.com
Available 24*7 on WhatsApp / Email
![[object Object]](/_next/static/media/star-bottom.7253800d.svg)
Unlock your academic potential
Copyright © 2020–2026 A2Z Services. All Rights Reserved. Developed and managed by ZUCOL.