Business Decision Making Report: Data Analysis and Insights
VerifiedAdded on 2020/01/07
|35
|5394
|201
Report
AI Summary
This report provides a comprehensive analysis of business decision-making, focusing on the 'Murano' restaurant. It begins with a detailed plan for collecting primary and secondary data, including survey methodologies and questionnaires. The report then summarizes the collected data, employing measures of dispersion, quartiles, percentiles, and correlation to derive meaningful conclusions. Furthermore, it creates trend lines to assist in forecasting and presents these findings in a business report format. The analysis includes project planning tools like Gantt charts and network diagrams, as well as financial assessments such as Net Present Value (NPV), Internal Rate of Return (IRR), and payback period calculations. The report concludes with recommendations based on the data analysis and forecasting results, providing valuable insights for strategic decision-making in the business context.

BUSINESS DECISION
MAKING
MAKING
Paraphrase This Document
Need a fresh take? Get an instant paraphrase of this document with our AI Paraphraser
TABLE OF CONTENTS
INTRODUCTION...........................................................................................................................1
TASK 1............................................................................................................................................1
1.1 Plan for the collection of the primary and the secondary data for the “Murano”.................1
1.2 Presenting of the survey methodology and using of the frame.............................................2
1.3 Questionnaire for the given business problems in the assignment.......................................3
TASK 2............................................................................................................................................5
2.1 Summarisation of the data and the information for decision making...................................5
2.2 Conclusion...........................................................................................................................11
2.3 Measures of dispersion for the business scenario given.....................................................12
2.4 Use of the quartiles, percentiles and correlation in deducing of meaningful conclusion....15
TASK 2..........................................................................................................................................16
3.1 Deducing of meaningful conclusion in respect to the information derived........................16
3.2 Creating trend lines for assisting the forecasting for particular business information........17
3.3: Presentation in respect to the information deduced from the above information..............18
3.4 Business Report...................................................................................................................22
Task 3.............................................................................................................................................23
4.1, 4.2.......................................................................................................................................23
4.3..............................................................................................................................................26
CONCLUSION..............................................................................................................................29
RECOMMENDATION.................................................................................................................29
References......................................................................................................................................31
Index of Tables
Table 1: Estimated Cash flow........................................................................................................26
Table 2: Net present value.............................................................................................................27
Table 3: Payback period.................................................................................................................28
Table 4: Internal Rate of Return....................................................................................................29
⊘ This is a preview!⊘
Do you want full access?
Subscribe today to unlock all pages.
Trusted by 1+ million students worldwide
Illustration Index
Illustration 1: Using formula to calculate mean of collected data.................................................12
Illustration 2: Formula for evaluating median on odd number of respondents.............................12
Illustration 3: Formula for evaluating median on even number of respondents............................13
Illustration 4: Using formula to calculate Standard deviation.......................................................13
Illustration 5: Mean, median and mode.........................................................................................14
Illustration 6: Qurtiles....................................................................................................................16
Illustration 7: Visiting new restaurant's factors.............................................................................17
Illustration 8: Trend line for forecasting on Murano restaurant's operations................................18
Illustration 9: Gantt chart for project plan.....................................................................................25
Illustration 10: Network diagram...................................................................................................25
Illustration 11: Used formula for calculating NPV........................................................................27
Illustration 12: Formula for evaluating IRR..................................................................................28
Paraphrase This Document
Need a fresh take? Get an instant paraphrase of this document with our AI Paraphraser
INTRODUCTION
The achievement of success in an organization is best described with the formation of the
decision for the better operation in the society. The availability of the success and the better
management of the resources are determined with the decision made on the finance and the other
operation. The report in here has properly described the importance of the business decision
making. The business decision making here have made proper association for smooth completion
of the report.
TASK 1
1.1 Plan for the collection of the primary and the secondary data for the “Murano”
The plan for the better completion of the research work is developed through the smooth
preparation of the research methodology. The availability of the success and the better
management of the research for the understanding of the situation of “Murano” are ensured. The
plan is created for the smooth development of the acquiring of data for the better completion of
the data for the success in the research work. It is evident that the better plan for the smooth
completion of the research work always demands the support of proper plan in collection of data.
As supported by Heeley et al. (2016 p.149), the two for of collection data are the primary and the
secondary data, that marks the receiving of the information and the completion of the required
objective for the completion of the research objective. The primary data are collected in first
hand basis and secondary data are collected in the basis of other researcher's work.
Data collection methods: Information are gathered through primary and secondary data
collection. It can be described as below: Primary data collection method: In this method, information are gathered through
conducting survey, face to face interview etc by which actual market position of Murano
restaurant can be identified. However, variety of ideas are generated for improving
quality services and effectiveness of the entity (Dillman, Hao and Edwards, 2016). Secondary data collection: On the other hand, under secondary data collection method,
information are collected by using ready and prepared materials. For example; analysing
financial reports of the entity for decision making regarding further years.
1
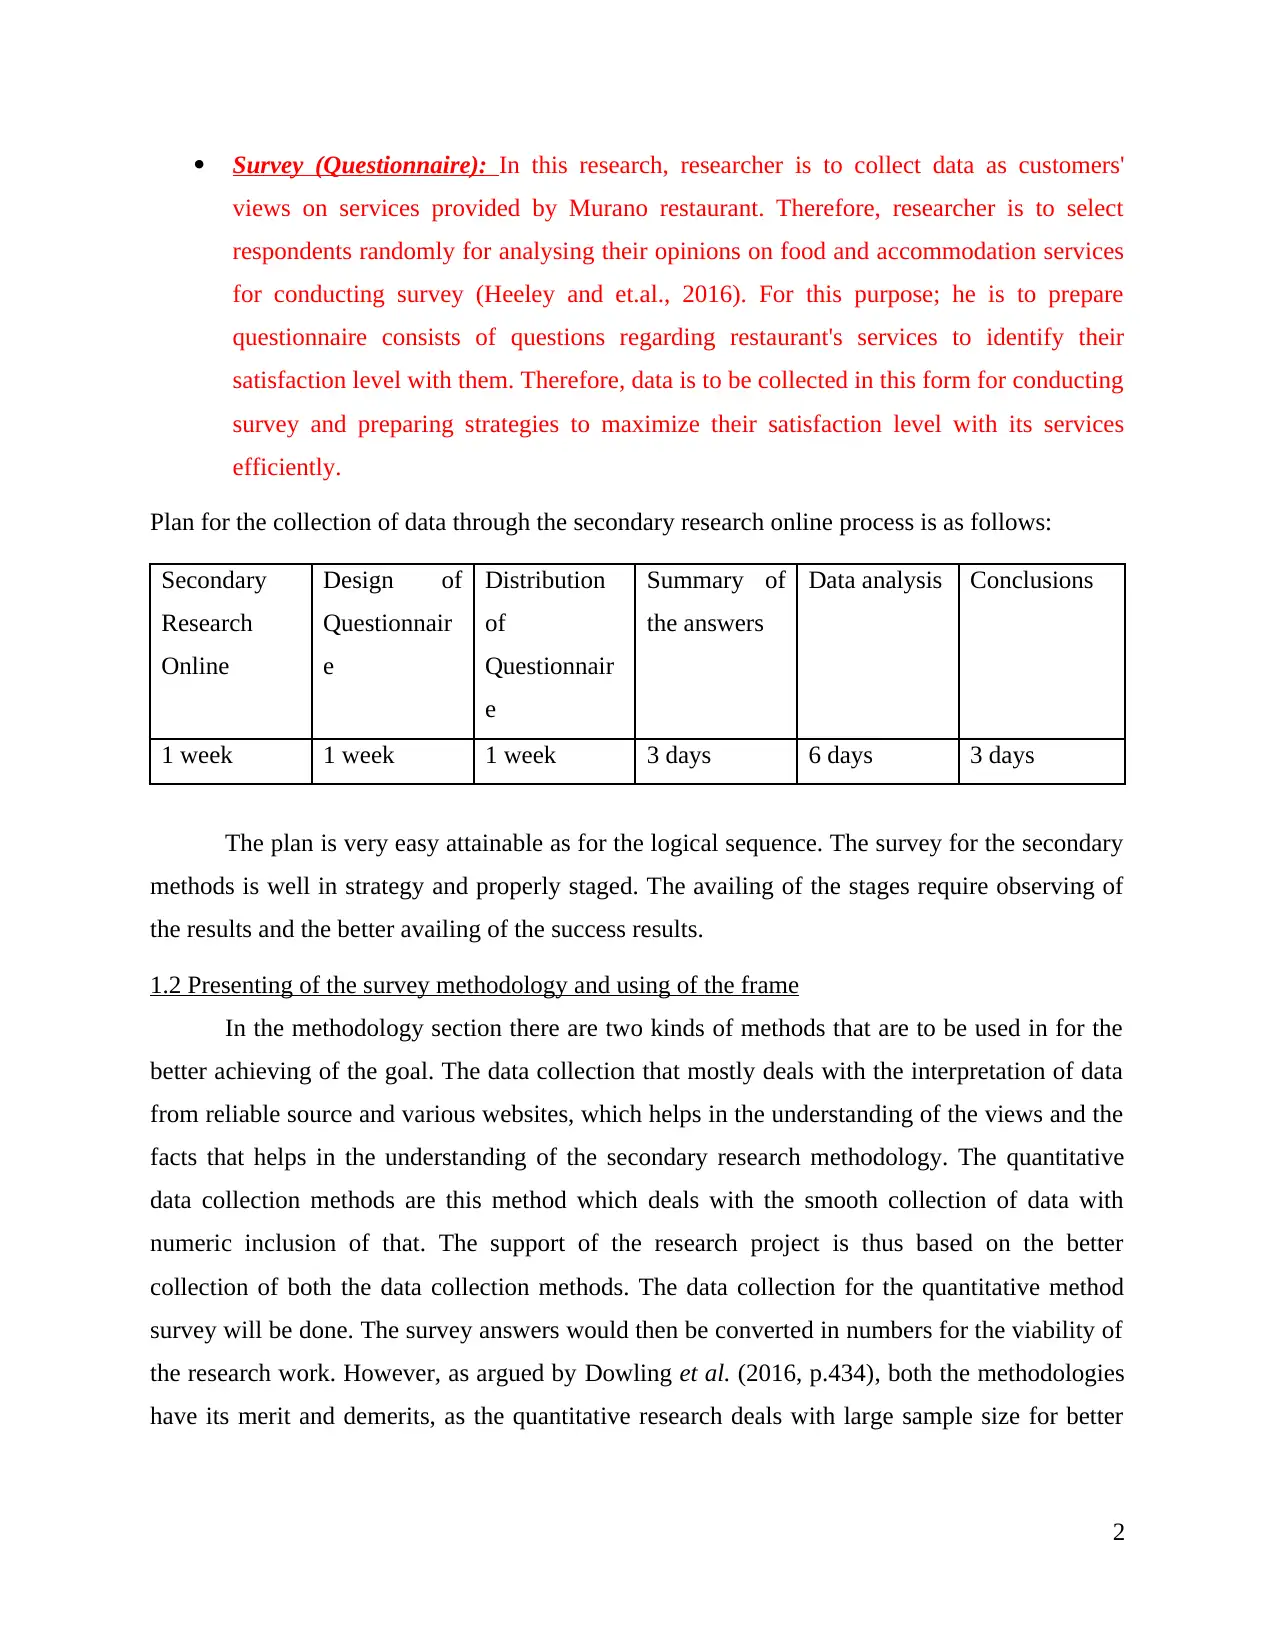
Survey (Questionnaire): In this research, researcher is to collect data as customers'
views on services provided by Murano restaurant. Therefore, researcher is to select
respondents randomly for analysing their opinions on food and accommodation services
for conducting survey (Heeley and et.al., 2016). For this purpose; he is to prepare
questionnaire consists of questions regarding restaurant's services to identify their
satisfaction level with them. Therefore, data is to be collected in this form for conducting
survey and preparing strategies to maximize their satisfaction level with its services
efficiently.
Plan for the collection of data through the secondary research online process is as follows:
Secondary
Research
Online
Design of
Questionnair
e
Distribution
of
Questionnair
e
Summary of
the answers
Data analysis Conclusions
1 week 1 week 1 week 3 days 6 days 3 days
The plan is very easy attainable as for the logical sequence. The survey for the secondary
methods is well in strategy and properly staged. The availing of the stages require observing of
the results and the better availing of the success results.
1.2 Presenting of the survey methodology and using of the frame
In the methodology section there are two kinds of methods that are to be used in for the
better achieving of the goal. The data collection that mostly deals with the interpretation of data
from reliable source and various websites, which helps in the understanding of the views and the
facts that helps in the understanding of the secondary research methodology. The quantitative
data collection methods are this method which deals with the smooth collection of data with
numeric inclusion of that. The support of the research project is thus based on the better
collection of both the data collection methods. The data collection for the quantitative method
survey will be done. The survey answers would then be converted in numbers for the viability of
the research work. However, as argued by Dowling et al. (2016, p.434), both the methodologies
have its merit and demerits, as the quantitative research deals with large sample size for better
2
⊘ This is a preview!⊘
Do you want full access?
Subscribe today to unlock all pages.
Trusted by 1+ million students worldwide
assumption of the answers and the qualitative survey is more of subjective in nature and seems
difficult to interpret the answers.
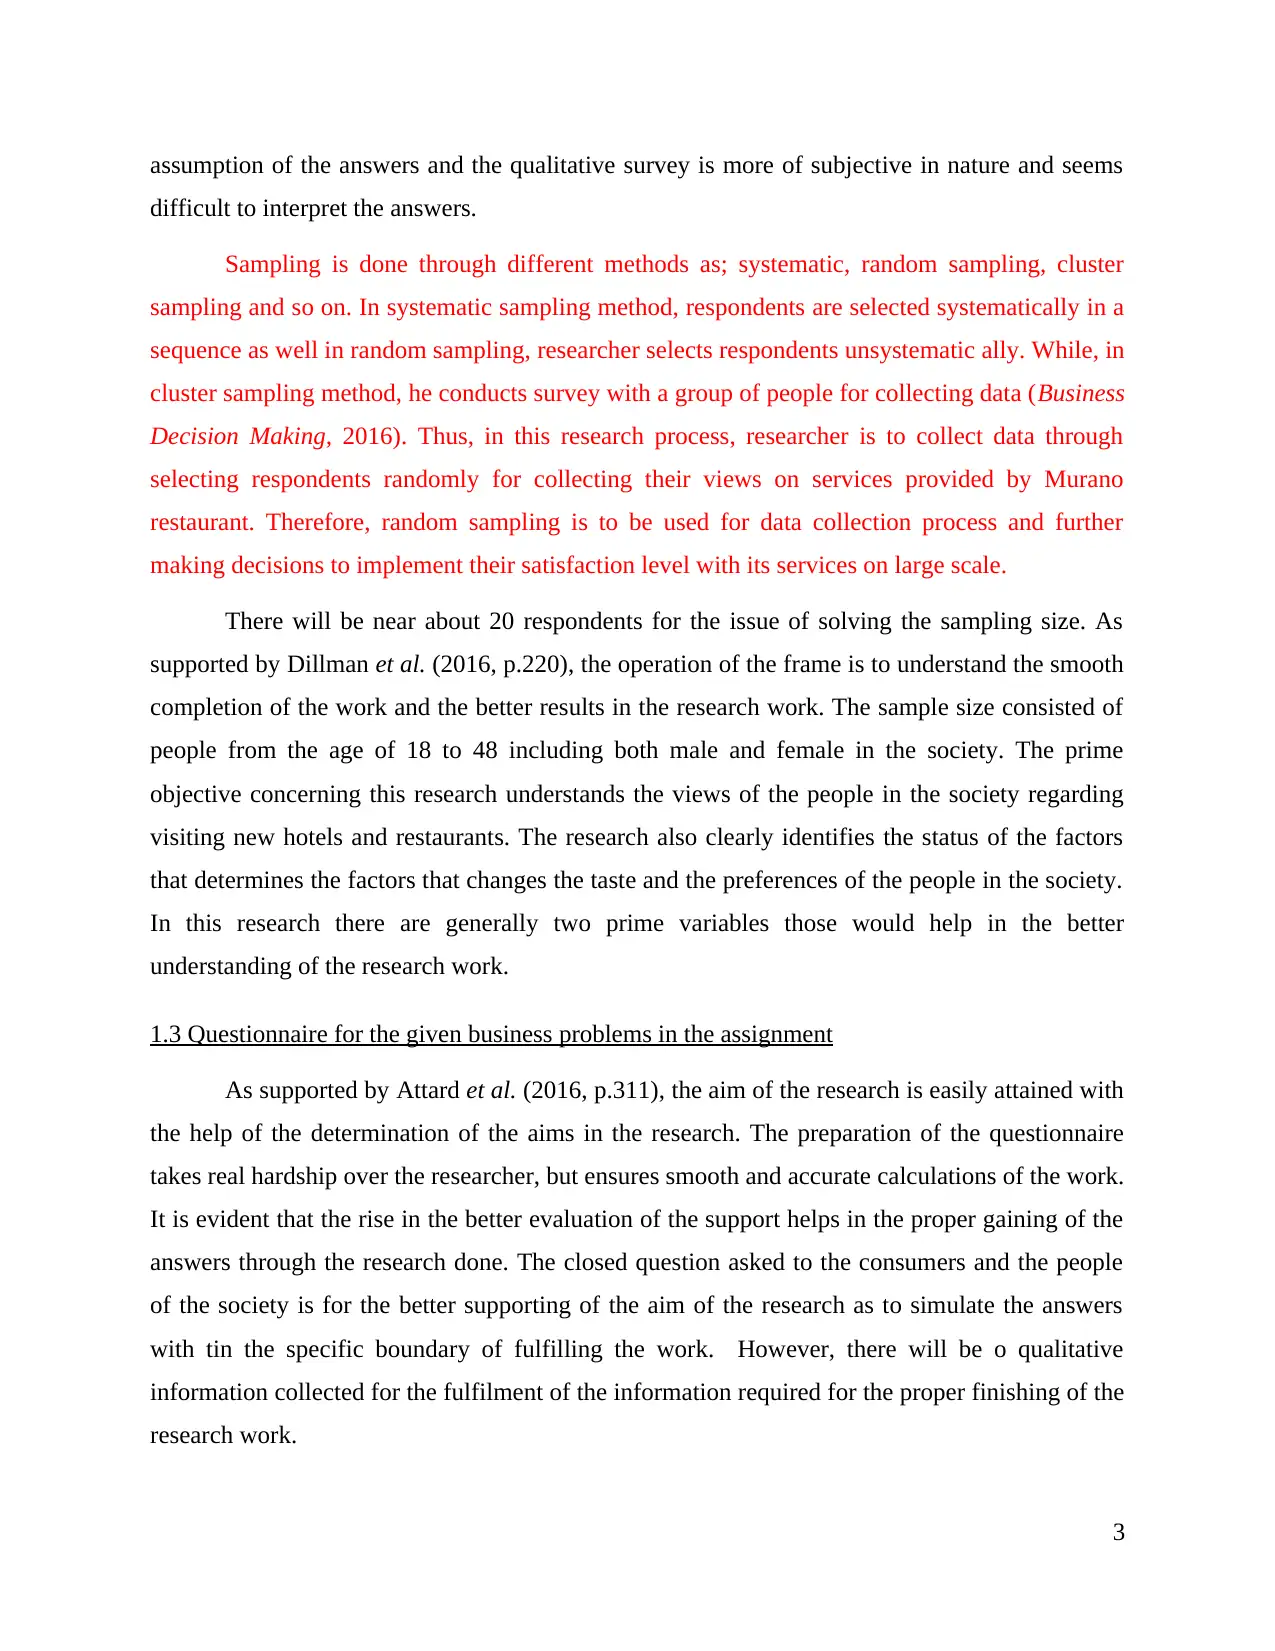
Sampling is done through different methods as; systematic, random sampling, cluster
sampling and so on. In systematic sampling method, respondents are selected systematically in a
sequence as well in random sampling, researcher selects respondents unsystematic ally. While, in
cluster sampling method, he conducts survey with a group of people for collecting data (Business
Decision Making, 2016). Thus, in this research process, researcher is to collect data through
selecting respondents randomly for collecting their views on services provided by Murano
restaurant. Therefore, random sampling is to be used for data collection process and further
making decisions to implement their satisfaction level with its services on large scale.
There will be near about 20 respondents for the issue of solving the sampling size. As
supported by Dillman et al. (2016, p.220), the operation of the frame is to understand the smooth
completion of the work and the better results in the research work. The sample size consisted of
people from the age of 18 to 48 including both male and female in the society. The prime
objective concerning this research understands the views of the people in the society regarding
visiting new hotels and restaurants. The research also clearly identifies the status of the factors
that determines the factors that changes the taste and the preferences of the people in the society.
In this research there are generally two prime variables those would help in the better
understanding of the research work.
1.3 Questionnaire for the given business problems in the assignment
As supported by Attard et al. (2016, p.311), the aim of the research is easily attained with
the help of the determination of the aims in the research. The preparation of the questionnaire
takes real hardship over the researcher, but ensures smooth and accurate calculations of the work.
It is evident that the rise in the better evaluation of the support helps in the proper gaining of the
answers through the research done. The closed question asked to the consumers and the people
of the society is for the better supporting of the aim of the research as to simulate the answers
with tin the specific boundary of fulfilling the work. However, there will be o qualitative
information collected for the fulfilment of the information required for the proper finishing of the
research work.
3
difficult to interpret the answers.
Sampling is done through different methods as; systematic, random sampling, cluster
sampling and so on. In systematic sampling method, respondents are selected systematically in a
sequence as well in random sampling, researcher selects respondents unsystematic ally. While, in
cluster sampling method, he conducts survey with a group of people for collecting data (Business
Decision Making, 2016). Thus, in this research process, researcher is to collect data through
selecting respondents randomly for collecting their views on services provided by Murano
restaurant. Therefore, random sampling is to be used for data collection process and further
making decisions to implement their satisfaction level with its services on large scale.
There will be near about 20 respondents for the issue of solving the sampling size. As
supported by Dillman et al. (2016, p.220), the operation of the frame is to understand the smooth
completion of the work and the better results in the research work. The sample size consisted of
people from the age of 18 to 48 including both male and female in the society. The prime
objective concerning this research understands the views of the people in the society regarding
visiting new hotels and restaurants. The research also clearly identifies the status of the factors
that determines the factors that changes the taste and the preferences of the people in the society.
In this research there are generally two prime variables those would help in the better
understanding of the research work.
1.3 Questionnaire for the given business problems in the assignment
As supported by Attard et al. (2016, p.311), the aim of the research is easily attained with
the help of the determination of the aims in the research. The preparation of the questionnaire
takes real hardship over the researcher, but ensures smooth and accurate calculations of the work.
It is evident that the rise in the better evaluation of the support helps in the proper gaining of the
answers through the research done. The closed question asked to the consumers and the people
of the society is for the better supporting of the aim of the research as to simulate the answers
with tin the specific boundary of fulfilling the work. However, there will be o qualitative
information collected for the fulfilment of the information required for the proper finishing of the
research work.
3
Paraphrase This Document
Need a fresh take? Get an instant paraphrase of this document with our AI Paraphraser
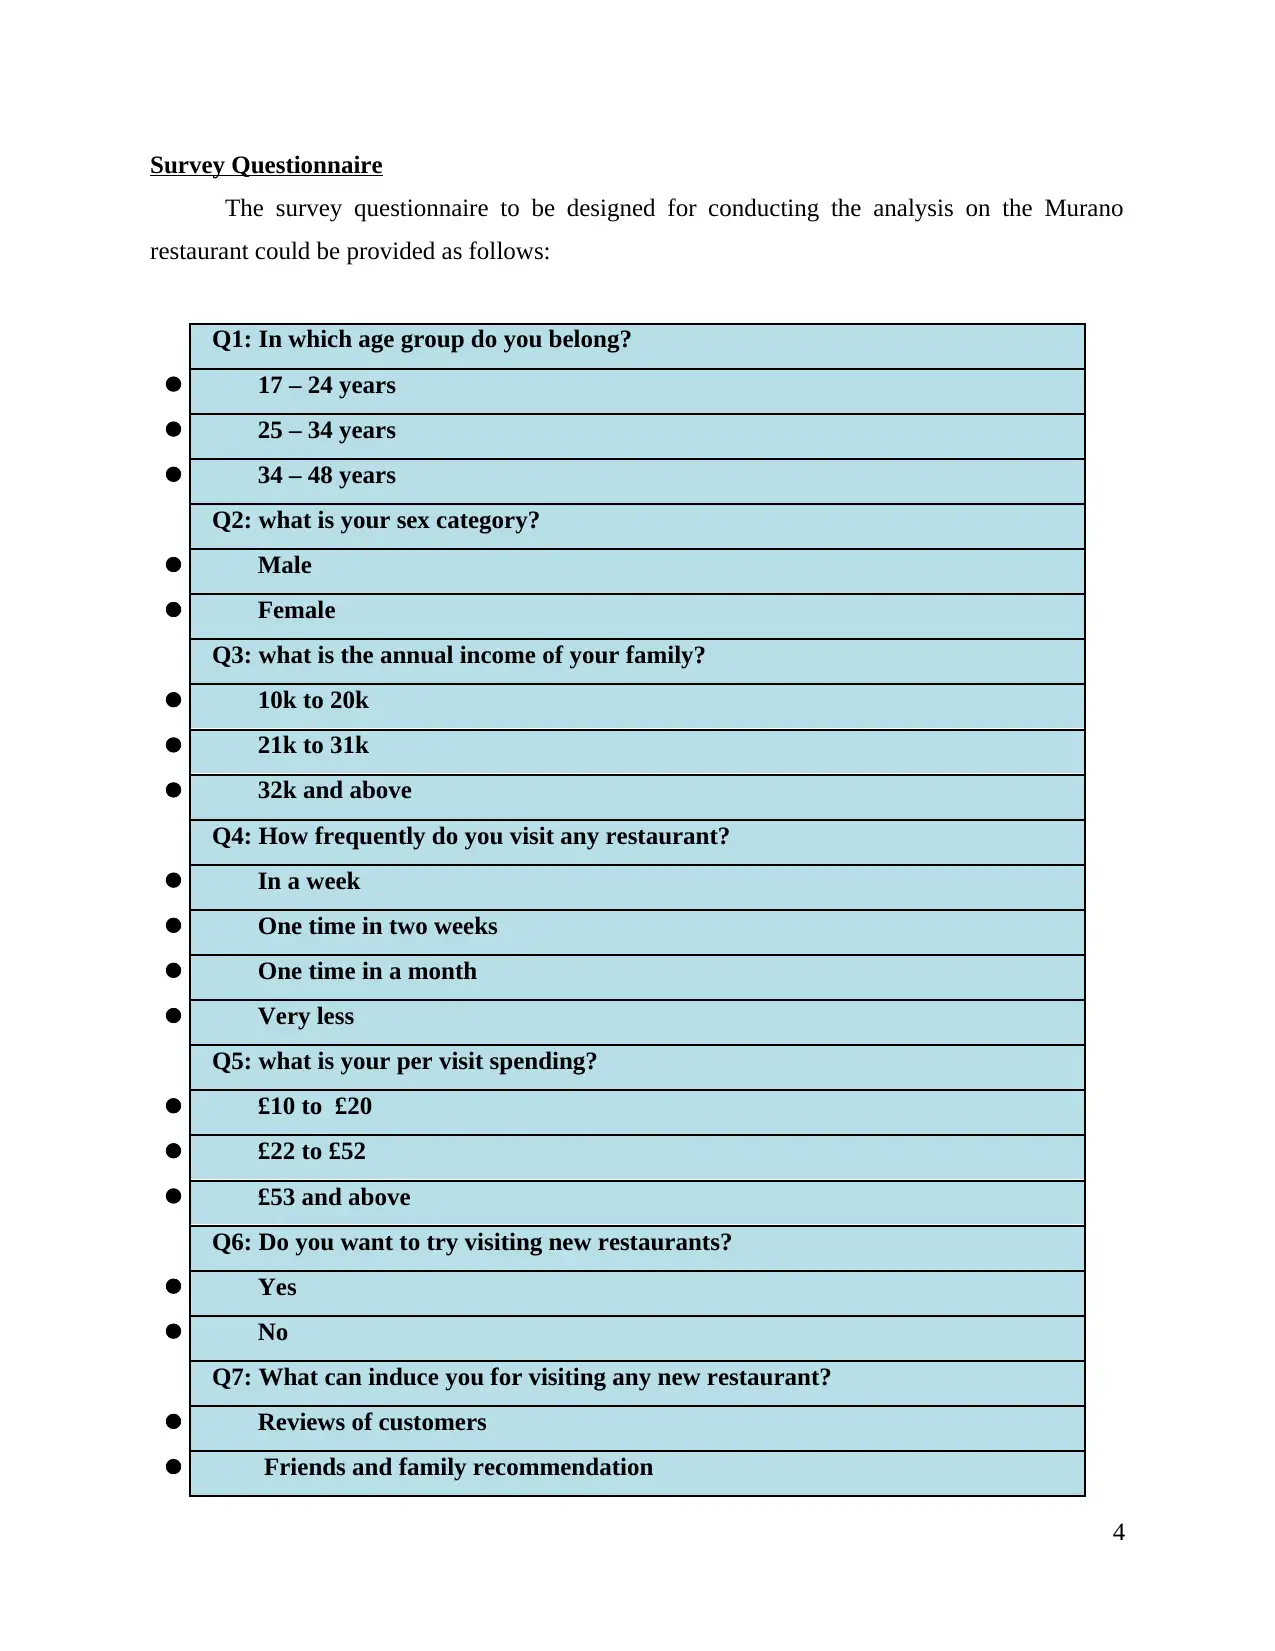
Survey Questionnaire
The survey questionnaire to be designed for conducting the analysis on the Murano
restaurant could be provided as follows:
Q1: In which age group do you belong?
17 – 24 years
25 – 34 years
34 – 48 years
Q2: what is your sex category?
Male
Female
Q3: what is the annual income of your family?
10k to 20k
21k to 31k
32k and above
Q4: How frequently do you visit any restaurant?
In a week
One time in two weeks
One time in a month
Very less
Q5: what is your per visit spending?
£10 to £20
£22 to £52
£53 and above
Q6: Do you want to try visiting new restaurants?
Yes
No
Q7: What can induce you for visiting any new restaurant?
Reviews of customers
Friends and family recommendation
4
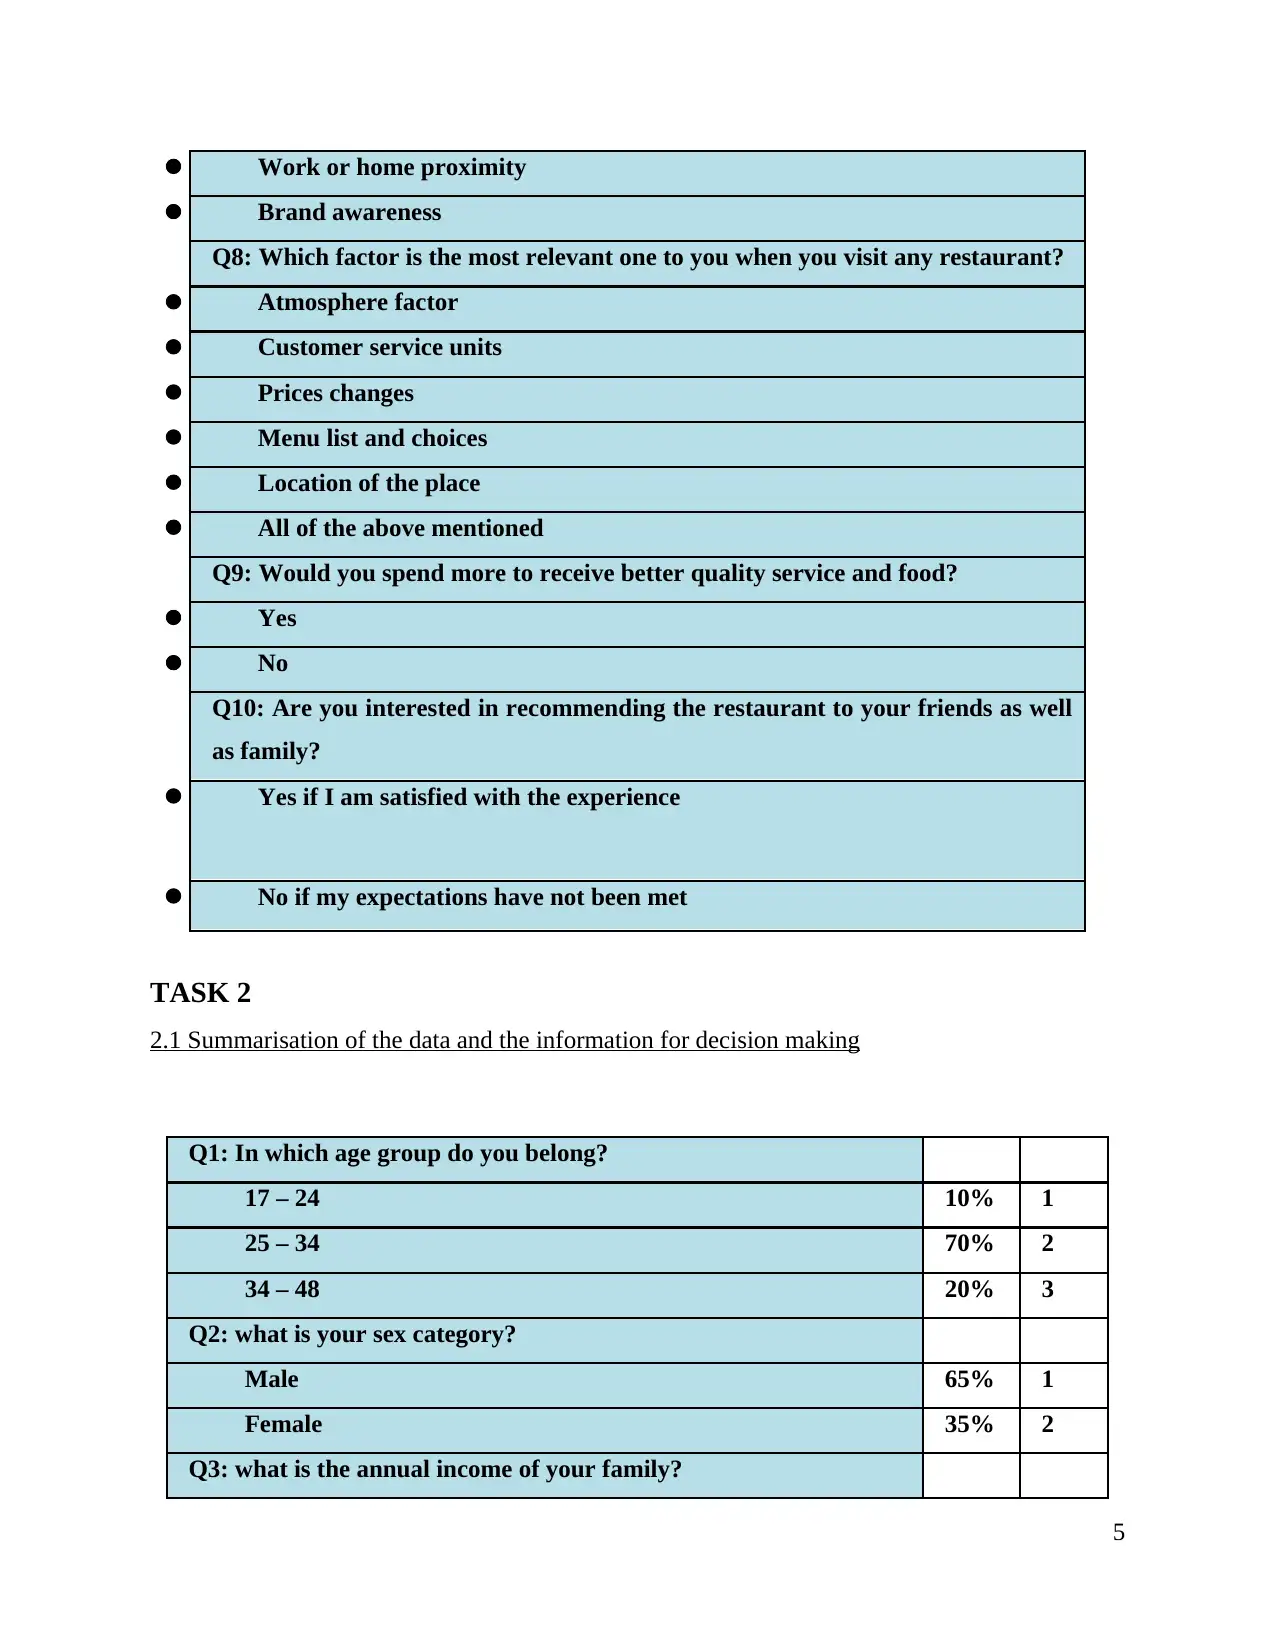
Work or home proximity
Brand awareness
Q8: Which factor is the most relevant one to you when you visit any restaurant?
Atmosphere factor
Customer service units
Prices changes
Menu list and choices
Location of the place
All of the above mentioned
Q9: Would you spend more to receive better quality service and food?
Yes
No
Q10: Are you interested in recommending the restaurant to your friends as well
as family?
Yes if I am satisfied with the experience
No if my expectations have not been met
TASK 2
2.1 Summarisation of the data and the information for decision making
Q1: In which age group do you belong?
17 – 24 10% 1
25 – 34 70% 2
34 – 48 20% 3
Q2: what is your sex category?
Male 65% 1
Female 35% 2
Q3: what is the annual income of your family?
5
⊘ This is a preview!⊘
Do you want full access?
Subscribe today to unlock all pages.
Trusted by 1+ million students worldwide
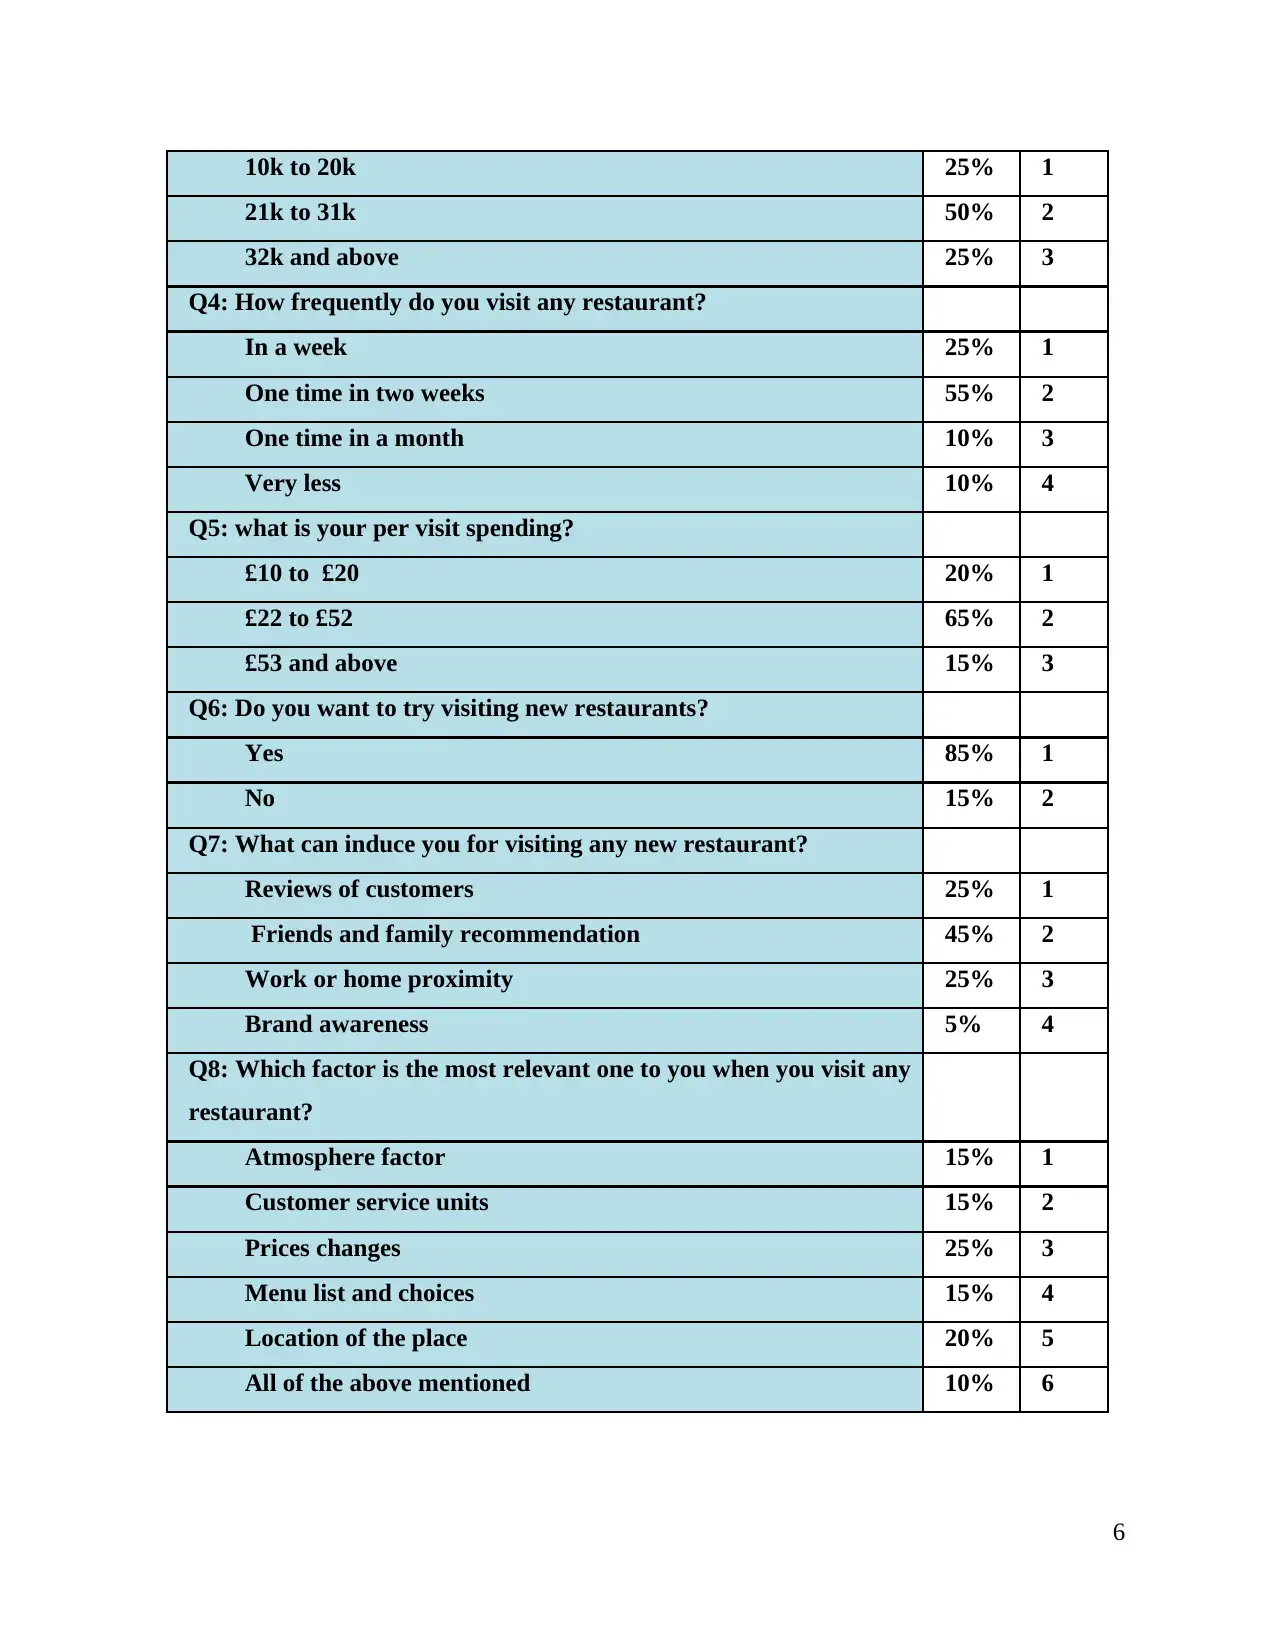
10k to 20k 25% 1
21k to 31k 50% 2
32k and above 25% 3
Q4: How frequently do you visit any restaurant?
In a week 25% 1
One time in two weeks 55% 2
One time in a month 10% 3
Very less 10% 4
Q5: what is your per visit spending?
£10 to £20 20% 1
£22 to £52 65% 2
£53 and above 15% 3
Q6: Do you want to try visiting new restaurants?
Yes 85% 1
No 15% 2
Q7: What can induce you for visiting any new restaurant?
Reviews of customers 25% 1
Friends and family recommendation 45% 2
Work or home proximity 25% 3
Brand awareness 5% 4
Q8: Which factor is the most relevant one to you when you visit any
restaurant?
Atmosphere factor 15% 1
Customer service units 15% 2
Prices changes 25% 3
Menu list and choices 15% 4
Location of the place 20% 5
All of the above mentioned 10% 6
6
Paraphrase This Document
Need a fresh take? Get an instant paraphrase of this document with our AI Paraphraser
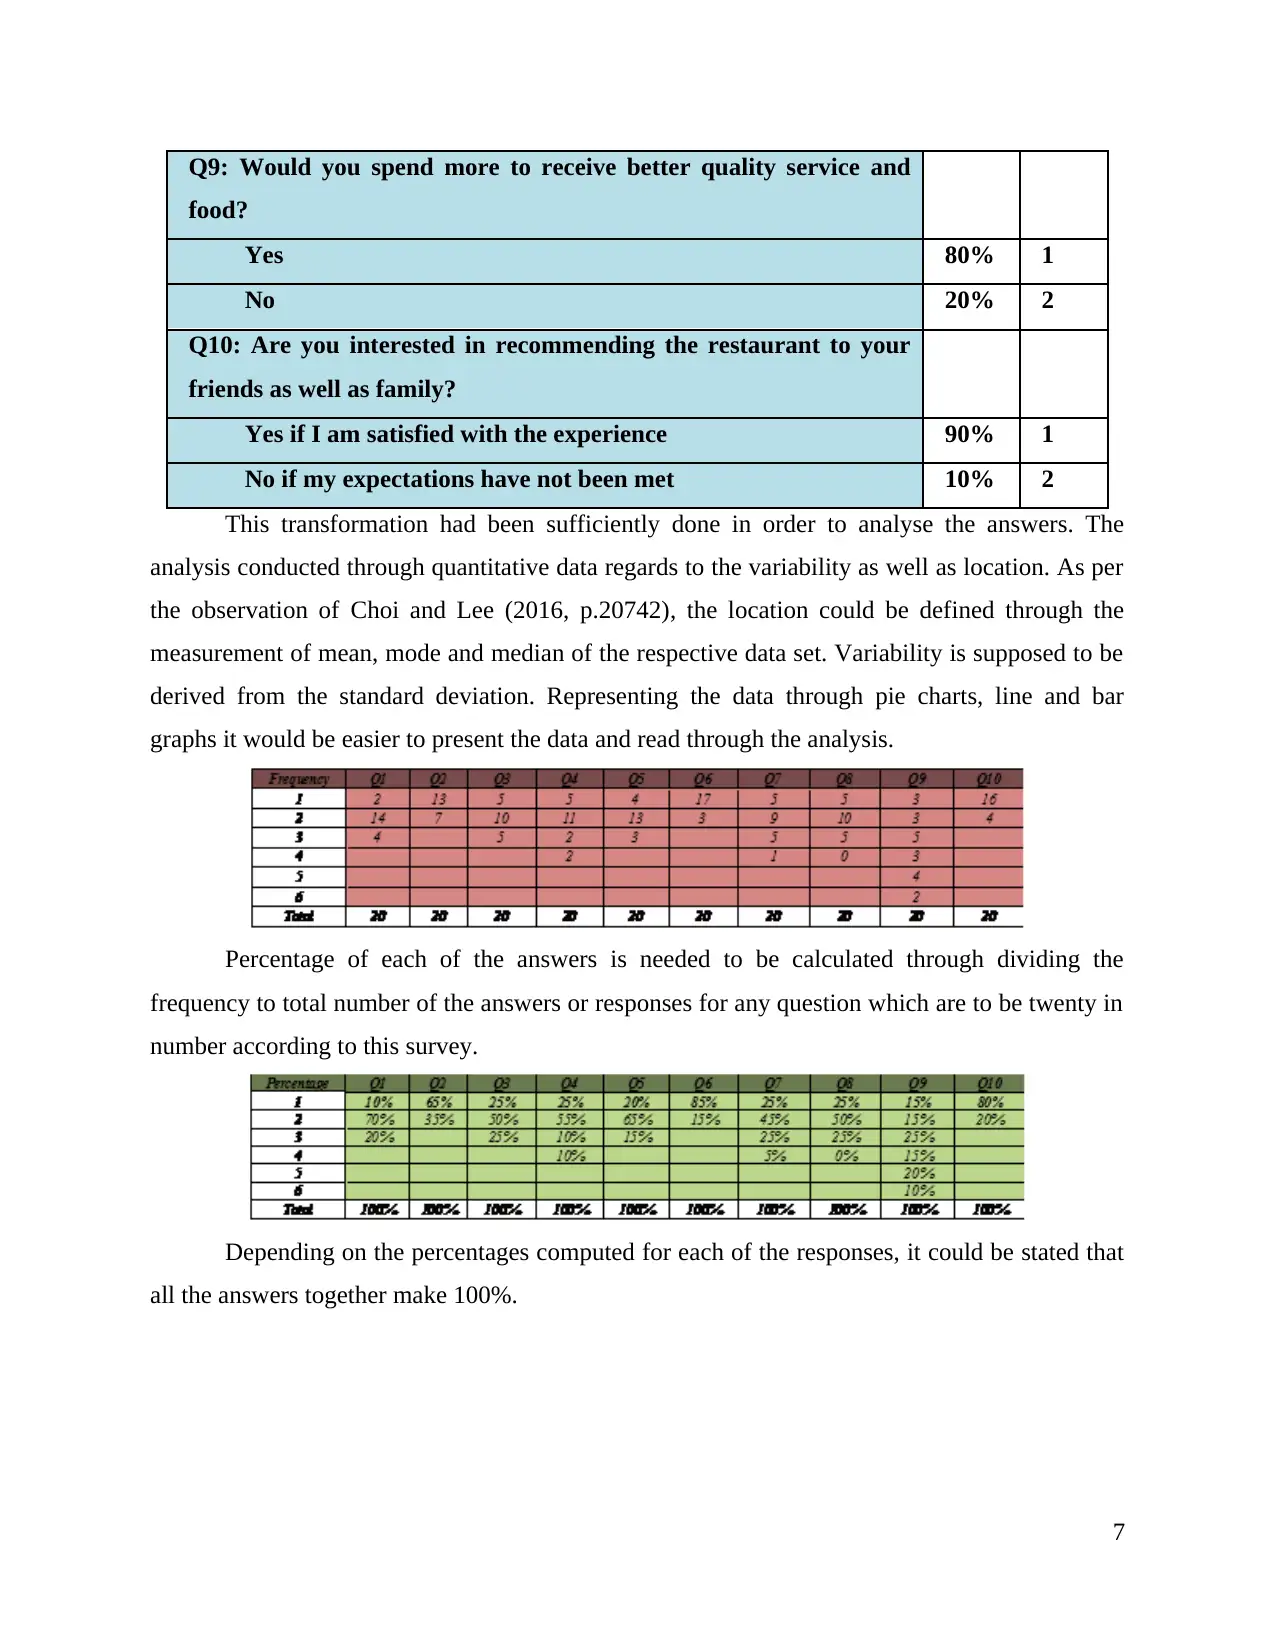
Q9: Would you spend more to receive better quality service and
food?
Yes 80% 1
No 20% 2
Q10: Are you interested in recommending the restaurant to your
friends as well as family?
Yes if I am satisfied with the experience 90% 1
No if my expectations have not been met 10% 2
This transformation had been sufficiently done in order to analyse the answers. The
analysis conducted through quantitative data regards to the variability as well as location. As per
the observation of Choi and Lee (2016, p.20742), the location could be defined through the
measurement of mean, mode and median of the respective data set. Variability is supposed to be
derived from the standard deviation. Representing the data through pie charts, line and bar
graphs it would be easier to present the data and read through the analysis.
Percentage of each of the answers is needed to be calculated through dividing the
frequency to total number of the answers or responses for any question which are to be twenty in
number according to this survey.
Depending on the percentages computed for each of the responses, it could be stated that
all the answers together make 100%.
7
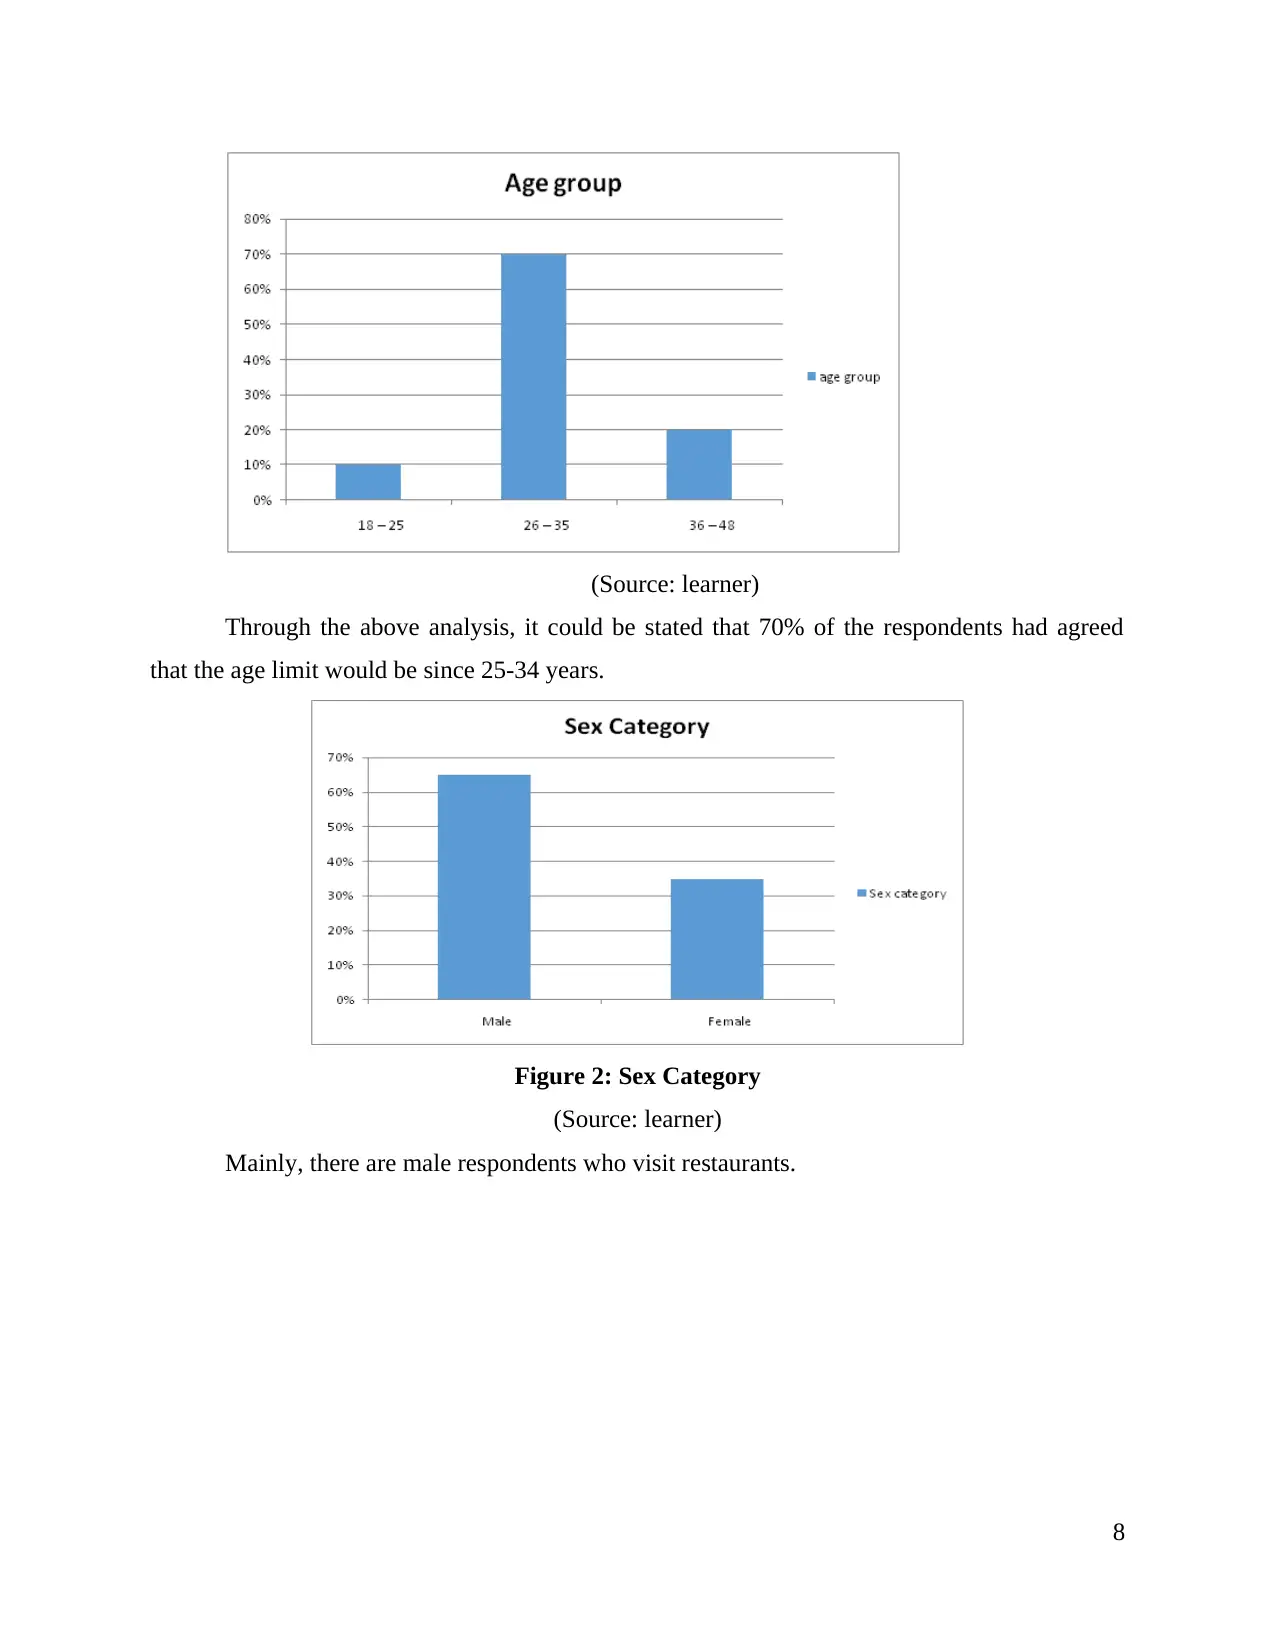
(Source: learner)
Through the above analysis, it could be stated that 70% of the respondents had agreed
that the age limit would be since 25-34 years.
Figure 2: Sex Category
(Source: learner)
Mainly, there are male respondents who visit restaurants.
8
Through the above analysis, it could be stated that 70% of the respondents had agreed
that the age limit would be since 25-34 years.
Figure 2: Sex Category
(Source: learner)
Mainly, there are male respondents who visit restaurants.
8
⊘ This is a preview!⊘
Do you want full access?
Subscribe today to unlock all pages.
Trusted by 1+ million students worldwide
1 out of 35
Related Documents


Your All-in-One AI-Powered Toolkit for Academic Success.
+13062052269
info@desklib.com
Available 24*7 on WhatsApp / Email
![[object Object]](/_next/static/media/star-bottom.7253800d.svg)
Unlock your academic potential
Copyright © 2020–2026 A2Z Services. All Rights Reserved. Developed and managed by ZUCOL.