Business Decision Making Report: F&F Restaurant Expansion in London
VerifiedAdded on 2020/07/23
|18
|3863
|58
Report
AI Summary
This report examines the business decision-making process for a restaurant chain, Food for Friends (F&F), planning to expand in London. It details the creation of primary and secondary data collection plans, including survey methodology and questionnaire design to assess customer preferences. The report summarizes primary information using thematic analysis and descriptive statistics, including mean, median, and measures of dispersion, to analyze sales and profit data from 2008 to 2017. Statistical tools such as quartiles, percentiles, and correlation coefficients are employed to aid in decision-making. Data is presented graphically to illustrate trends and forecast future performance. The report also covers the use of information processing tools, project planning, and investment appraisal techniques to support the expansion decision. The analysis reveals customer preferences, financial trends, and the importance of strategic planning for organizational growth and success, providing insights into the potential for the new restaurant unit.

Business Decision Making
Paraphrase This Document
Need a fresh take? Get an instant paraphrase of this document with our AI Paraphraser
TABLE OF CONTENTS
INTRODUCTION......................................................................................................................3
TASK 1......................................................................................................................................3
1.1 Creating plan for primary and secondary data collection plan........................................3
1.2 Assessing survey methodology and sampling frame.......................................................4
1.3 Designing questionnaire for survey.................................................................................4
TASK 2......................................................................................................................................7
2.1 Summarizing primary information for the purpose of decision making..........................7
2.2 Descriptive statistics.........................................................................................................8
2.3 Measures of dispersion.....................................................................................................9
2.4 Use of statistical tools in decision making.....................................................................10
3.1 Presenting data set in a graphical format.......................................................................11
3.2 Creating trend line for future forecasting.......................................................................12
3.3 Delivering findings using software................................................................................12
3.4 Formal business report...................................................................................................12
TASK 3....................................................................................................................................13
4.1 Information processing tools and decision making........................................................13
4.2 Project plan and network diagram..................................................................................14
4.3 Use of investment appraisal techniques in the decision making process.......................15
CONCLUSION........................................................................................................................16
REFERENCES.........................................................................................................................18

⊘ This is a preview!⊘
Do you want full access?
Subscribe today to unlock all pages.
Trusted by 1+ million students worldwide
INTRODUCTION
Decision making is the key and vital part of the business unit which ensures its
growth as well as success. Now, for enhancing customer base and attaining high margin firm
is required to make focus on exploring business operations as well as functions. Further,
London is recognized as the most attracting city in the world. Now, it becomes the hub for
professionals, students, local and international tourist. Hence, considering overall trend of
market and current business performance Food for Friends is planning to establish another
unit in London. In this, report will entail the manner through which responses of customers
and other information gathered before the opening of another unit. Further, it also sheds light
on statistical tools that help in taking appropriate decisions from large data set. This report
will also provide deeper insight about the techniques of investment appraisal that aid in
taking decision regarding project selection.
TASK 1
1.1 Creating plan for primary and secondary data collection plan
Currently, existing performance of F&F is good in terms of both financial and non-
financial. Hence, now taking into account growth level or trend F&F is planning to establish
another restaurant unit in London. With the motive to get information about the attitude and
preferences of the customers F&F is laying focus on conducting research. Hence, following
plan will be followed by the researcher for primary and secondary data collection such as:
Primary data collection plan: Data which is gathered by the researcher, for the first
time, to meet research aims and objectives known as primary. There are several methods such
as observation, focus group, interview, survey etc that researcher can use for primary data
collection (Le Tran and et.al., 2017). In this, for assessing customer’s preferences towards
dinning services survey method has been selected by the researcher. In the next step, 30
respondents have been selected on the basis of non-probabilistic technique such as purposive.
Further, survey gives suitable result only when tool associated with it such as questionnaire is
highly structured. By keeping in mind such aspect questionnaire has been designed by
including both close and open ended questions in relation to dinning mode, pricing,
promotional aspects etc. At last, by sending questionnaire on the mail-id of respondents
primary data has been collected.
Paraphrase This Document
Need a fresh take? Get an instant paraphrase of this document with our AI Paraphraser
Secondary data collection plan: It includes sources such as books, journals and
scholarly articles that previously published by other scholars on the basis of their
investigation and findings (Johnston, 2017). Hence, to evaluate the trend of restaurant sector,
customer’s intention and their decision making aspects related books, journals and articles
have been evaluated by the researcher. Along with this, for analyzing future trend or pattern,
on the basis of current performance, data pertaining to sales and profit margin has been
gathered by the researcher from the administration or financial department.
1.2 Assessing survey methodology and sampling frame
Survey methodology
This implies for the process which will be undertaken by the researcher for
conducting survey (Zakharov and et.al., 2017). Out of several available methods, online
survey methodology has been chosen by the scholar. In accordance with such tool or
methodology, primarily emphasis will be placed on acquiring mail-id’s of respondents from
existing restaurant unit. Thereafter, considering research objective questionnaire will be
designed by including questions regarding product, price, place and promotion. Once
questionnaire has been prepared then the same will be sent on the mail-id of potential
respondents. Hence, by following such structured process survey will be initiated by the
scholar.
Sampling frame
Sample selection is highly required when researcher takes decision in relation to
conducting survey for determining suitable solution of the problem. Moreover, due to lacking
enough resources it is not possible for the researcher to conduct study on large population.
Thus, by taking into account either probabilistic or non-probabilistic techniques scholar can
select sample for the investigation purpose (Ary and et.al., 2018). Hence, using purposive
sampling technique 30 customers of F&F has been selected by the researcher. This sampling
is the part of non-probabilistic technique which in turn highly suits to the qualitative
investigation type. Hence, as per the research purpose both existing and potential customers
have been selected for survey.
1.3 Designing questionnaire for survey
Questionnaire
Demographic information
Name......
Age.........
Gender.......
Income.........
1. Do you visit F&F more frequently?
Yes ()
No ()
2. Which kind of food do you like most?
Italian ()
Continental ()
British ()
South Indian ()
Chinese ()
3. What is your preference in relation to visiting restaurant in terms of time?
Breakfast ()
Lunch ()
Dinner ()
4. Which kind of dining rooms would you prefer the most?
Private ()
Casual ()
Formal ()
Relaxing environment ()
5. Do you agree that hot and fresh food is served by F&F?
Agree ()
Strongly agree ()
Neutral ()
Disagree ()
⊘ This is a preview!⊘
Do you want full access?
Subscribe today to unlock all pages.
Trusted by 1+ million students worldwide
Strongly disagree ()
6. Do you agree that in F&F waiting time is less pertaining to taking order and serving food?
Yes ()
No ()
7. Are you satisfied from the service staff of F&F?
Satisfied ()
Highly satisfied ()
Neither satisfied nor dissatisfied ()
Dissatisfied ()
Highly dissatisfied ()
8. Do you agree that dinning services of F&F are cost effective and offers high value of
money?
Agree ()
Strongly agree ()
Neutral ()
Disagree ()
Strongly disagree ()
9. From the following list which restaurant unit is highly preferred by you?
Food for Friends ()
Balti palace ()
Murano ()
Blackfrias ()
Others.....kindly specify
10. Which kind of advertisement mode aware you regarding the food or dinning services
offering by the restaurant unit?
Newspaper ()
Aids on local television ()
Facebook ()
Twitter ()
Paraphrase This Document
Need a fresh take? Get an instant paraphrase of this document with our AI Paraphraser
Others..... (kindly specify)
11. Kindly specify location which you prefer to the most while taking decision in relation to
visiting restaurant.......................................
12. Do you want to make any changes or improvements in the existing dinning
services........Kindly specify with the reasons if any
TASK 2
2.1 Summarizing primary information for the purpose of decision making
Thematic analysis
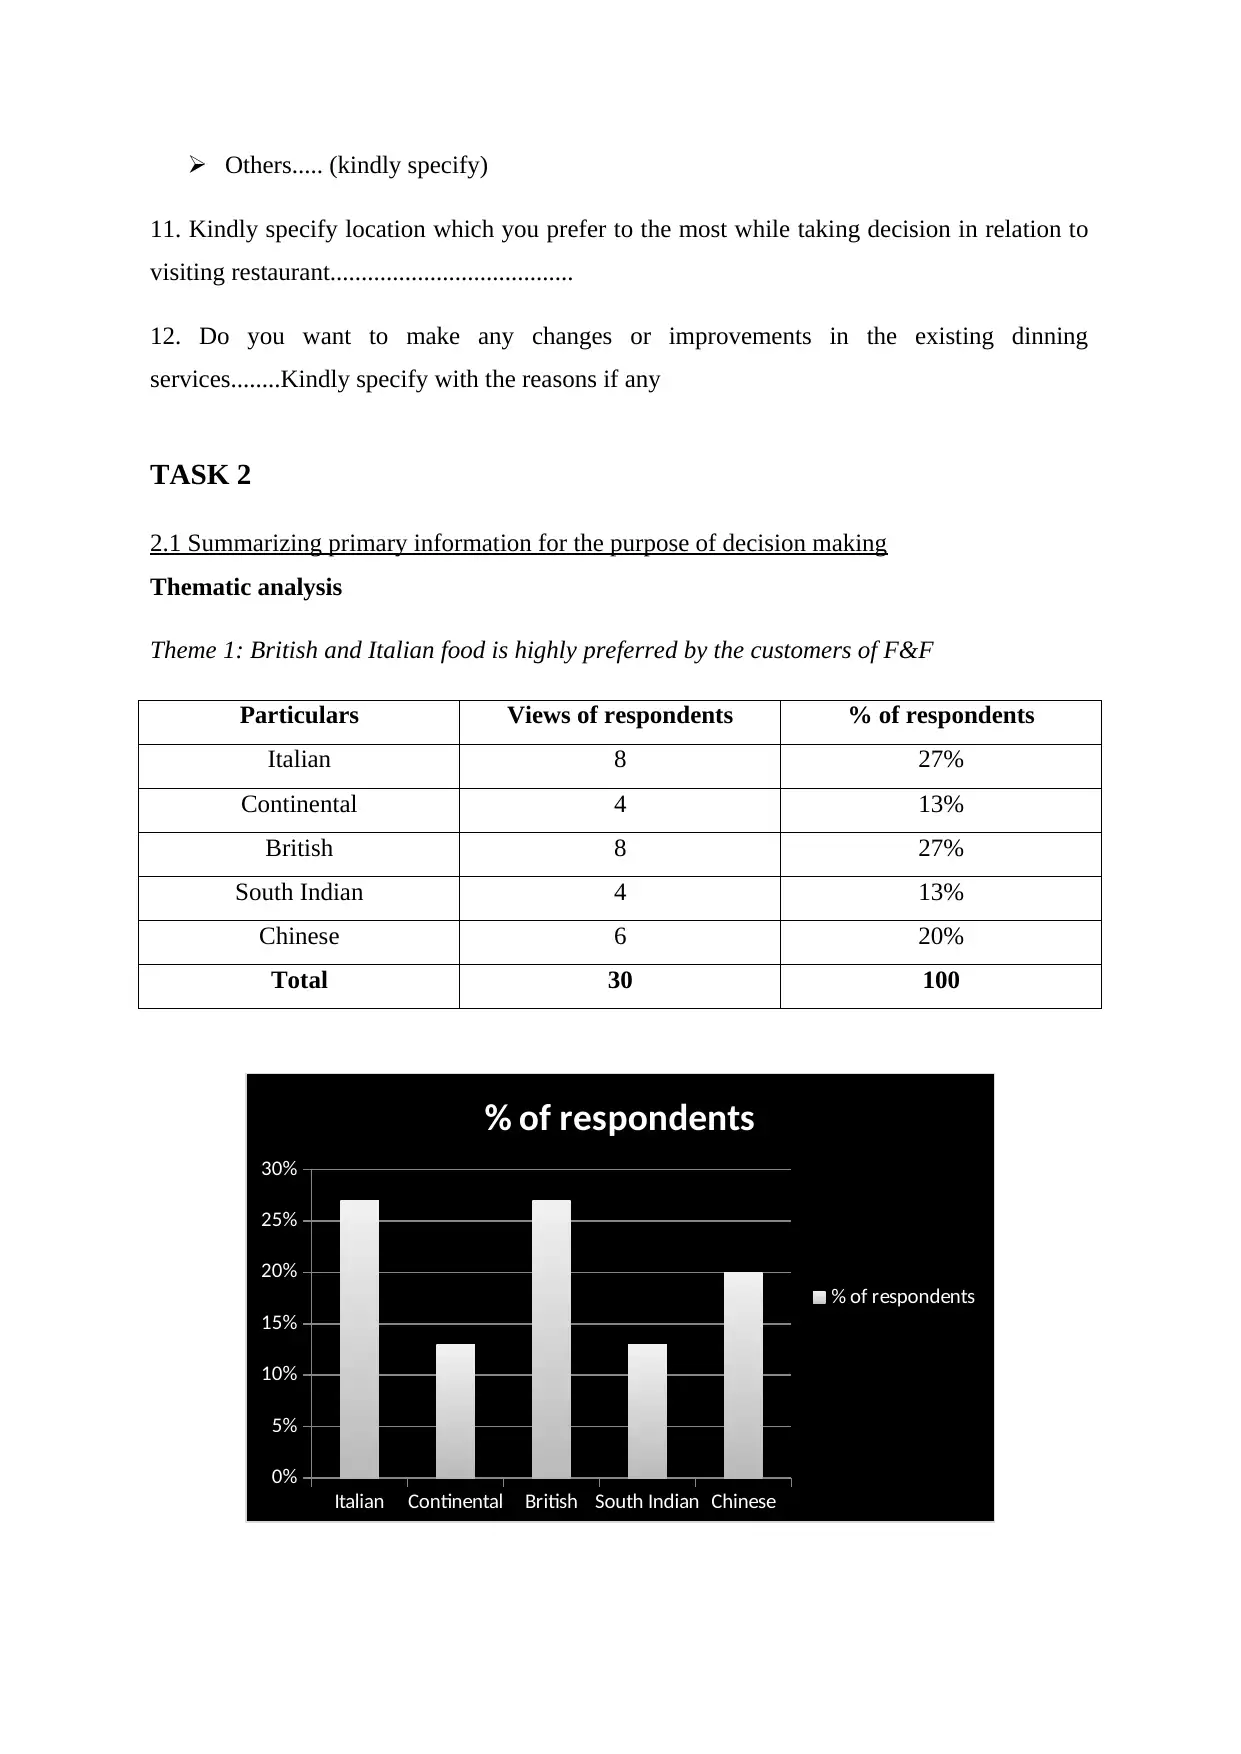
Theme 1: British and Italian food is highly preferred by the customers of F&F
Particulars Views of respondents % of respondents
Italian 8 27%
Continental 4 13%
British 8 27%
South Indian 4 13%
Chinese 6 20%
Total 30 100
Italian Continental British South Indian Chinese
0%
5%
10%
15%
20%
25%
30%
% of respondents
% of respondents
11. Kindly specify location which you prefer to the most while taking decision in relation to
visiting restaurant.......................................
12. Do you want to make any changes or improvements in the existing dinning
services........Kindly specify with the reasons if any
TASK 2
2.1 Summarizing primary information for the purpose of decision making
Thematic analysis
Theme 1: British and Italian food is highly preferred by the customers of F&F
Particulars Views of respondents % of respondents
Italian 8 27%
Continental 4 13%
British 8 27%
South Indian 4 13%
Chinese 6 20%
Total 30 100
Italian Continental British South Indian Chinese
0%
5%
10%
15%
20%
25%
30%
% of respondents
% of respondents
In survey, majority of the respondents shared their views that they like to eat British
and Italian foods. Thus, for enhancing customer base restaurant unit should focus on the
inclusion of unique dishes pertaining to such food category.
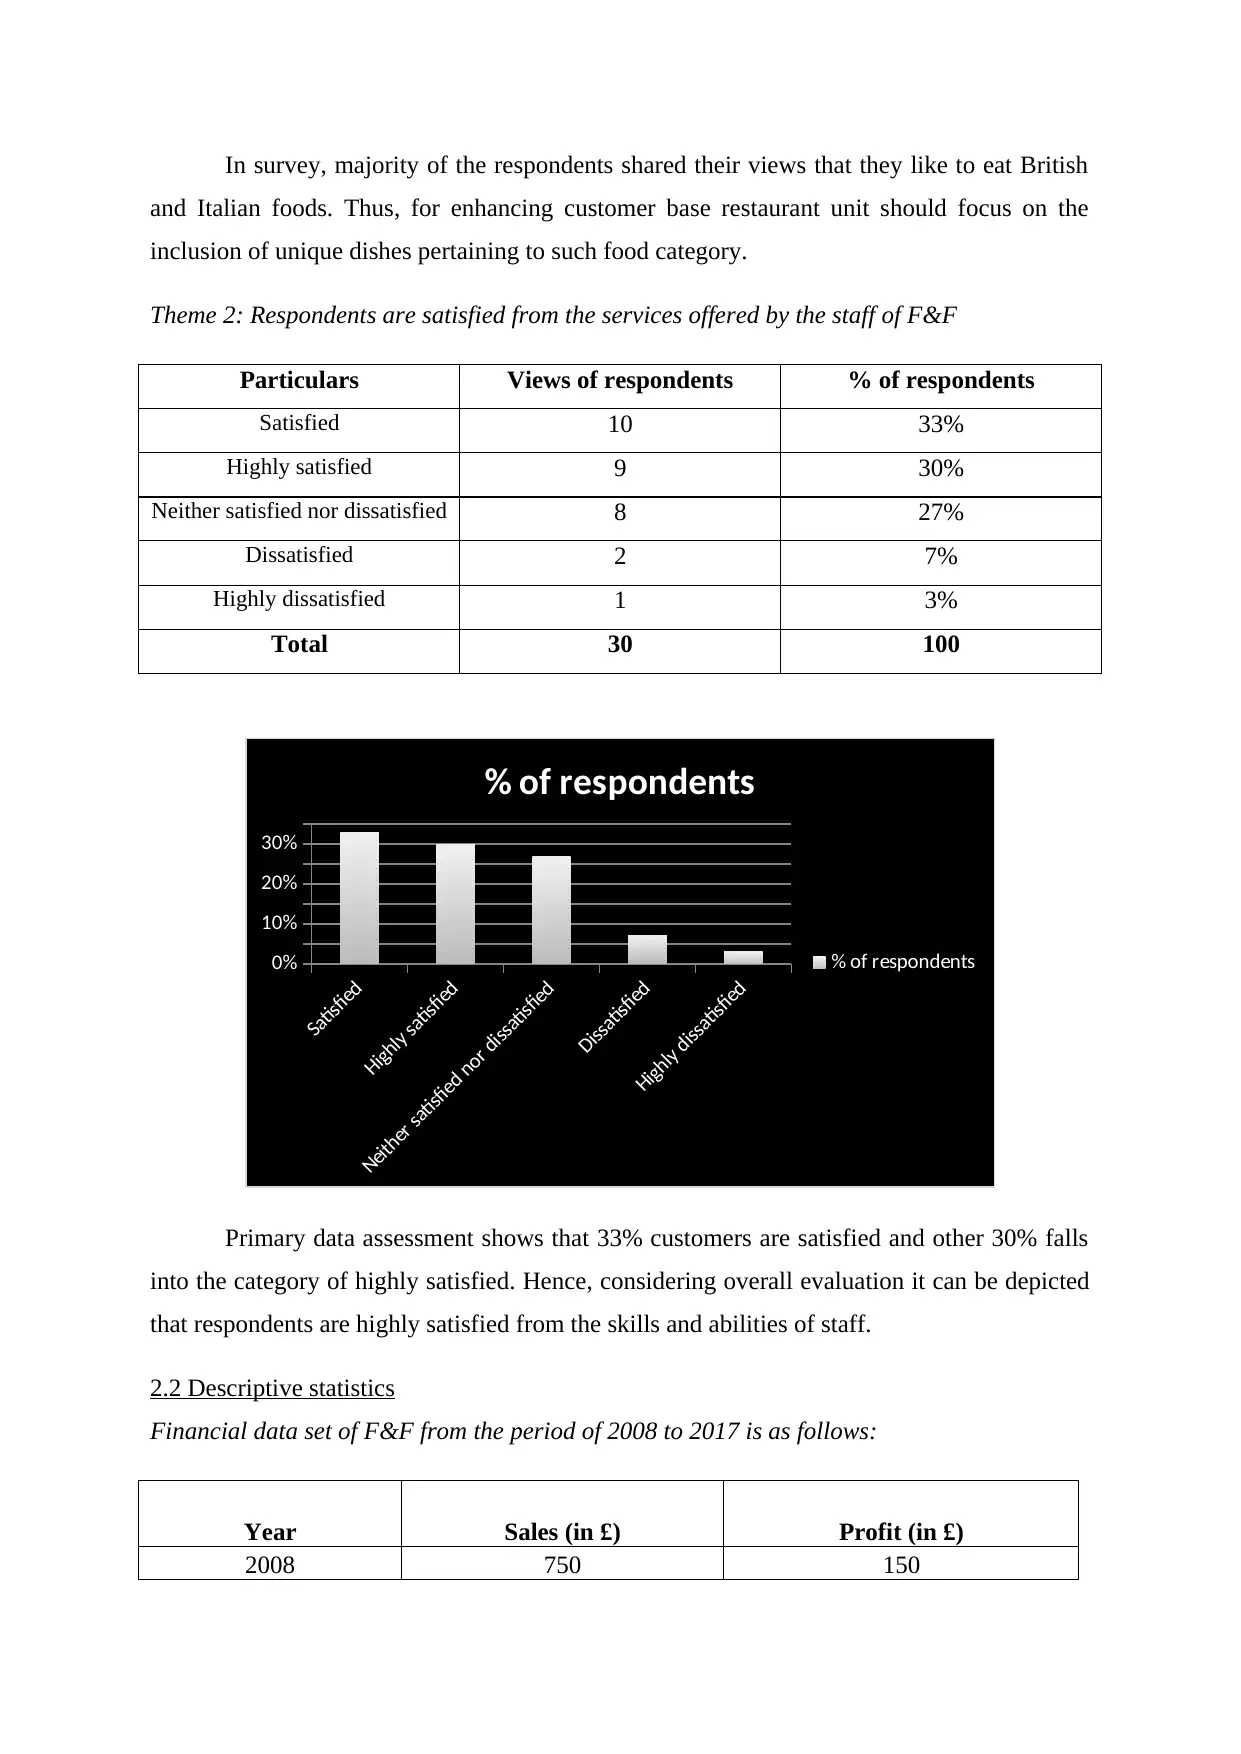
Theme 2: Respondents are satisfied from the services offered by the staff of F&F
Particulars Views of respondents % of respondents
Satisfied 10 33%
Highly satisfied 9 30%
Neither satisfied nor dissatisfied 8 27%
Dissatisfied 2 7%
Highly dissatisfied 1 3%
Total 30 100
Satisfied
Highly satisfied
Neither satisfied nor dissatisfied
Dissatisfied
Highly dissatisfied
0%
10%
20%
30%
% of respondents
% of respondents
Primary data assessment shows that 33% customers are satisfied and other 30% falls
into the category of highly satisfied. Hence, considering overall evaluation it can be depicted
that respondents are highly satisfied from the skills and abilities of staff.
2.2 Descriptive statistics
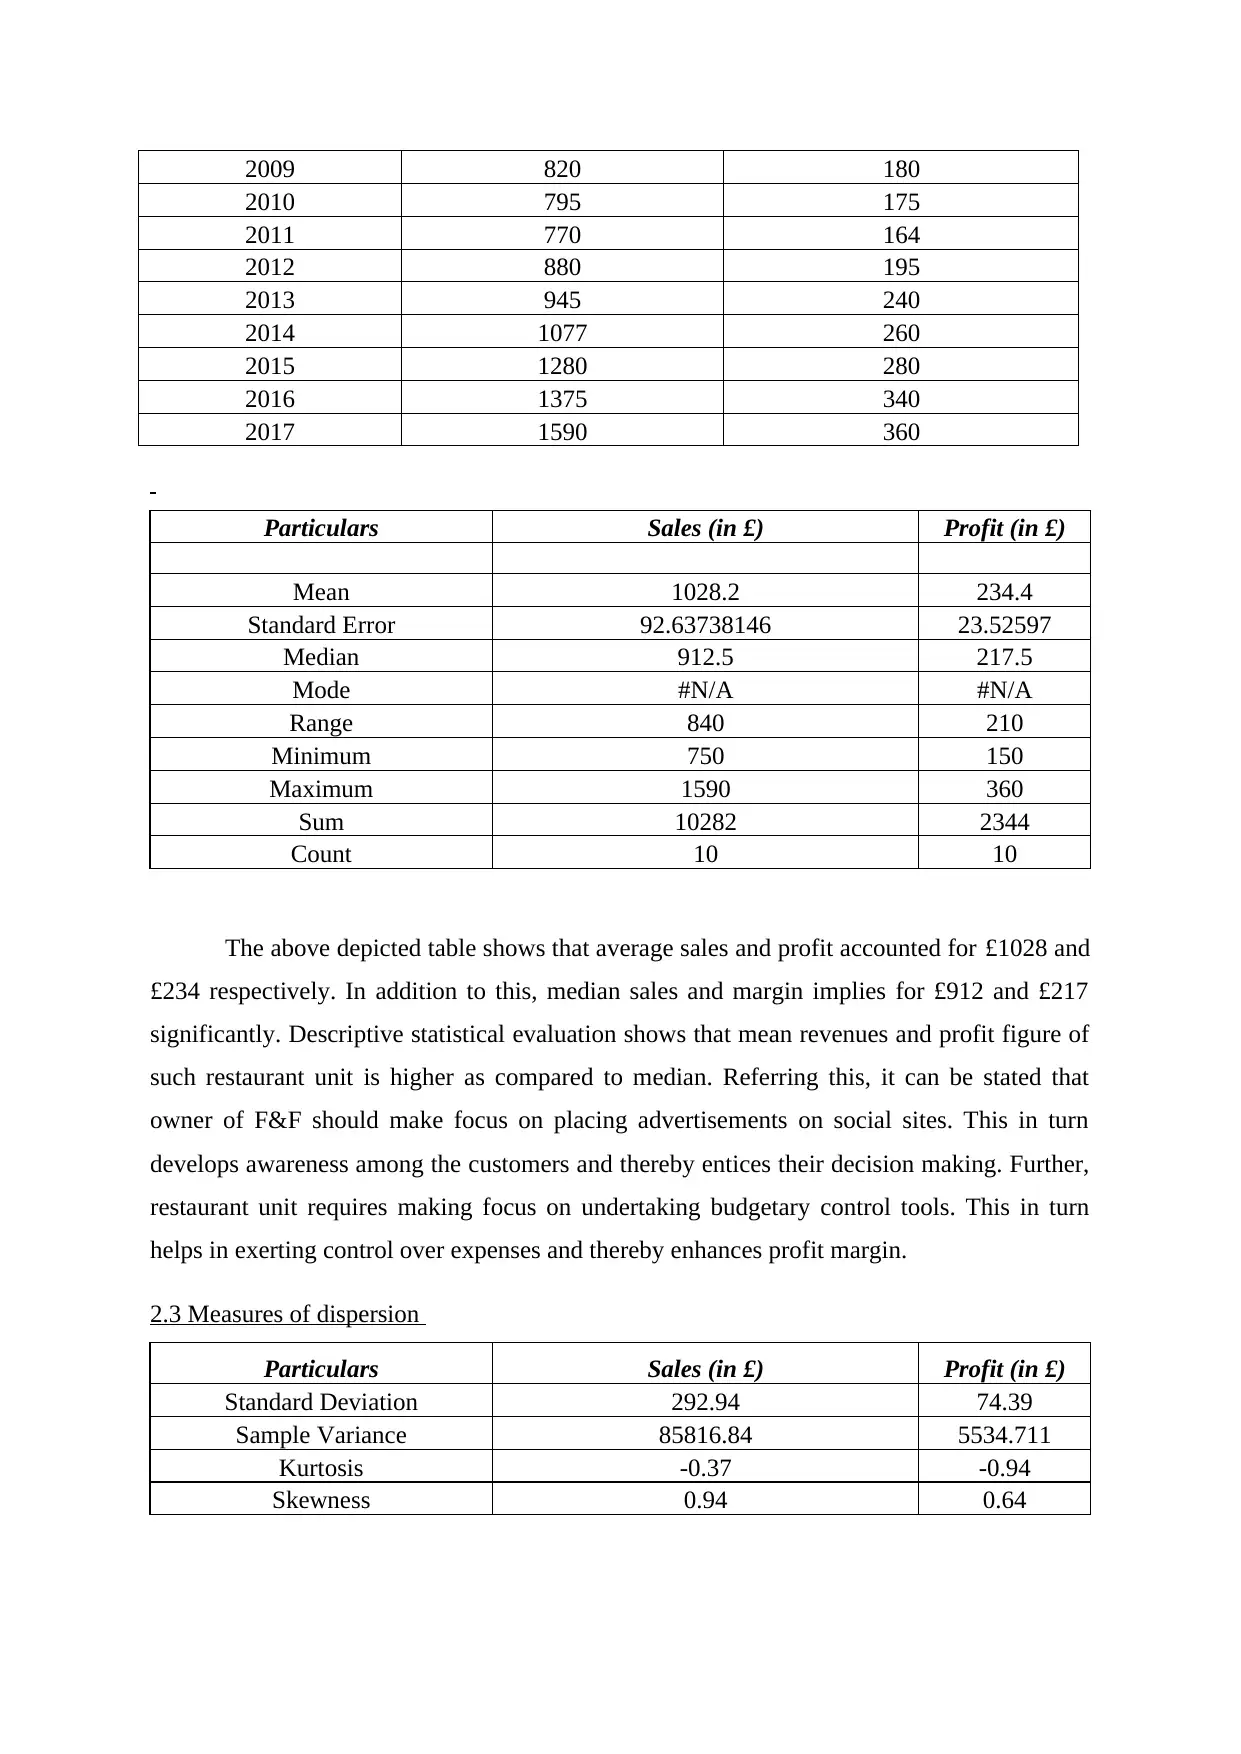
Financial data set of F&F from the period of 2008 to 2017 is as follows:
Year Sales (in £) Profit (in £)
2008 750 150
and Italian foods. Thus, for enhancing customer base restaurant unit should focus on the
inclusion of unique dishes pertaining to such food category.
Theme 2: Respondents are satisfied from the services offered by the staff of F&F
Particulars Views of respondents % of respondents
Satisfied 10 33%
Highly satisfied 9 30%
Neither satisfied nor dissatisfied 8 27%
Dissatisfied 2 7%
Highly dissatisfied 1 3%
Total 30 100
Satisfied
Highly satisfied
Neither satisfied nor dissatisfied
Dissatisfied
Highly dissatisfied
0%
10%
20%
30%
% of respondents
% of respondents
Primary data assessment shows that 33% customers are satisfied and other 30% falls
into the category of highly satisfied. Hence, considering overall evaluation it can be depicted
that respondents are highly satisfied from the skills and abilities of staff.
2.2 Descriptive statistics
Financial data set of F&F from the period of 2008 to 2017 is as follows:
Year Sales (in £) Profit (in £)
2008 750 150
⊘ This is a preview!⊘
Do you want full access?
Subscribe today to unlock all pages.
Trusted by 1+ million students worldwide
2009 820 180
2010 795 175
2011 770 164
2012 880 195
2013 945 240
2014 1077 260
2015 1280 280
2016 1375 340
2017 1590 360
Particulars Sales (in £) Profit (in £)
Mean 1028.2 234.4
Standard Error 92.63738146 23.52597
Median 912.5 217.5
Mode #N/A #N/A
Range 840 210
Minimum 750 150
Maximum 1590 360
Sum 10282 2344
Count 10 10
The above depicted table shows that average sales and profit accounted for £1028 and
£234 respectively. In addition to this, median sales and margin implies for £912 and £217
significantly. Descriptive statistical evaluation shows that mean revenues and profit figure of
such restaurant unit is higher as compared to median. Referring this, it can be stated that
owner of F&F should make focus on placing advertisements on social sites. This in turn
develops awareness among the customers and thereby entices their decision making. Further,
restaurant unit requires making focus on undertaking budgetary control tools. This in turn
helps in exerting control over expenses and thereby enhances profit margin.
2.3 Measures of dispersion
Particulars Sales (in £) Profit (in £)
Standard Deviation 292.94 74.39
Sample Variance 85816.84 5534.711
Kurtosis -0.37 -0.94
Skewness 0.94 0.64
Paraphrase This Document
Need a fresh take? Get an instant paraphrase of this document with our AI Paraphraser
Analyzing the outcome of measures of dispersion it can be presented that in the near
future mean value pertaining to sales and profit will deviate from £293 & 74 respectively.
Hence, by taking into account such results owner of F&F do strategic planning that aid in the
organizational growth and success.
2.4 Use of statistical tools in decision making
Quartile and percentile
Particulars Sales (in £) Profit (in £)
1st quartile and 25th
percentile 801.25 176.25
2nd quartile and 50th
percentile 913 217.5
3rd quartile and 75th
percentile 1229 275
Results of quartile and percentile show that a sales as well as profit margins of F&F
were increased in each quarter. However, in comparison to the 2nd quarter, under 3rd one
significant improvement was found in the sales and profit margin of F&F. Hence, increasing
trend exhibits that customers prefer to
Correlation co-efficient
Sales Profit
Sales 1 0.98
Profit 0.98 1
Statistical evaluation presents that highly positive relationship takes place between
sales and profit margin generated by the restaurant unit during the concerned period.
Correlation such as .98 entails that fluctuation which takes place in one variable has
significant impact on another in a similar tandem (Şahin and Liu, 2017). Thus, restaurant unit
should make focus on undertaking promotional campaign and offering quality services to the
customers. This in turn enhances sales and thereby profit margin to a great extent.
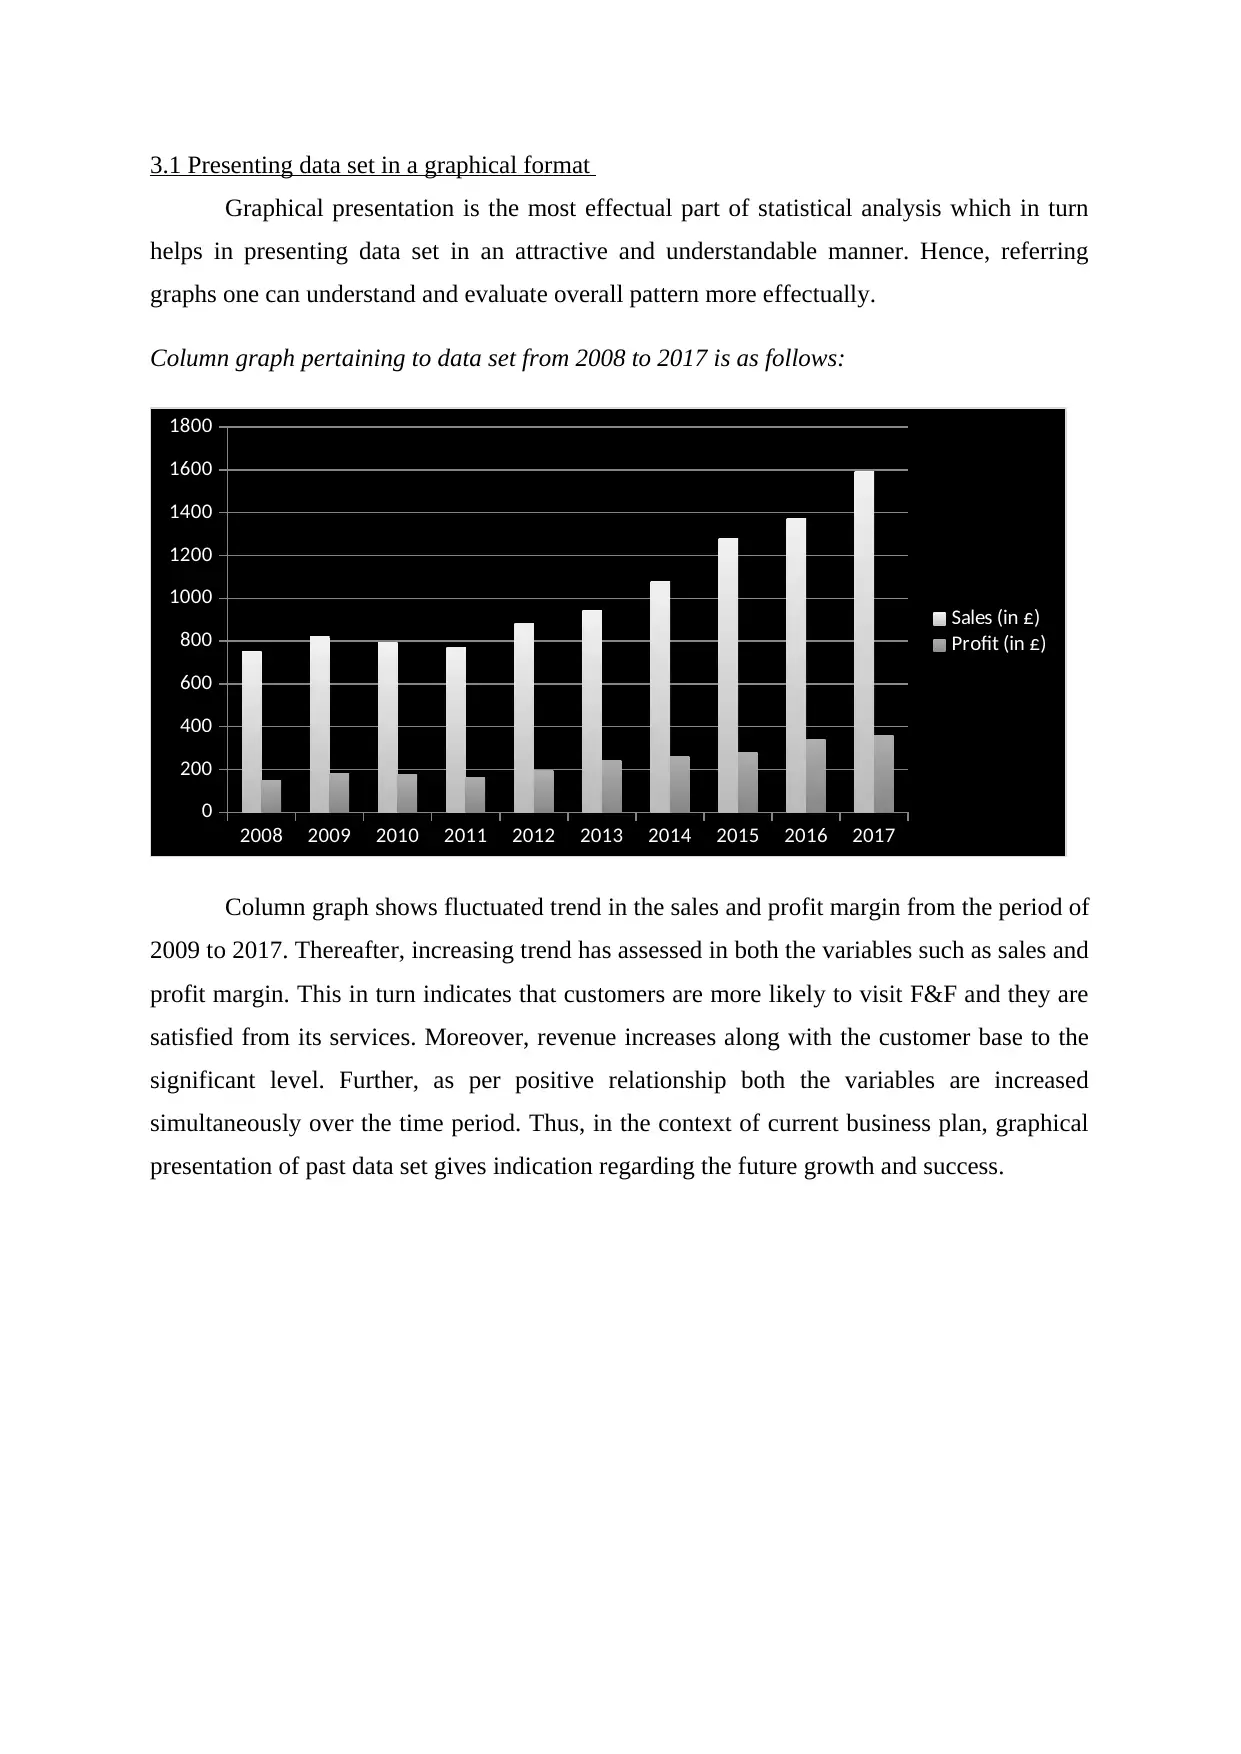
3.1 Presenting data set in a graphical format
Graphical presentation is the most effectual part of statistical analysis which in turn
helps in presenting data set in an attractive and understandable manner. Hence, referring
graphs one can understand and evaluate overall pattern more effectually.
Column graph pertaining to data set from 2008 to 2017 is as follows:
2008 2009 2010 2011 2012 2013 2014 2015 2016 2017
0
200
400
600
800
1000
1200
1400
1600
1800
Sales (in £)
Profit (in £)
Column graph shows fluctuated trend in the sales and profit margin from the period of
2009 to 2017. Thereafter, increasing trend has assessed in both the variables such as sales and
profit margin. This in turn indicates that customers are more likely to visit F&F and they are
satisfied from its services. Moreover, revenue increases along with the customer base to the
significant level. Further, as per positive relationship both the variables are increased
simultaneously over the time period. Thus, in the context of current business plan, graphical
presentation of past data set gives indication regarding the future growth and success.
⊘ This is a preview!⊘
Do you want full access?
Subscribe today to unlock all pages.
Trusted by 1+ million students worldwide
1 out of 18
Related Documents


Your All-in-One AI-Powered Toolkit for Academic Success.
+13062052269
info@desklib.com
Available 24*7 on WhatsApp / Email
![[object Object]](/_next/static/media/star-bottom.7253800d.svg)
Unlock your academic potential
Copyright © 2020–2026 A2Z Services. All Rights Reserved. Developed and managed by ZUCOL.