Business Decision Making Report: Analysis of Murano Restaurant Data
VerifiedAdded on 2020/06/05
|17
|4251
|68
Report
AI Summary
This report analyzes the business decision-making process for Murano, a UK restaurant group planning to open a new location. The report begins with a detailed plan for primary and secondary data collection, including survey methodologies, questionnaires, and sampling frames to understand consumer preferences. It then presents calculations for mean, mode, median, standard deviation, quartiles, percentiles, and correlation coefficients based on provided sales and profit data from the past ten years, offering insights into the restaurant's performance. The analysis continues with a business plan supported by graphs and spreadsheets, including trend line analysis and a business presentation. Finally, the report explores information processing and financial tools critical for effective decision-making, along with a discussion on critical path analysis, providing a comprehensive overview of the decision-making process.

BUSINESS DECISION
MAKING
MAKING
Paraphrase This Document
Need a fresh take? Get an instant paraphrase of this document with our AI Paraphraser
Table of Contents
INTRODUCTION...........................................................................................................................1
TASK 1............................................................................................................................................1
1.1 Primary and secondary data collection plan..........................................................................1
1.2 Survey methodology and sampling frame.............................................................................2
1.3 Questionnaires for data collection.........................................................................................3
2.2 Calculations for mean mode and median..............................................................................5
2.3 Calculation of standard deviation.........................................................................................6
2.4 calculation of Quartile, Percentile and correlation coefficient.............................................6
TASK 2............................................................................................................................................7
3.1 Business plan with the help of graphs and spreadsheet........................................................7
3.2 trend line in graphs................................................................................................................8
3.3 Business presentation............................................................................................................9
3.4 Formal business report..........................................................................................................9
TASK 3............................................................................................................................................9
4.1 Information processing tool..................................................................................................9
4.2 Financial tool for decision making:.....................................................................................10
4.3 critical path..........................................................................................................................13
CONCLUSION..............................................................................................................................14
REFERENCE.................................................................................................................................15
INTRODUCTION
Smooth functioning and successful running of a business requires timely good decisions
with the help of professional heads. A determination is based on the innovative ideas, knowledge
up-gradation and an effective reasoning that can be beneficial to lead the organisation.
Judgement must be made promptly and it should be very effective. Murano is the UK's leading
restaurant group and it has planned to open one more restaurant, the directors has selected a
professional team that can lead the surveys at various locations and come with the details or
information about the consumer preferences. After analysing and examine the data collected by
the employees the firm would organise meetings of top level manager, conducting seminars,
symposium and workshops. This will be fruitful in making a great business solution.
TASK 1
1.1 Primary and secondary data collection plan
The collection of adequate data is helpful in having all the knowledge regarding the
consumer preferences, choices, tastes etc. Murano group has planned to start a secondary
restaurant so it is essential for them to collect the optimum information from the market and
analyse the data to create a fruitful decisional plan as to satisfy the buyers desired demands. The
professional of the organisation should follow the various methods for fetching costumer needs:
Primary Data Collection: The data collected from the primary sources by conducting
surveys, doing observations, implementing experiments, direct communication, interviews of
individuals and from questionnaires (Daas and Arends-Tóth, 2009). Murano has to firstly collect
the primary data from various locations like doing personal interactions with the citizens to know
their preferences related to the locations, services a restaurant should facilitate, tastes and the
quality required in every meal. The primary data can be collected by these several techniques:
Daily observation must be done which related to the study about consumer behaviour,
demand in the market and new trends that are to be adopted by the organisation as to
compete with the competitors.
A professional team should be decided by the directors of the firm which can organise
personnel interview which helps in providing in depth information from various
individuals.
1
⊘ This is a preview!⊘
Do you want full access?
Subscribe today to unlock all pages.
Trusted by 1+ million students worldwide
Telephonic interaction with various individuals which very quick and reasonable in
collecting the informations.
Questionnaires to be prepared and asked to various respondents which is the best method
to collect the informations from the sources.
Secondary Data Collection: The secondary source of data collection are mainly
obtained by the social factors (Gill, and et.al. 2008). The informations can be generated with the
help of government departments like the tax records, statistics, socials security etc. Internet
surfing can also be very fruitful for making the self-observatory research. Reports of the several
organisations which has all the records of their statistical data and profit gain by them. The data
gathering can be done by the following techniques:
Governmental sources like the records of taxations, statistical information of the data etc.
Trade journals, books, magazines, articles, blogs from various writers or critics helps the
organisation to know the new changes and preferences of the consumers.
Business reports of the various entities including their annual financial statements that
shows their growth and places of where they are not performing as expectations.
1.2 Survey methodology and sampling frame
Survey methodology
To go through the quality, price and infrastructure of the restaurant or any other place one
has to go through the survey made by anybody. I give the total report about the condition and
food till the management system. It will include the certain thing in it to be considered for better
working (Loeffler, 2009). The first and the very important thing is the quality and taste of the
food serve at the Murano. In any restaurant, the food is the key element to be keep in mind. The
food being served to the people is fresh or not or the taste of the food is satisfied according to the
price they paying. The services granting to the people should be of fair means. The services liked
by the people will enforce them to come for the next time too and even refer to the other. The
very next thing for the Murano is to keep the surrounding and the infrastructure clean and
amazingly appealing which suits the people and make them feel the presence around. In
infrastructure, the total structure comes from the table to the doors, even the wash rooms and all
the things decorated on the table.
Sampling frame
2
Paraphrase This Document
Need a fresh take? Get an instant paraphrase of this document with our AI Paraphraser
The sampling is done for the comparison of the data from the earlier data what amount or
percentage of difference, growth, etc. is there in the Murano. To keep going with effective
working quality or is there is any down mark in the graph and try to figure it out how to change it
and make it better (Loeffler, 2009). Keep the record of the people coming, resting, having full
food, going empty, etc. This data help is retained the future growth and accessibility. It can be
done in many form like determining the length, making the study, analysing the past data,
observing the activities.
1.3 Questionnaires for data collection
This method of collecting data by asking several questions to individuals help in
analysing the proper demand from the market. The questions to be given are as follows:
Q.1 What factor you like most in a restaurant?
(A) Restaurant Ambience
(B) Services
(C) Quality of food
(D) Prices
Q.2 How often you visit the restaurants?
(A) Most frequently
(B) Once in a Month
(C) Occasionally
(D) Never
Q.3 What do you usually order in restaurant about meals?
(A) Fast Food
(B) Main course
(C) Desserts
(D) Beverages
Q.4 What do you usually preferred in fast food?
(A) Pizza
(B) Burger
(C) Sandwich
(D) Other
Q.5 What a restaurant should essentially facilitate?
3
(A) Air conditions
(B) Pleasant music
(C) Free Wi-Fi
(D) Good staff
Q.6 Where the restaurant should focus on improvements?
(A) Improve Food quality
(B) Motivate the worker performance
(C) Improve the environment
(D) Better services
Q.7 What should be time for serving the Lunch?
(A) Before 12 pm
(B) After 12 pm
(C) Before 1 pm
(D) After 1 pm
Q.8 What should be timing for serving Dinner?
(A) Before 8 pm
(B) After 8 pm
(C) Between 8-10 pm
(D) After 10 pm
Q.9 What a restaurant should charge?
(A) As per the quality and quantity of food
(B) As per Goodwill of the restaurant
(C) The luxury order should be charged more
(D) As per the consumer budget
Q.10 What a quality of Food should have?
(A) Excellent
(B) Better
(C) Good
(D) Normal
Q.11 What a restaurant should have other than services and food preparation?
(A) Playground for kids
4
⊘ This is a preview!⊘
Do you want full access?
Subscribe today to unlock all pages.
Trusted by 1+ million students worldwide
(B) Parking place
(C) Gaming zone
(D) Disc and Club
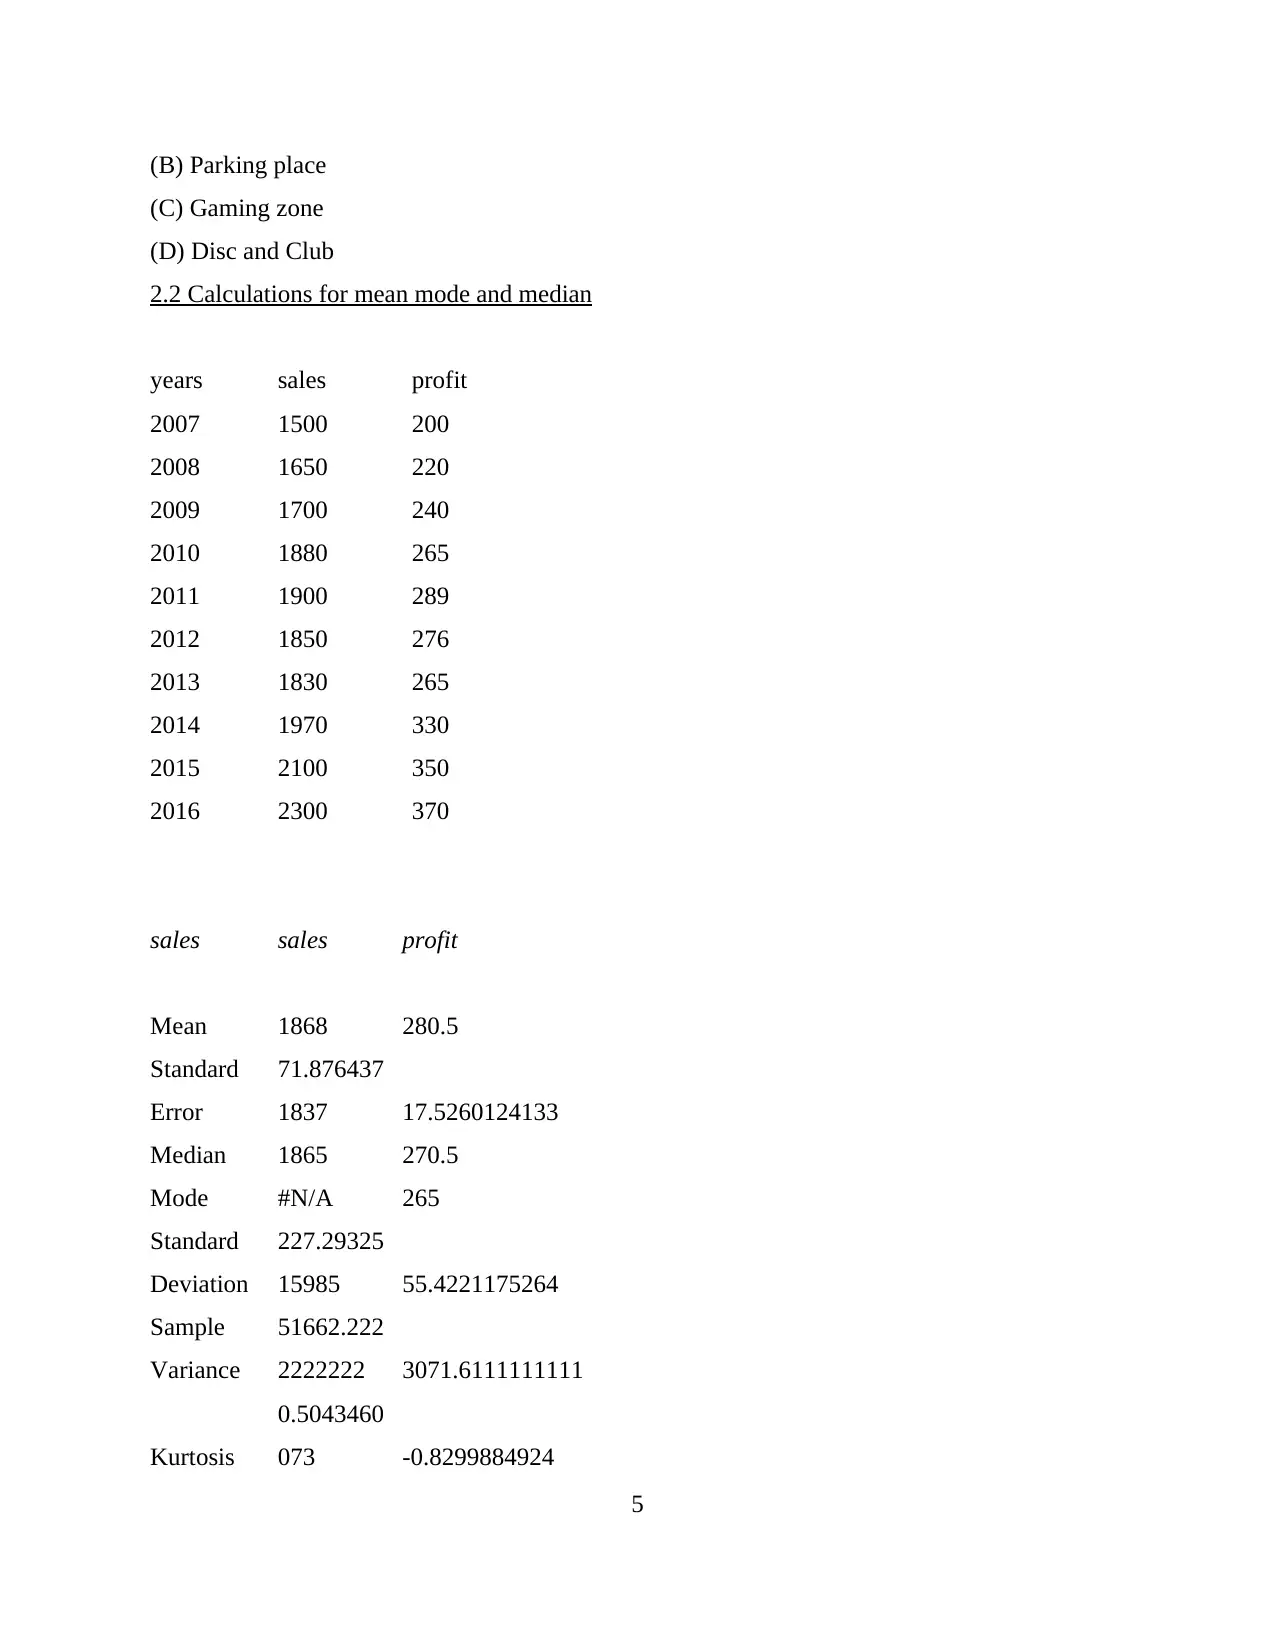
2.2 Calculations for mean mode and median
years sales profit
2007 1500 200
2008 1650 220
2009 1700 240
2010 1880 265
2011 1900 289
2012 1850 276
2013 1830 265
2014 1970 330
2015 2100 350
2016 2300 370
sales sales profit
Mean 1868 280.5
Standard
Error
71.876437
1837 17.5260124133
Median 1865 270.5
Mode #N/A 265
Standard
Deviation
227.29325
15985 55.4221175264
Sample
Variance
51662.222
2222222 3071.6111111111
Kurtosis
0.5043460
073 -0.8299884924
5
(C) Gaming zone
(D) Disc and Club
2.2 Calculations for mean mode and median
years sales profit
2007 1500 200
2008 1650 220
2009 1700 240
2010 1880 265
2011 1900 289
2012 1850 276
2013 1830 265
2014 1970 330
2015 2100 350
2016 2300 370
sales sales profit
Mean 1868 280.5
Standard
Error
71.876437
1837 17.5260124133
Median 1865 270.5
Mode #N/A 265
Standard
Deviation
227.29325
15985 55.4221175264
Sample
Variance
51662.222
2222222 3071.6111111111
Kurtosis
0.5043460
073 -0.8299884924
5
Paraphrase This Document
Need a fresh take? Get an instant paraphrase of this document with our AI Paraphraser
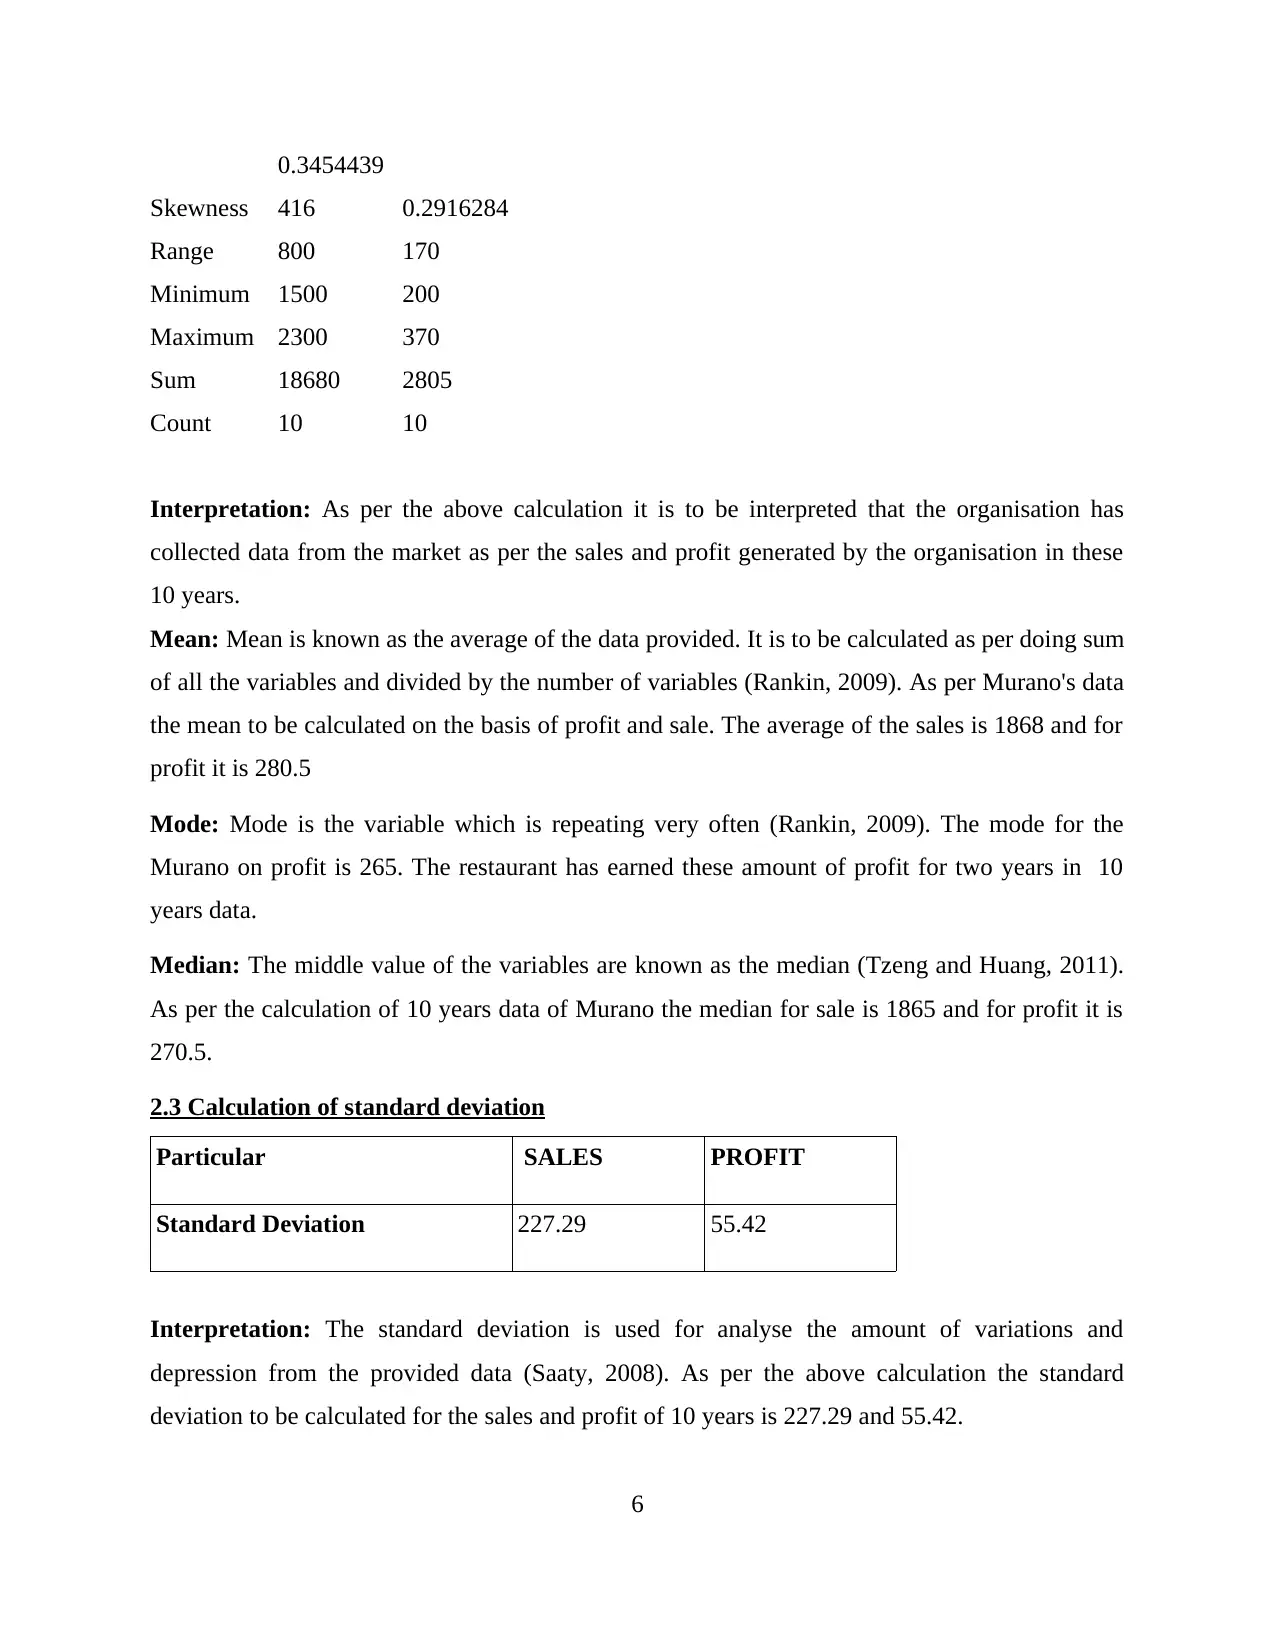
Skewness
0.3454439
416 0.2916284
Range 800 170
Minimum 1500 200
Maximum 2300 370
Sum 18680 2805
Count 10 10
Interpretation: As per the above calculation it is to be interpreted that the organisation has
collected data from the market as per the sales and profit generated by the organisation in these
10 years.
Mean: Mean is known as the average of the data provided. It is to be calculated as per doing sum
of all the variables and divided by the number of variables (Rankin, 2009). As per Murano's data
the mean to be calculated on the basis of profit and sale. The average of the sales is 1868 and for
profit it is 280.5
Mode: Mode is the variable which is repeating very often (Rankin, 2009). The mode for the
Murano on profit is 265. The restaurant has earned these amount of profit for two years in 10
years data.
Median: The middle value of the variables are known as the median (Tzeng and Huang, 2011).
As per the calculation of 10 years data of Murano the median for sale is 1865 and for profit it is
270.5.
2.3 Calculation of standard deviation
Particular SALES PROFIT
Standard Deviation 227.29 55.42
Interpretation: The standard deviation is used for analyse the amount of variations and
depression from the provided data (Saaty, 2008). As per the above calculation the standard
deviation to be calculated for the sales and profit of 10 years is 227.29 and 55.42.
6
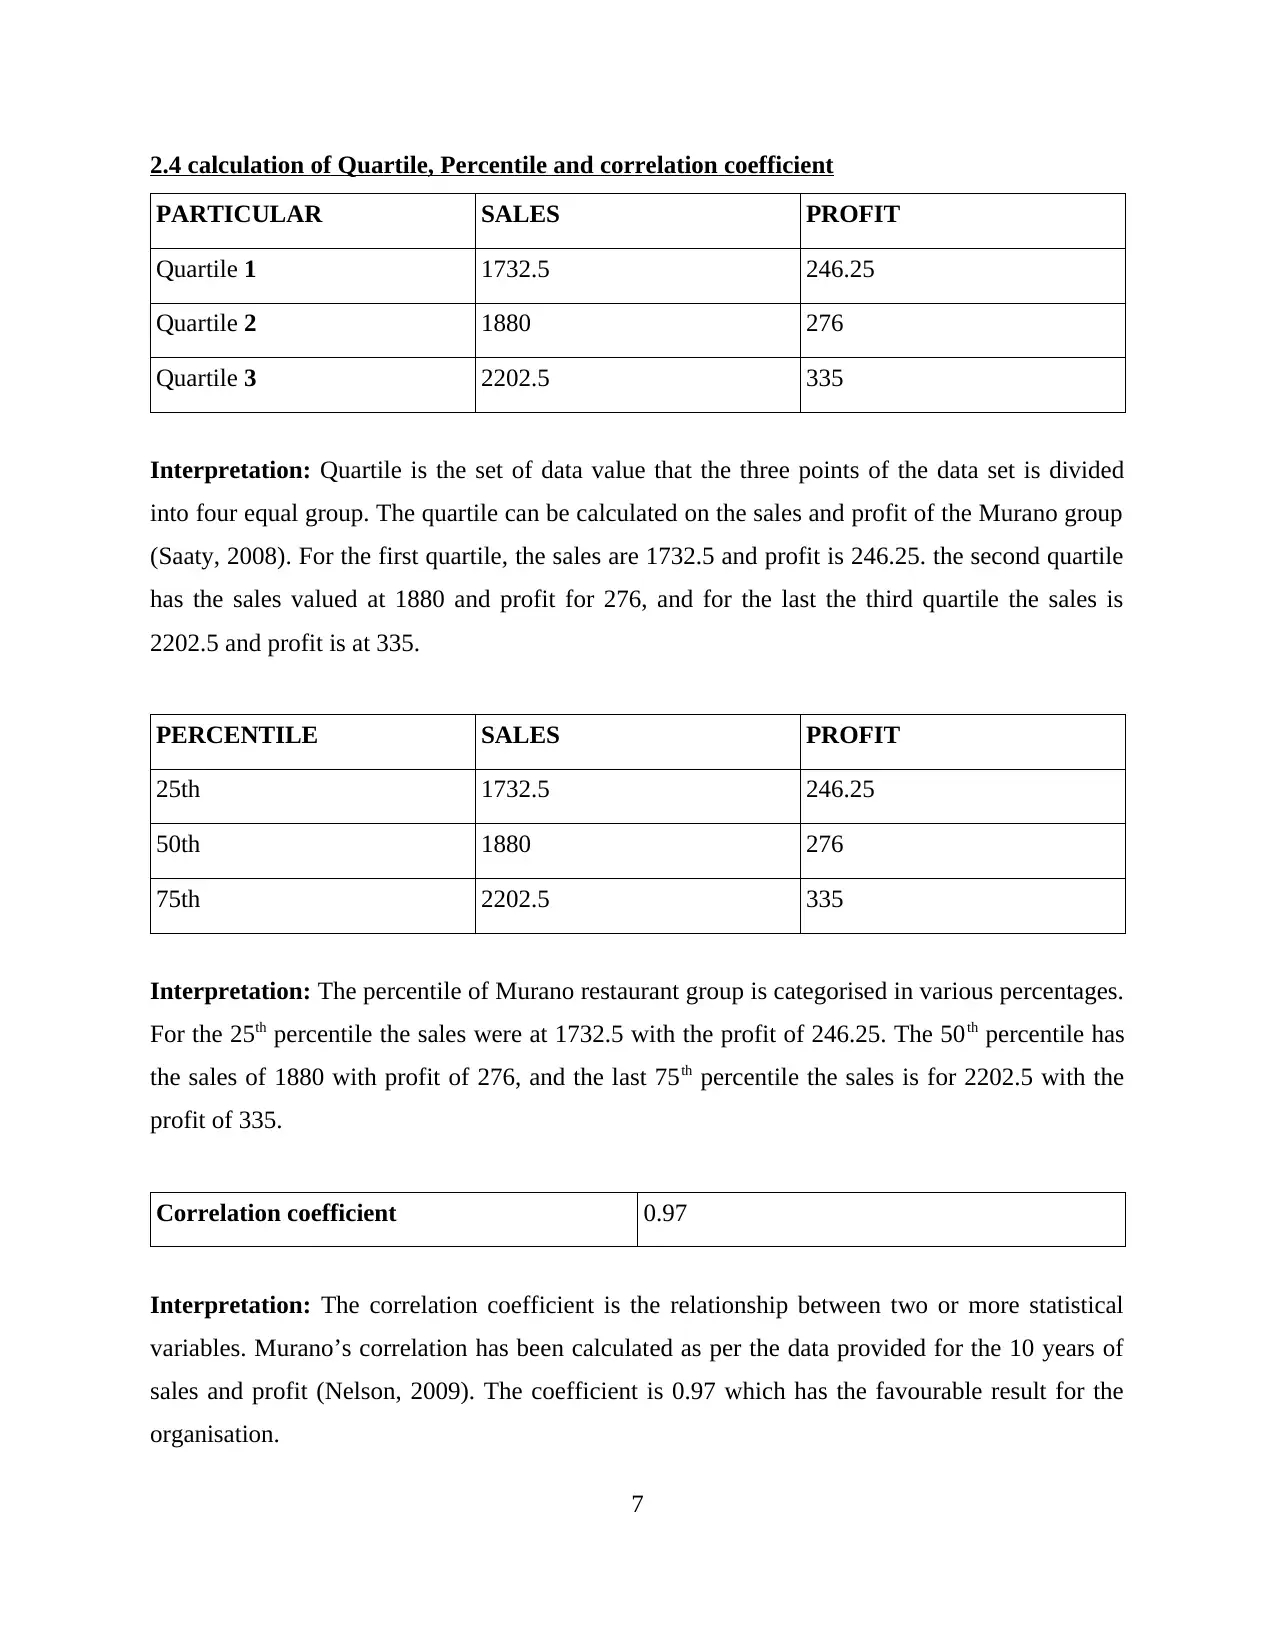
2.4 calculation of Quartile, Percentile and correlation coefficient
PARTICULAR SALES PROFIT
Quartile 1 1732.5 246.25
Quartile 2 1880 276
Quartile 3 2202.5 335
Interpretation: Quartile is the set of data value that the three points of the data set is divided
into four equal group. The quartile can be calculated on the sales and profit of the Murano group
(Saaty, 2008). For the first quartile, the sales are 1732.5 and profit is 246.25. the second quartile
has the sales valued at 1880 and profit for 276, and for the last the third quartile the sales is
2202.5 and profit is at 335.
PERCENTILE SALES PROFIT
25th 1732.5 246.25
50th 1880 276
75th 2202.5 335
Interpretation: The percentile of Murano restaurant group is categorised in various percentages.
For the 25th percentile the sales were at 1732.5 with the profit of 246.25. The 50th percentile has
the sales of 1880 with profit of 276, and the last 75th percentile the sales is for 2202.5 with the
profit of 335.
Correlation coefficient 0.97
Interpretation: The correlation coefficient is the relationship between two or more statistical
variables. Murano’s correlation has been calculated as per the data provided for the 10 years of
sales and profit (Nelson, 2009). The coefficient is 0.97 which has the favourable result for the
organisation.
7
⊘ This is a preview!⊘
Do you want full access?
Subscribe today to unlock all pages.
Trusted by 1+ million students worldwide
TASK 2
3.1 Business plan with the help of graphs and spreadsheet
2007 2008 2009 2010 2011 2012 2013 2014 2015 2016
0
500
1000
1500
2000
2500
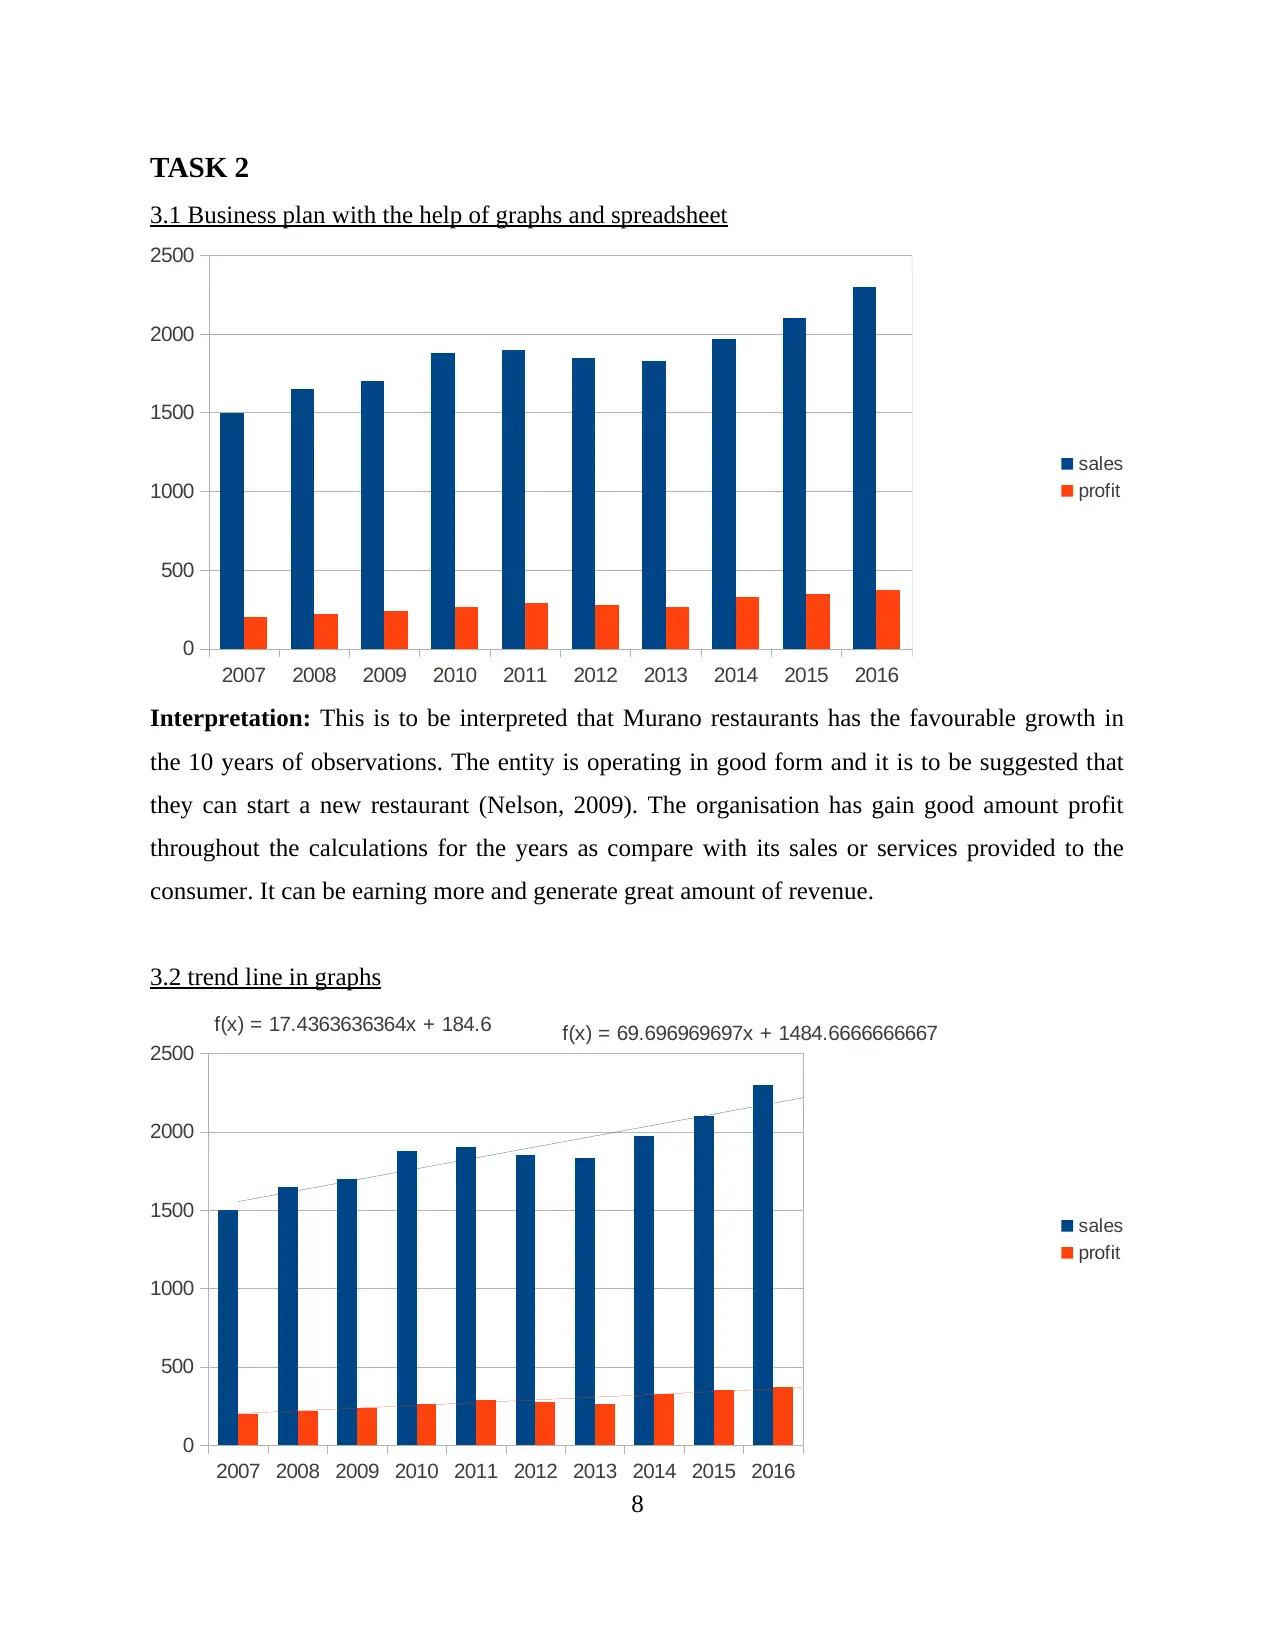
Interpretation: This is to be interpreted that Murano restaurants has the favourable growth in
the 10 years of observations. The entity is operating in good form and it is to be suggested that
they can start a new restaurant (Nelson, 2009). The organisation has gain good amount profit
throughout the calculations for the years as compare with its sales or services provided to the
consumer. It can be earning more and generate great amount of revenue.
3.2 trend line in graphs
2007 2008 2009 2010 2011 2012 2013 2014 2015 2016
0
500
1000
1500
2000
2500 f(x) = 69.696969697x + 1484.6666666667f(x) = 17.4363636364x + 184.6
8
sales
profit
sales
profit
3.1 Business plan with the help of graphs and spreadsheet
2007 2008 2009 2010 2011 2012 2013 2014 2015 2016
0
500
1000
1500
2000
2500
Interpretation: This is to be interpreted that Murano restaurants has the favourable growth in
the 10 years of observations. The entity is operating in good form and it is to be suggested that
they can start a new restaurant (Nelson, 2009). The organisation has gain good amount profit
throughout the calculations for the years as compare with its sales or services provided to the
consumer. It can be earning more and generate great amount of revenue.
3.2 trend line in graphs
2007 2008 2009 2010 2011 2012 2013 2014 2015 2016
0
500
1000
1500
2000
2500 f(x) = 69.696969697x + 1484.6666666667f(x) = 17.4363636364x + 184.6
8
sales
profit
sales
profit
Paraphrase This Document
Need a fresh take? Get an instant paraphrase of this document with our AI Paraphraser
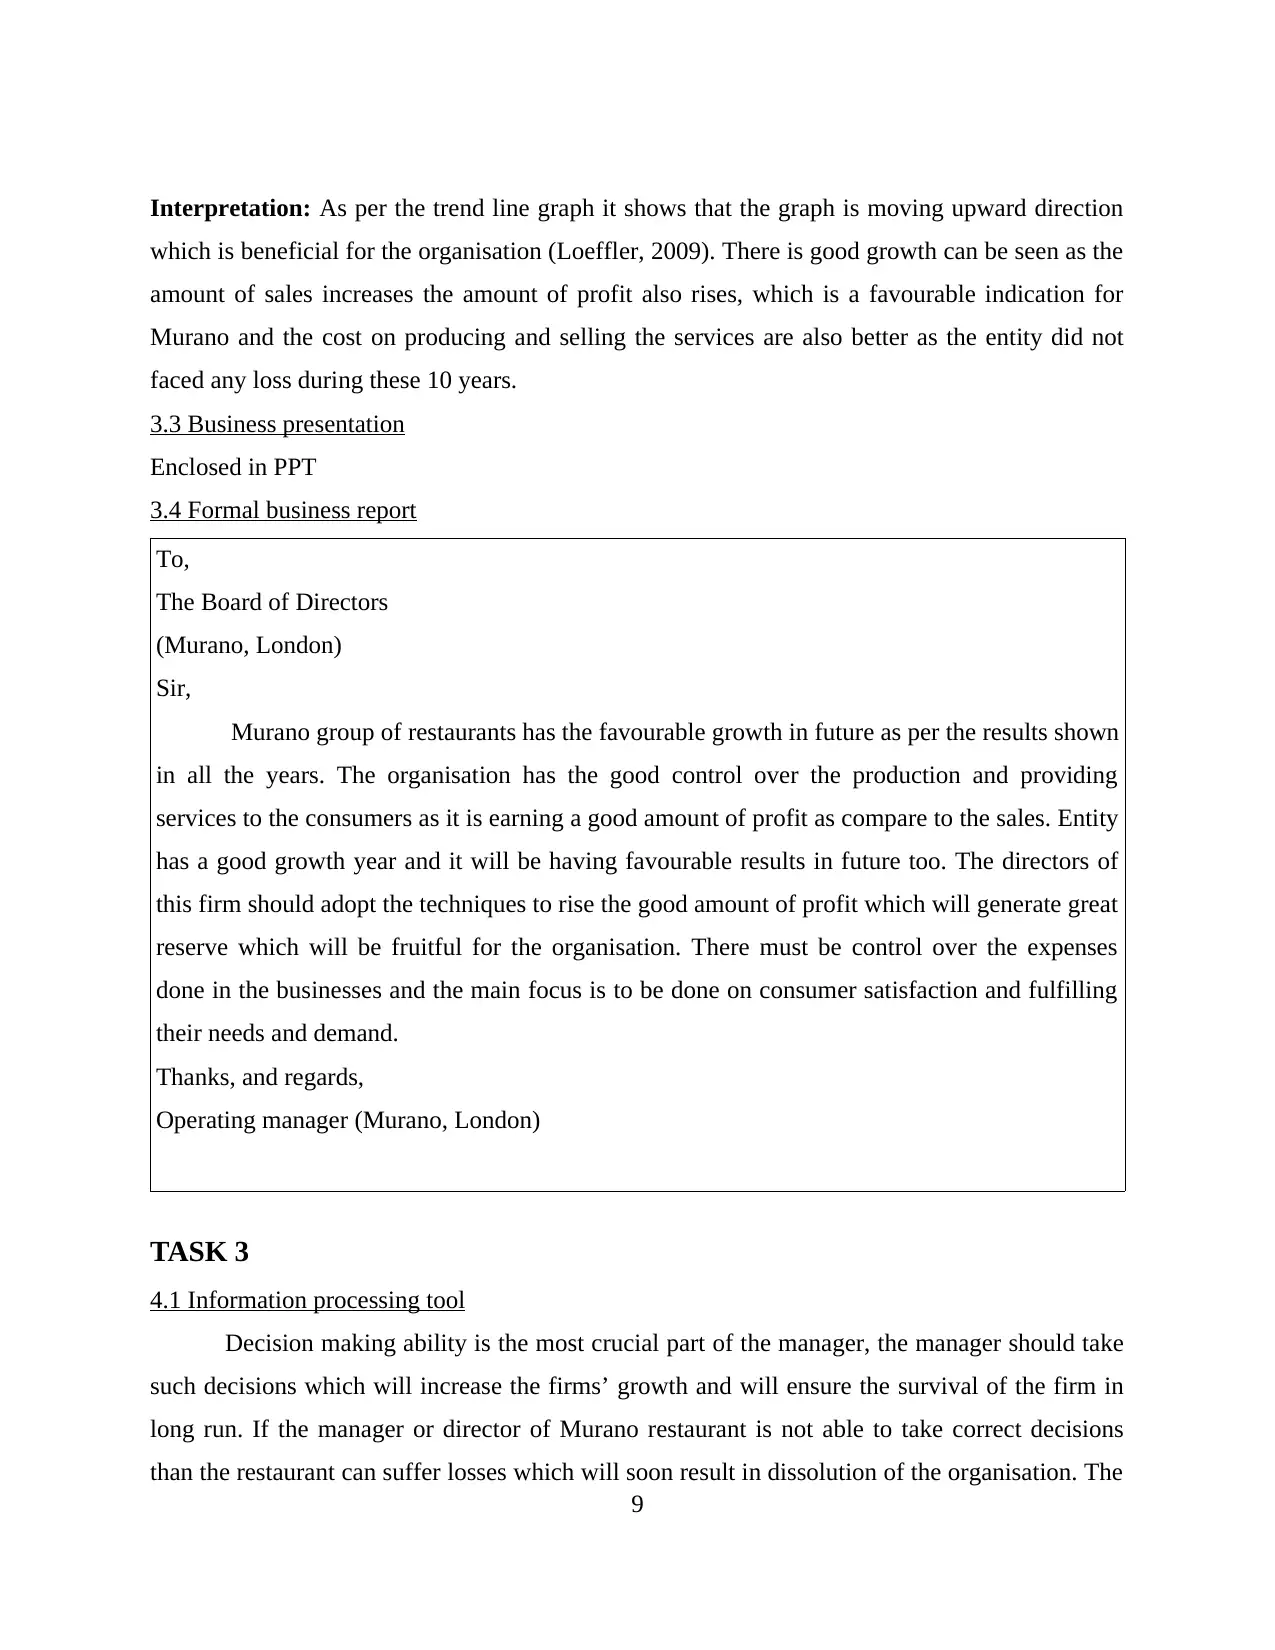
Interpretation: As per the trend line graph it shows that the graph is moving upward direction
which is beneficial for the organisation (Loeffler, 2009). There is good growth can be seen as the
amount of sales increases the amount of profit also rises, which is a favourable indication for
Murano and the cost on producing and selling the services are also better as the entity did not
faced any loss during these 10 years.
3.3 Business presentation
Enclosed in PPT
3.4 Formal business report
To,
The Board of Directors
(Murano, London)
Sir,
Murano group of restaurants has the favourable growth in future as per the results shown
in all the years. The organisation has the good control over the production and providing
services to the consumers as it is earning a good amount of profit as compare to the sales. Entity
has a good growth year and it will be having favourable results in future too. The directors of
this firm should adopt the techniques to rise the good amount of profit which will generate great
reserve which will be fruitful for the organisation. There must be control over the expenses
done in the businesses and the main focus is to be done on consumer satisfaction and fulfilling
their needs and demand.
Thanks, and regards,
Operating manager (Murano, London)
TASK 3
4.1 Information processing tool
Decision making ability is the most crucial part of the manager, the manager should take
such decisions which will increase the firms’ growth and will ensure the survival of the firm in
long run. If the manager or director of Murano restaurant is not able to take correct decisions
than the restaurant can suffer losses which will soon result in dissolution of the organisation. The
9
three bases on which the management should make decision are operational, plan action or
tactics and strategic decisions (Gill, and et.al. 2008). These decisions are divided on the basis of
different level of management. So, in this way we can say that decision making plays a very
important role in growth and development of an organisation.
Role of decision making in an organisation
As described earlier business decision making plays an important role for growth and
success of an organisation. In Murano decisions are taken on the basis of the needs and
satisfaction of their customers.
Information process tools
Decision Support System- This system helps the business organisation to take decisions
easily with the use of data available. Murano uses decision support system in order to Chechen
the deviations occurred and to correct them. It is done in the following ways:
Comparative sales- In this type the restaurant decision taking team compares previous sale
with current sale and decision is made on the basis the figures obtain.
Sales assumptions- Total volume of sale is assumed by the decision makers of the restaurant
and decision are made on the basis of such assumptions.
A decision support system represents information in the form of graphs.
Management Information System- Next tool in the process of making decision is the
management information system. It is a computer based system in which manager is avail with
the tools for efficiently and effectively managing the organisation activities (Daas, and Arends-
Tóth, 2009). The system includes software that helps the management of Murano in making
decisions. Management information system focuses on technological system. In this system, the
manager analyses the organisations problems and then design computer applications to solve
them.
Transaction Process System- Another tool which a manager uses for decision making is
transaction processing tool or real-time processing. In this system business transaction includes
collection, alteration and retrieval of all the transaction data (Daas and Arends-Tóth, 2009).
Customers will never tolerate mistakes so for ensuring the regular flow of the business
operations the restaurant should install transaction process system for making decisions.
10
⊘ This is a preview!⊘
Do you want full access?
Subscribe today to unlock all pages.
Trusted by 1+ million students worldwide
1 out of 17
Related Documents


Your All-in-One AI-Powered Toolkit for Academic Success.
+13062052269
info@desklib.com
Available 24*7 on WhatsApp / Email
![[object Object]](/_next/static/media/star-bottom.7253800d.svg)
Unlock your academic potential
Copyright © 2020–2026 A2Z Services. All Rights Reserved. Developed and managed by ZUCOL.