Business Decision Making Report: Data Analysis for Balti Palace Outlet
VerifiedAdded on 2020/07/22
|18
|4471
|41
Report
AI Summary
This report analyzes a business decision-making case study centered around Balti Palace, a London-based restaurant aiming to open a new outlet. It details the process of collecting primary and secondary data, including the creation of a data collection plan, survey methodology, and questionnaire design to gather customer preferences. The report then delves into data dissemination, calculations of central tendency and dispersion, and correlation analysis. Furthermore, it covers the creation of graphs and charts, trend line evaluations, and the presentation of findings to senior management for decision-making. The project also incorporates the use of information processing tools, a project plan with a Gantt chart and critical path analysis, and the application of financial tools to support informed business decisions. The conclusion summarizes the key findings and recommendations derived from the data analysis, providing a comprehensive overview of the decision-making process for Balti Palace.
Business Decision Making
Paraphrase This Document
Need a fresh take? Get an instant paraphrase of this document with our AI Paraphraser
Table of Contents
INTRODUCTION...........................................................................................................................1
TASK 1............................................................................................................................................1
1.1 Creation of plan for collecting primary and secondary data.................................................1
1.2 Survey methodology and sampling frame use......................................................................2
1.3 Designing of questionnaire...................................................................................................3
2.1 Dissemination of information...............................................................................................4
2.2 Calculation of measure of central tendency..........................................................................4
2.3 Calculation of measure of dispersion....................................................................................6
2.4 Determination of correlation coefficient and quartile...........................................................7
TASK 2............................................................................................................................................8
3.1 Creation of graphs and charts................................................................................................8
3.2 Evaluation of trend line.........................................................................................................9
3.3 Presentation of findings.......................................................................................................10
3.4 Report presented for senior management in order to take decision....................................10
TASK 3..........................................................................................................................................10
4.1 Use of appropriate information processing tool..................................................................10
4.2 Prepare a project plan for estimated about Gantt Chart and critical path...........................11
4.3 Use of financial tools in order to take better decision.........................................................12
CONCLUSION..............................................................................................................................13
REFERENCES..............................................................................................................................14
INTRODUCTION
Success for a business comes up with a every big and right decision making. It is
important for an organisation to take all such people opinion in consideration whom lead to get
impacted with such judgement (Ferrell and Fraedrich, 2015). Business Decision making is a task
for senior management of a company which take on the basis of various aspects and people. This
project is based on Balti palace which is one of a famous London based restaurant and want to
open another outlet in UK as well. For this perspective, management want to organise a study
and take appropriate as well as suitable decision which support long term context. This project
includes about primary and secondary data elaboration with survey methodology. Along with
this, by using relevant method data get collected and whole information lead to disseminate
properly as well. Moreover, business need to use measure of central tendency and measure of
dispersion properly so that better and effective decision making get promoted. Although, it is
important to use suitable software generated information so that better decision making get
encourage.
TASK 1
1.1 Creation of plan for collecting primary and secondary data
It is very important to carry out those activity which gives benefits for the future growth
of business (Ford and Richardson, 2013). Whatever the company objectives there is a need to
research all the sources that provide rational idea. Further company uses various technique like
collecting various types of data I.e. primary and secondary data which help in gathering the data,
developing useful information out of collecting data and last presenting the data.
For finding out the external trends, market strategy it is very important what type of data
company required to collect which give valuable future returns to company. The two main
sources are:-
Primary Data:-
These data are collected for first time and data collected from this source is valuable,
original and worth-full for company. The most important advantage of primary from company
point of view is to collect the original information on the basis of current needs and market
trends of company. Method of collecting primary data are:-
1
⊘ This is a preview!⊘
Do you want full access?
Subscribe today to unlock all pages.
Trusted by 1+ million students worldwide
Questionnaire prepared with the objective to know the customer choices, tastes through
questionnaire by asking various sets of questions. It is a good method of collecting data which is
used for developing and launching a new product in market.
Secondary Data:-
Secondary data are already collected data and it scrutinized by the researcher with an
objective of taking business decisions (García-Peñalvo and Conde, 2014). Secondary data can be
collected through various online sites, magazines, newspaper etc. It is a best way for collecting
data of large population on the basis already published journals that define the taste,preference
and choices of costumer.
The mast important thing is whatever the data company researched or gather is suitable to
company market strategies and give profitable returns in future.
For this project, Balti Palace is using primary source of data which enable them in order
to gather more and more information in an appropriate manner so that better responses get
derive.
1.2 Survey methodology and sampling frame use
Survey is an important thing which facilitate in order to gather and collect information in
an appropriate manner (Groebner and et. al., 2011). Survey methodologies includes various
methods of study so that better and effective gain get promoted by consulting various people
opinion and perspective in an appropriate frame. Balti Palace can use various survey
methodology in their working so that management become able to take beneficial outcome: Social media: It is one of a recent and modern method of collection of data in which
business become able to organise their investigation at wide level so that better and
appropriate responses could be gain. It is usually possible for large and big organisation
whom are operating at vast level and number of customers are more as well. Balti Palace
are not able to organise their investigation at such context because they operates at lower
level.
Questionnaire: Collection of feedback is an important thing for managing and taking
best suited results. Questionnaire is consider as best suited approach for many small
business association whom want to gain feedback and suitable responses from their
clients. Balti Palace can use this method into business through which association become
2
Paraphrase This Document
Need a fresh take? Get an instant paraphrase of this document with our AI Paraphraser
able to gain responses and opinion of various customers regarding new outlet and taste or
preferences as well.
Although, Balti Palace research includes a questionnaire survey by using random sampling frame
in which 80 respondents opinion get articulated properly for analysing their taste and preference
as well as opinion regarding location and staff behaviour.
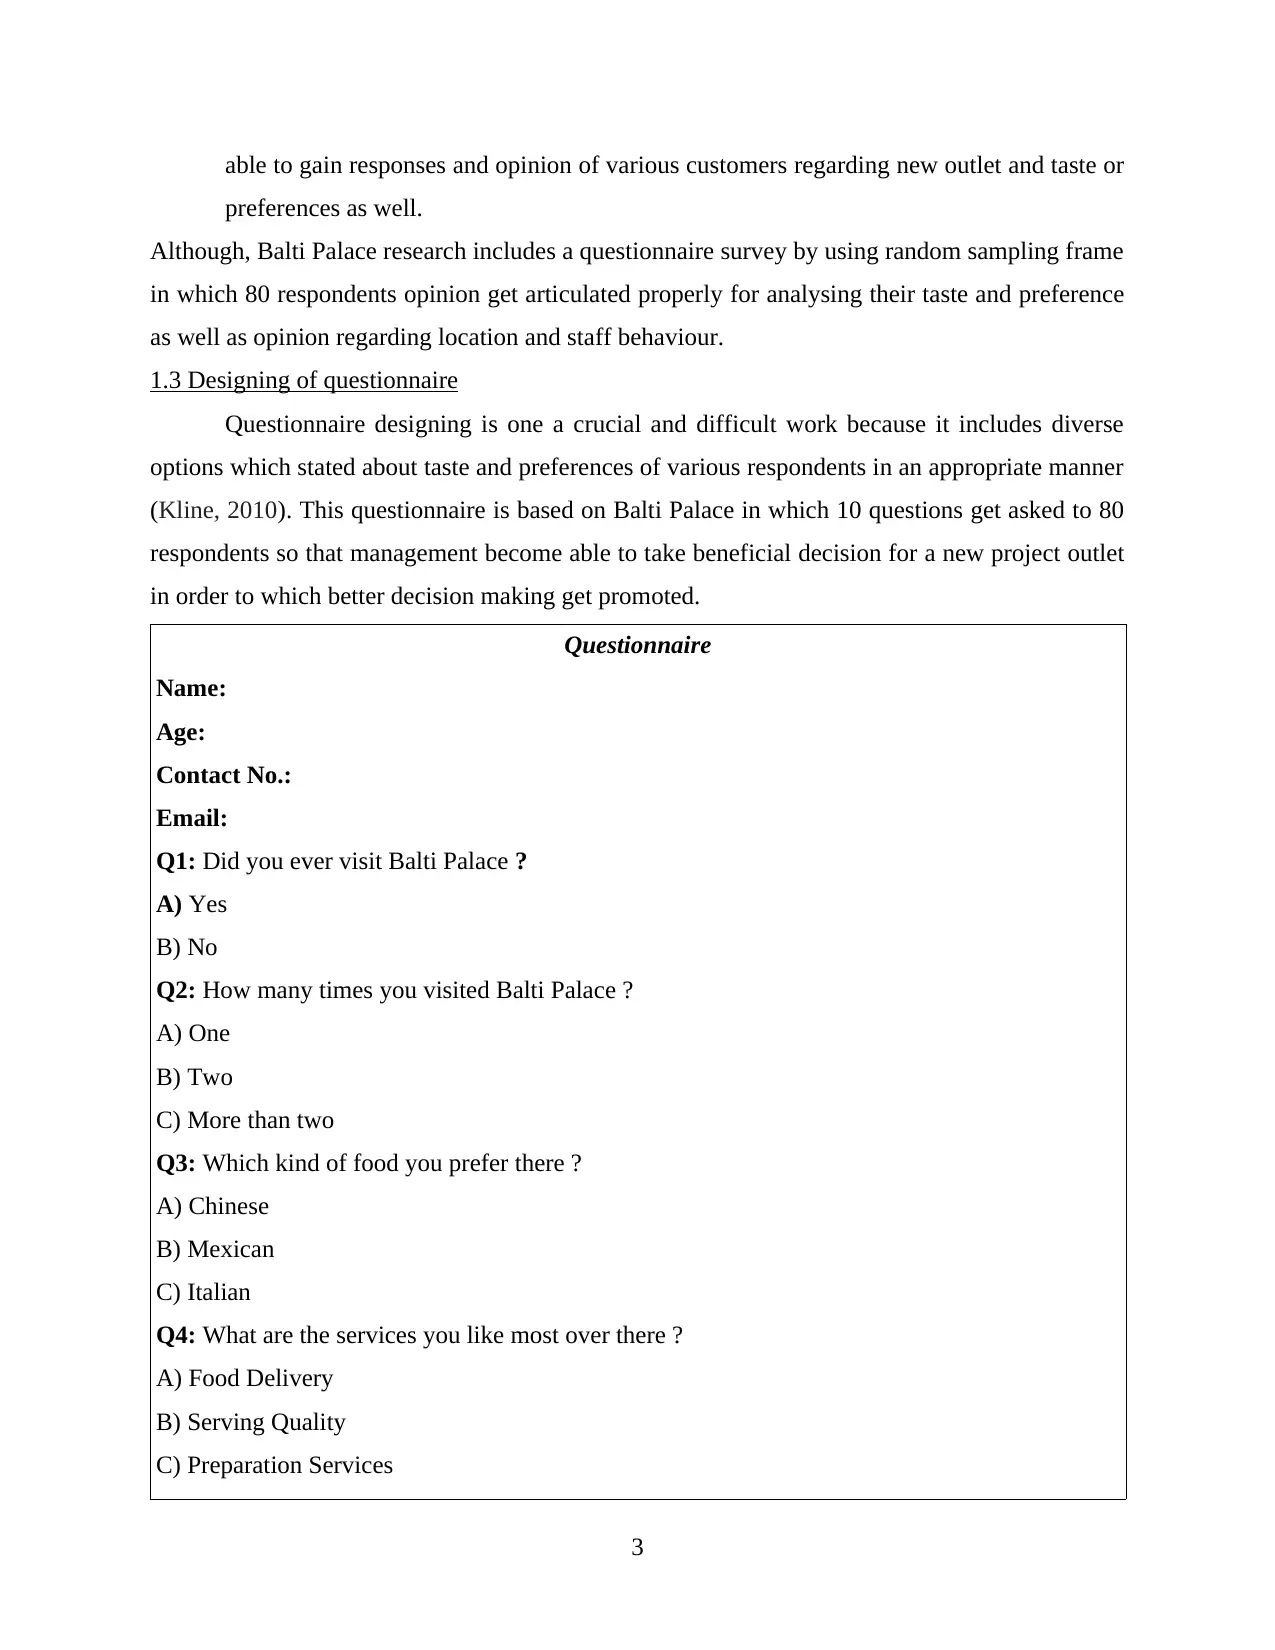
1.3 Designing of questionnaire
Questionnaire designing is one a crucial and difficult work because it includes diverse
options which stated about taste and preferences of various respondents in an appropriate manner
(Kline, 2010). This questionnaire is based on Balti Palace in which 10 questions get asked to 80
respondents so that management become able to take beneficial decision for a new project outlet
in order to which better decision making get promoted.
Questionnaire
Name:
Age:
Contact No.:
Email:
Q1: Did you ever visit Balti Palace ?
A) Yes
B) No
Q2: How many times you visited Balti Palace ?
A) One
B) Two
C) More than two
Q3: Which kind of food you prefer there ?
A) Chinese
B) Mexican
C) Italian
Q4: What are the services you like most over there ?
A) Food Delivery
B) Serving Quality
C) Preparation Services
3
preferences as well.
Although, Balti Palace research includes a questionnaire survey by using random sampling frame
in which 80 respondents opinion get articulated properly for analysing their taste and preference
as well as opinion regarding location and staff behaviour.
1.3 Designing of questionnaire
Questionnaire designing is one a crucial and difficult work because it includes diverse
options which stated about taste and preferences of various respondents in an appropriate manner
(Kline, 2010). This questionnaire is based on Balti Palace in which 10 questions get asked to 80
respondents so that management become able to take beneficial decision for a new project outlet
in order to which better decision making get promoted.
Questionnaire
Name:
Age:
Contact No.:
Email:
Q1: Did you ever visit Balti Palace ?
A) Yes
B) No
Q2: How many times you visited Balti Palace ?
A) One
B) Two
C) More than two
Q3: Which kind of food you prefer there ?
A) Chinese
B) Mexican
C) Italian
Q4: What are the services you like most over there ?
A) Food Delivery
B) Serving Quality
C) Preparation Services
3
Q5: what do you prefer take away order or eat there ?
A) Take away
B) Order and eat at same place
Q6: What do you like more the service or food ?
A) Services
B) Foods
Q7: Do you recommend this restaurants to your friend ?
A) Yes
B) No
Q8: How many friends you recommended this restaurant ?
A) One
B) Two
C) More than two
Q9: How is your experience with our restaurant and its services ?
A) Good
B) Very good
C) Satisfactory
Q10: Give recommendations and suggestions for our service ?
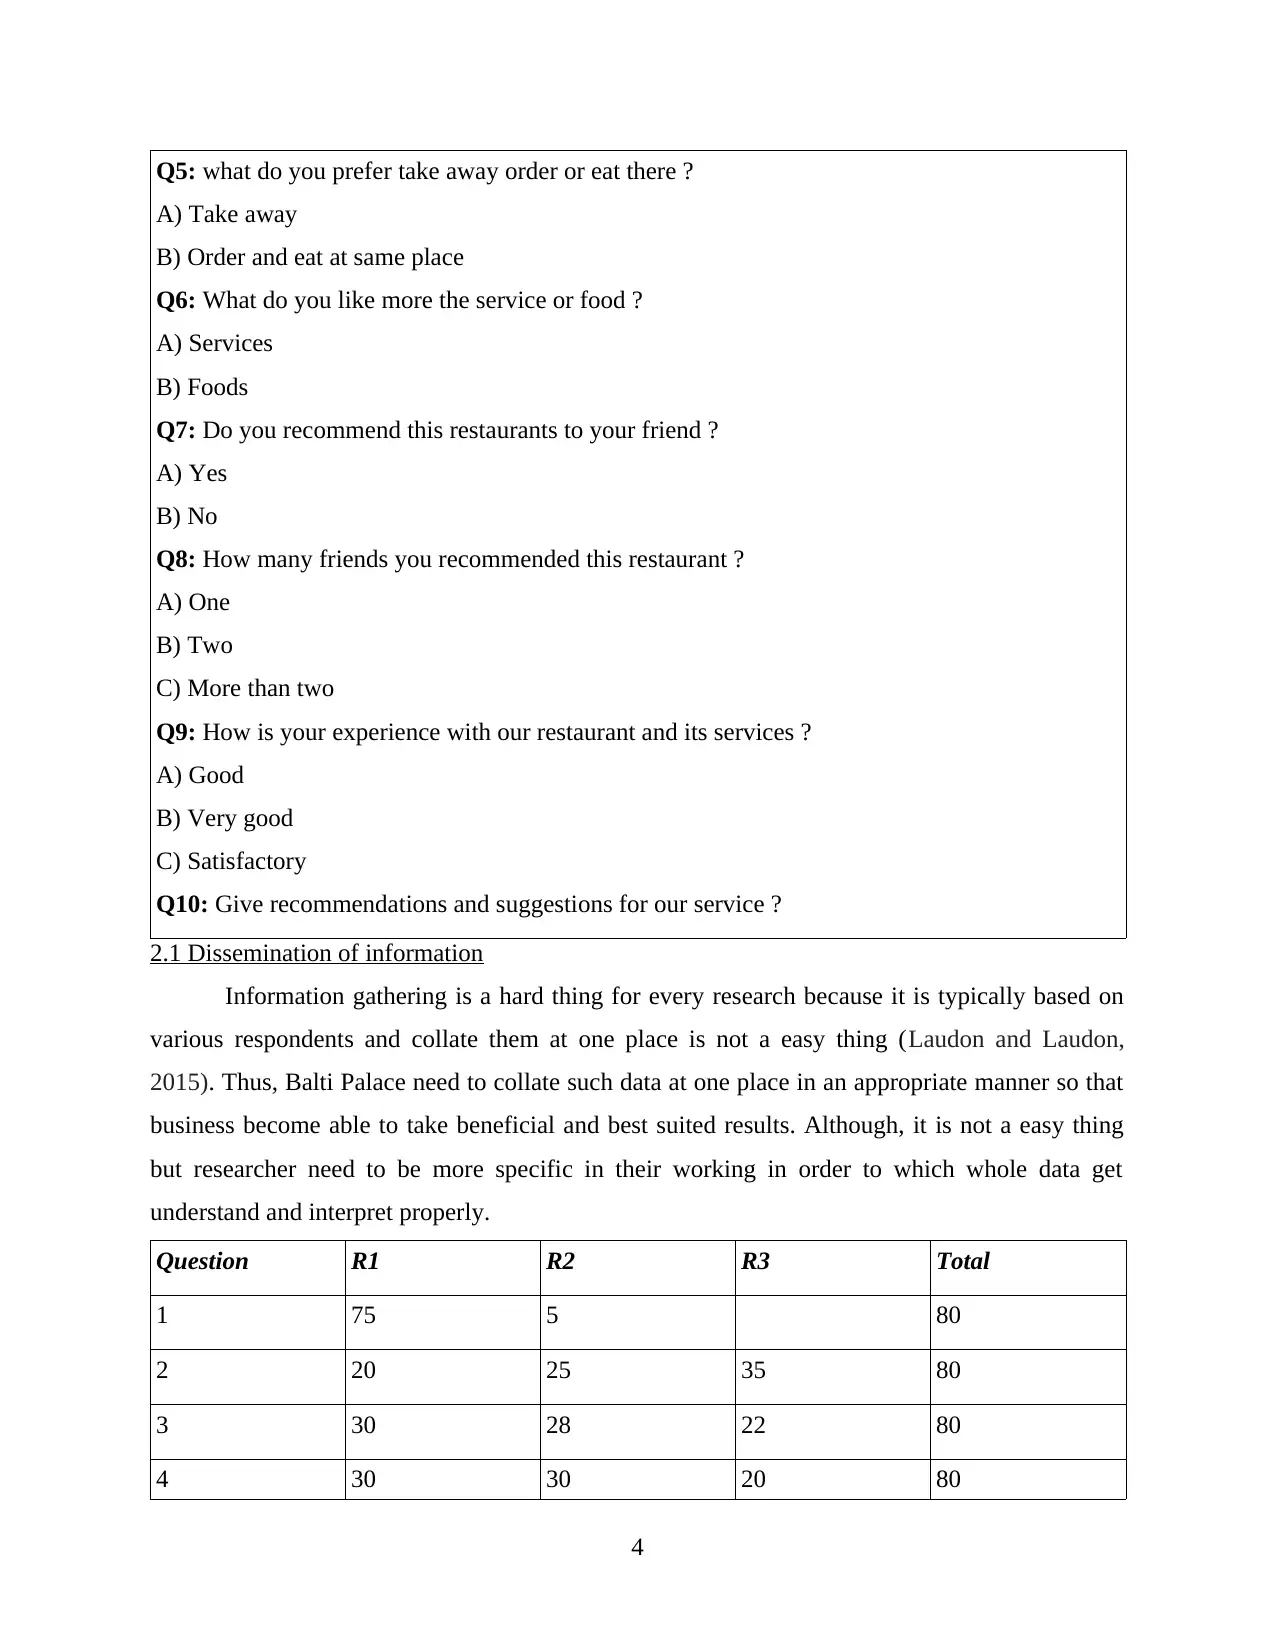
2.1 Dissemination of information
Information gathering is a hard thing for every research because it is typically based on
various respondents and collate them at one place is not a easy thing (Laudon and Laudon,
2015). Thus, Balti Palace need to collate such data at one place in an appropriate manner so that
business become able to take beneficial and best suited results. Although, it is not a easy thing
but researcher need to be more specific in their working in order to which whole data get
understand and interpret properly.
Question R1 R2 R3 Total
1 75 5 80
2 20 25 35 80
3 30 28 22 80
4 30 30 20 80
4
A) Take away
B) Order and eat at same place
Q6: What do you like more the service or food ?
A) Services
B) Foods
Q7: Do you recommend this restaurants to your friend ?
A) Yes
B) No
Q8: How many friends you recommended this restaurant ?
A) One
B) Two
C) More than two
Q9: How is your experience with our restaurant and its services ?
A) Good
B) Very good
C) Satisfactory
Q10: Give recommendations and suggestions for our service ?
2.1 Dissemination of information
Information gathering is a hard thing for every research because it is typically based on
various respondents and collate them at one place is not a easy thing (Laudon and Laudon,
2015). Thus, Balti Palace need to collate such data at one place in an appropriate manner so that
business become able to take beneficial and best suited results. Although, it is not a easy thing
but researcher need to be more specific in their working in order to which whole data get
understand and interpret properly.
Question R1 R2 R3 Total
1 75 5 80
2 20 25 35 80
3 30 28 22 80
4 30 30 20 80
4
⊘ This is a preview!⊘
Do you want full access?
Subscribe today to unlock all pages.
Trusted by 1+ million students worldwide
5 20 60 80
6 45 35 80
7 65 15 80
8 20 25 35 80
9 25 30 25 80
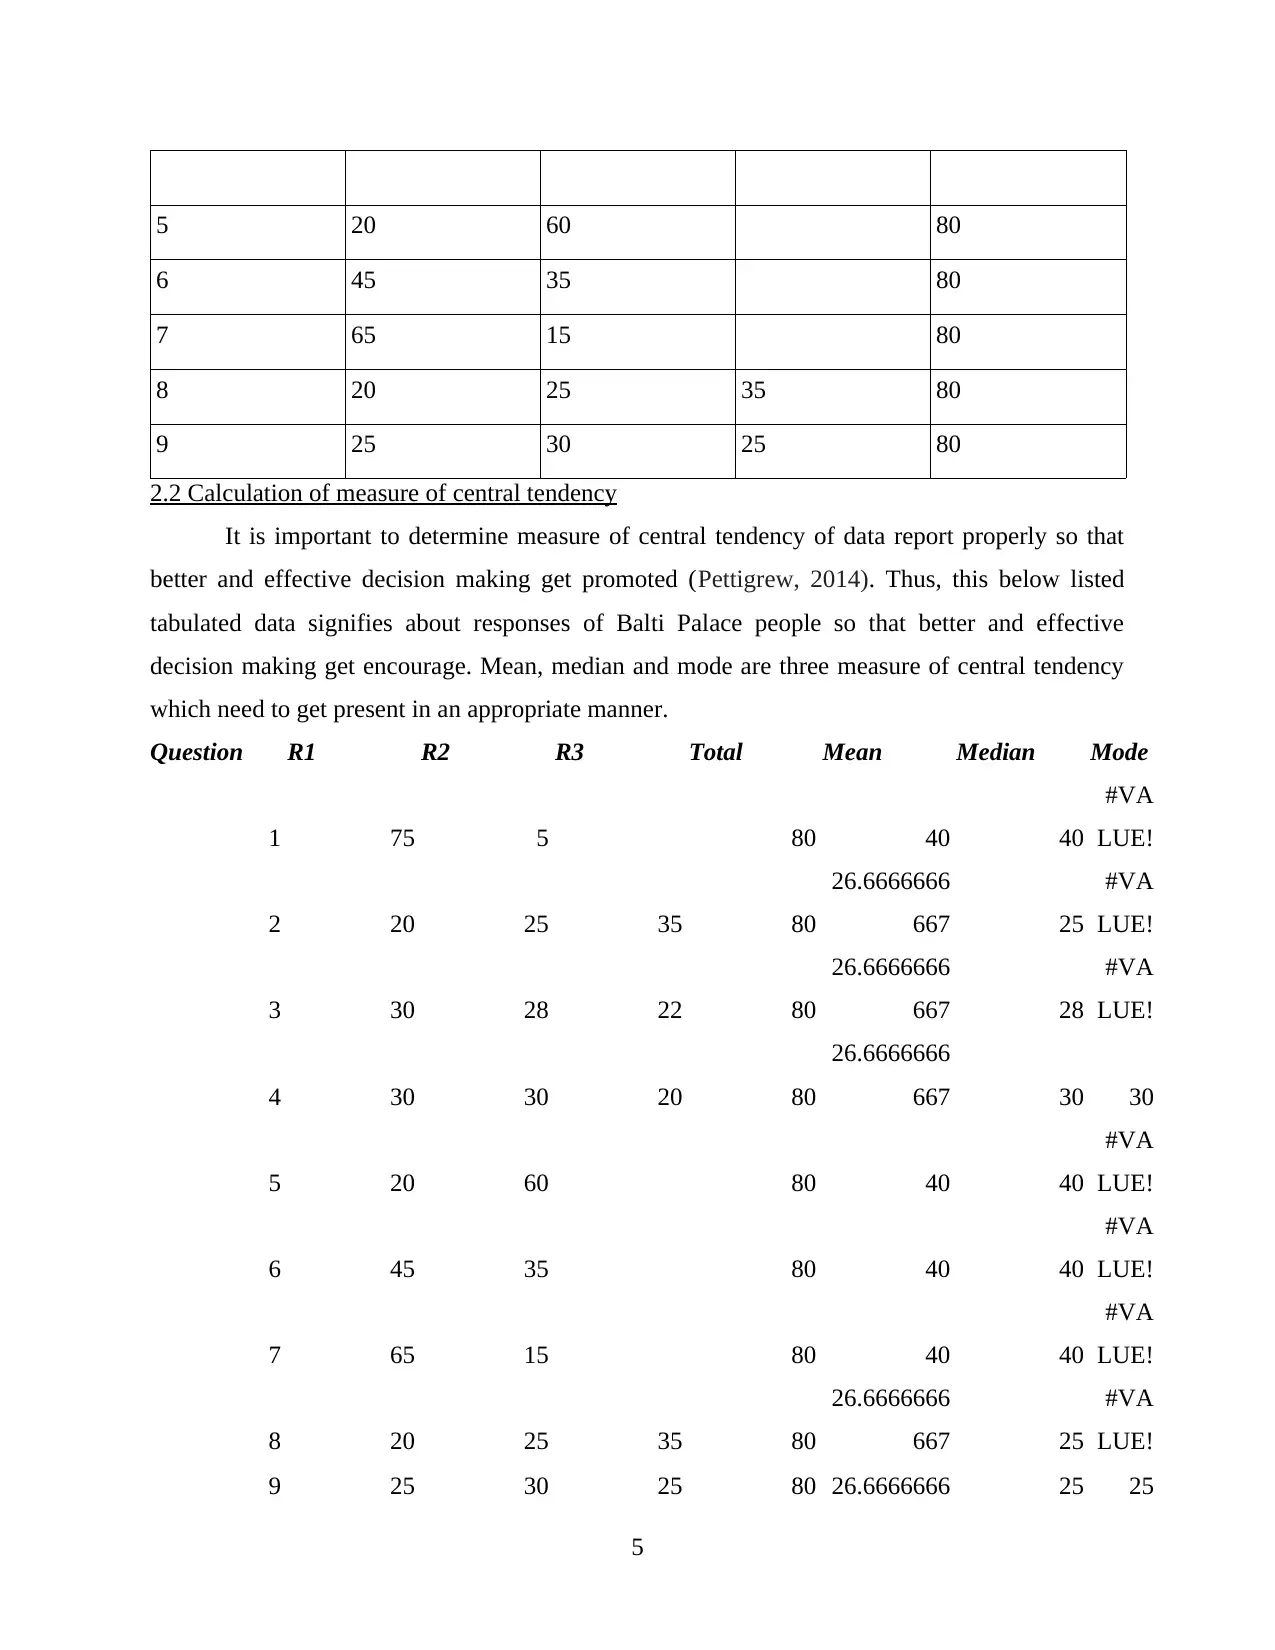
2.2 Calculation of measure of central tendency
It is important to determine measure of central tendency of data report properly so that
better and effective decision making get promoted (Pettigrew, 2014). Thus, this below listed
tabulated data signifies about responses of Balti Palace people so that better and effective
decision making get encourage. Mean, median and mode are three measure of central tendency
which need to get present in an appropriate manner.
Question R1 R2 R3 Total Mean Median Mode
1 75 5 80 40 40
#VA
LUE!
2 20 25 35 80
26.6666666
667 25
#VA
LUE!
3 30 28 22 80
26.6666666
667 28
#VA
LUE!
4 30 30 20 80
26.6666666
667 30 30
5 20 60 80 40 40
#VA
LUE!
6 45 35 80 40 40
#VA
LUE!
7 65 15 80 40 40
#VA
LUE!
8 20 25 35 80
26.6666666
667 25
#VA
LUE!
9 25 30 25 80 26.6666666 25 25
5
6 45 35 80
7 65 15 80
8 20 25 35 80
9 25 30 25 80
2.2 Calculation of measure of central tendency
It is important to determine measure of central tendency of data report properly so that
better and effective decision making get promoted (Pettigrew, 2014). Thus, this below listed
tabulated data signifies about responses of Balti Palace people so that better and effective
decision making get encourage. Mean, median and mode are three measure of central tendency
which need to get present in an appropriate manner.
Question R1 R2 R3 Total Mean Median Mode
1 75 5 80 40 40
#VA
LUE!
2 20 25 35 80
26.6666666
667 25
#VA
LUE!
3 30 28 22 80
26.6666666
667 28
#VA
LUE!
4 30 30 20 80
26.6666666
667 30 30
5 20 60 80 40 40
#VA
LUE!
6 45 35 80 40 40
#VA
LUE!
7 65 15 80 40 40
#VA
LUE!
8 20 25 35 80
26.6666666
667 25
#VA
LUE!
9 25 30 25 80 26.6666666 25 25
5
Paraphrase This Document
Need a fresh take? Get an instant paraphrase of this document with our AI Paraphraser
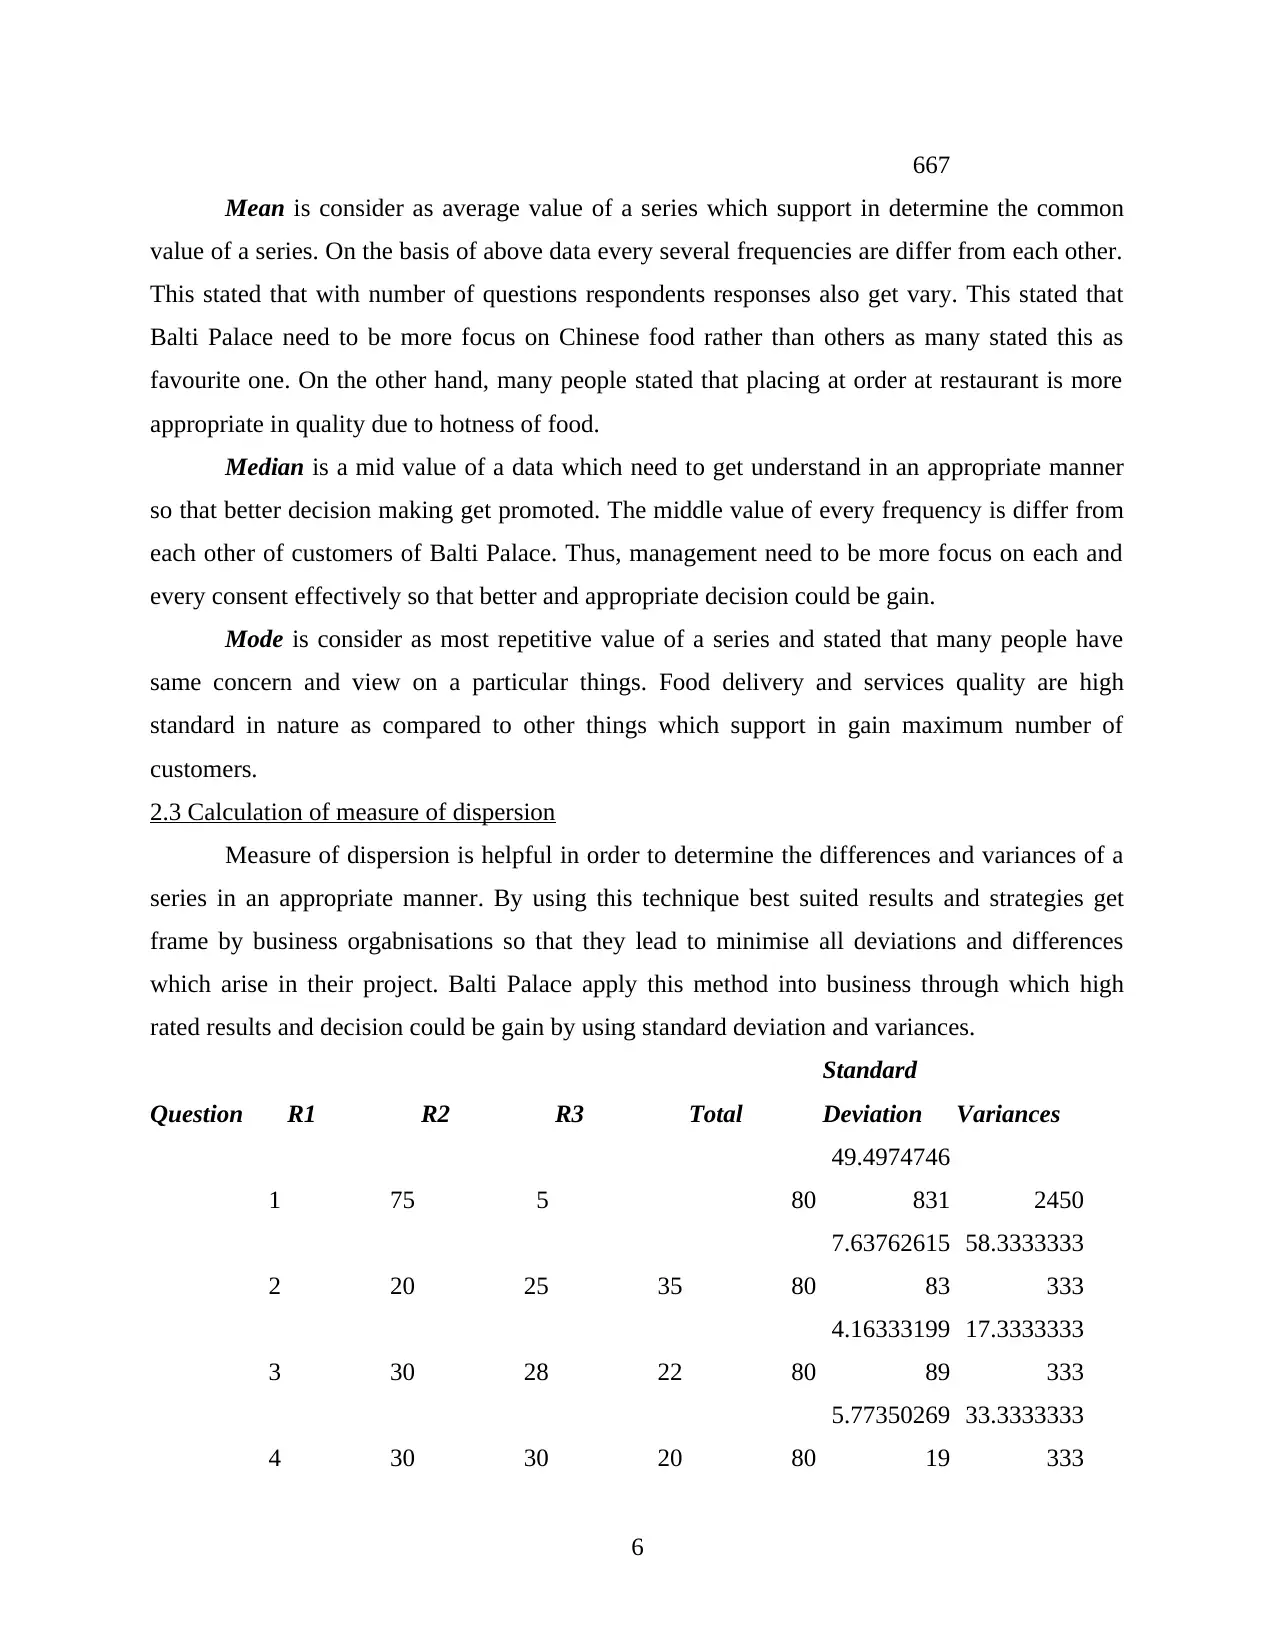
667
Mean is consider as average value of a series which support in determine the common
value of a series. On the basis of above data every several frequencies are differ from each other.
This stated that with number of questions respondents responses also get vary. This stated that
Balti Palace need to be more focus on Chinese food rather than others as many stated this as
favourite one. On the other hand, many people stated that placing at order at restaurant is more
appropriate in quality due to hotness of food.
Median is a mid value of a data which need to get understand in an appropriate manner
so that better decision making get promoted. The middle value of every frequency is differ from
each other of customers of Balti Palace. Thus, management need to be more focus on each and
every consent effectively so that better and appropriate decision could be gain.
Mode is consider as most repetitive value of a series and stated that many people have
same concern and view on a particular things. Food delivery and services quality are high
standard in nature as compared to other things which support in gain maximum number of
customers.
2.3 Calculation of measure of dispersion
Measure of dispersion is helpful in order to determine the differences and variances of a
series in an appropriate manner. By using this technique best suited results and strategies get
frame by business orgabnisations so that they lead to minimise all deviations and differences
which arise in their project. Balti Palace apply this method into business through which high
rated results and decision could be gain by using standard deviation and variances.
Question R1 R2 R3 Total
Standard
Deviation Variances
1 75 5 80
49.4974746
831 2450
2 20 25 35 80
7.63762615
83
58.3333333
333
3 30 28 22 80
4.16333199
89
17.3333333
333
4 30 30 20 80
5.77350269
19
33.3333333
333
6
5 20 60 80
28.2842712
475 800
6 45 35 80
7.07106781
19 50
7 65 15 80
35.3553390
593 1250
8 20 25 35 80
7.63762615
83
58.3333333
333
9 25 30 25 80
2.88675134
59
8.33333333
33
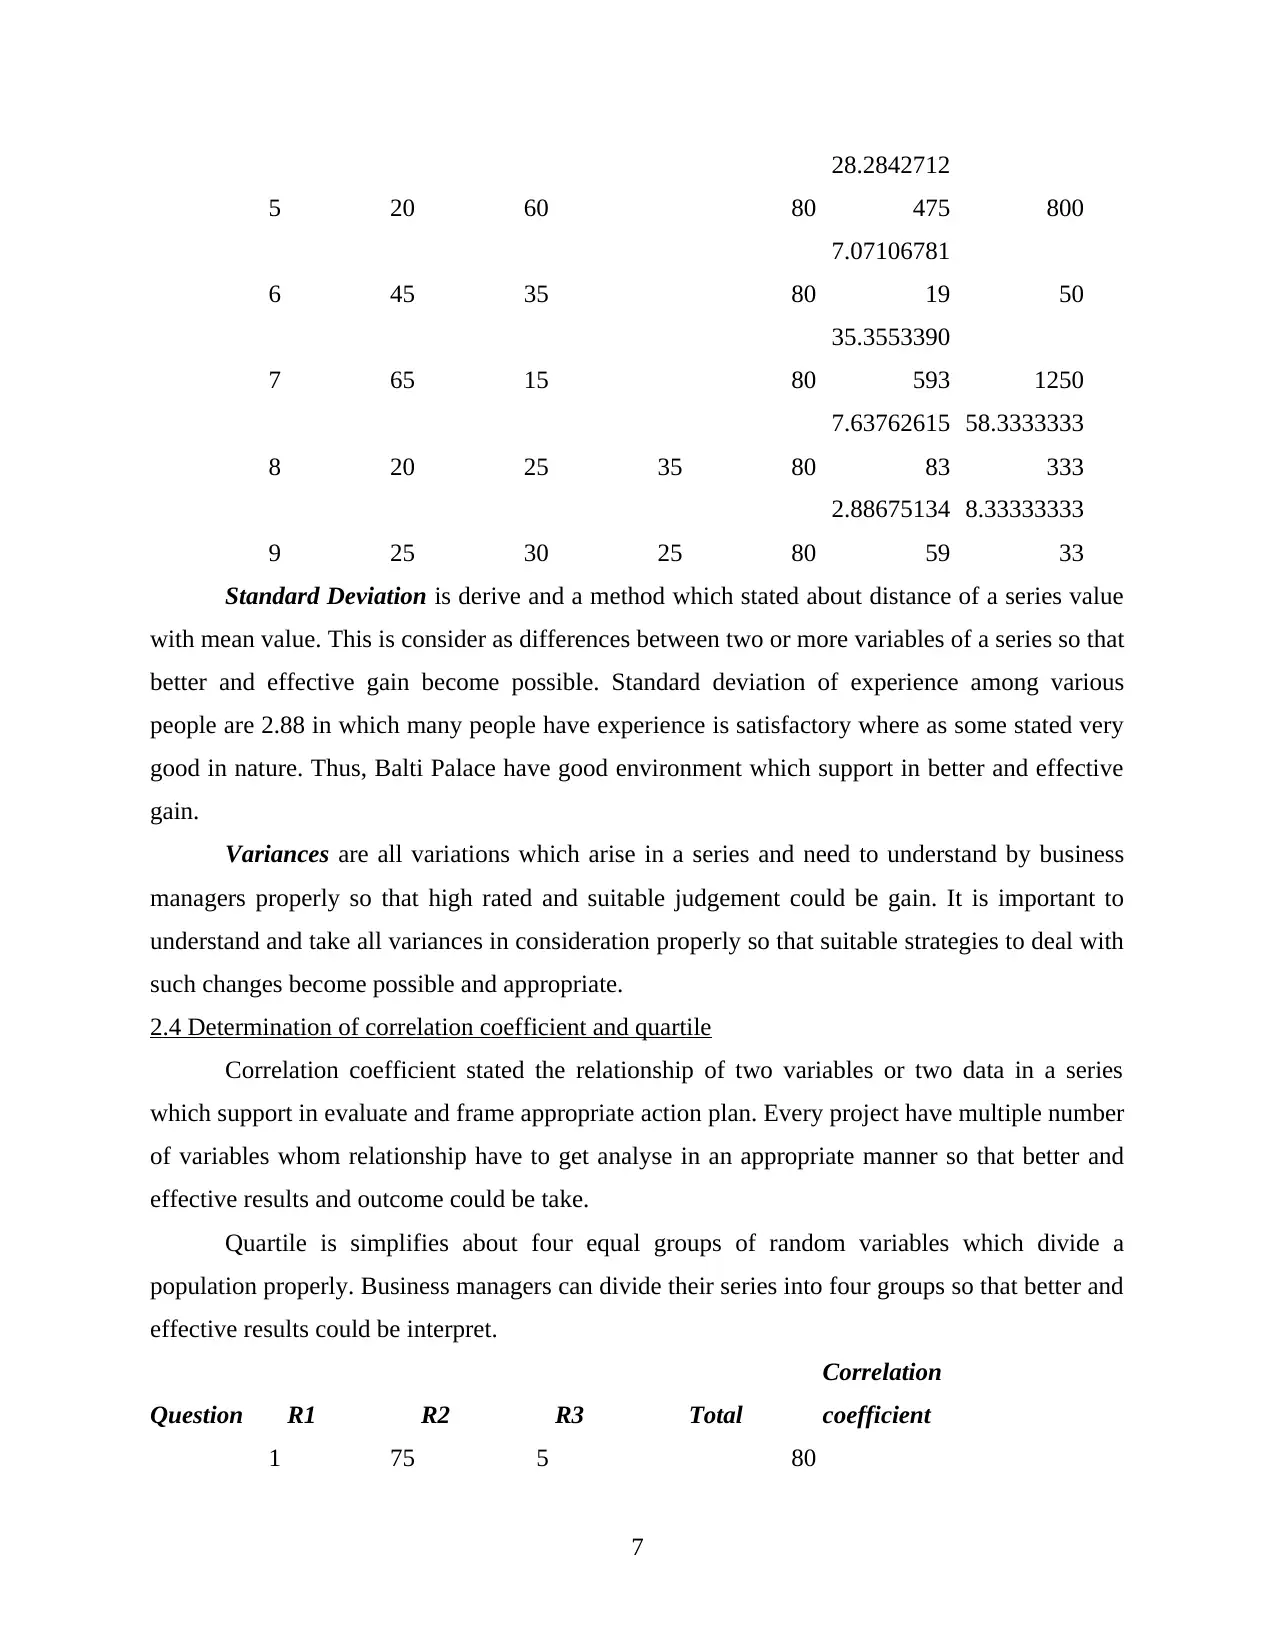
Standard Deviation is derive and a method which stated about distance of a series value
with mean value. This is consider as differences between two or more variables of a series so that
better and effective gain become possible. Standard deviation of experience among various
people are 2.88 in which many people have experience is satisfactory where as some stated very
good in nature. Thus, Balti Palace have good environment which support in better and effective
gain.
Variances are all variations which arise in a series and need to understand by business
managers properly so that high rated and suitable judgement could be gain. It is important to
understand and take all variances in consideration properly so that suitable strategies to deal with
such changes become possible and appropriate.
2.4 Determination of correlation coefficient and quartile
Correlation coefficient stated the relationship of two variables or two data in a series
which support in evaluate and frame appropriate action plan. Every project have multiple number
of variables whom relationship have to get analyse in an appropriate manner so that better and
effective results and outcome could be take.
Quartile is simplifies about four equal groups of random variables which divide a
population properly. Business managers can divide their series into four groups so that better and
effective results could be interpret.
Question R1 R2 R3 Total
Correlation
coefficient
1 75 5 80
7
28.2842712
475 800
6 45 35 80
7.07106781
19 50
7 65 15 80
35.3553390
593 1250
8 20 25 35 80
7.63762615
83
58.3333333
333
9 25 30 25 80
2.88675134
59
8.33333333
33
Standard Deviation is derive and a method which stated about distance of a series value
with mean value. This is consider as differences between two or more variables of a series so that
better and effective gain become possible. Standard deviation of experience among various
people are 2.88 in which many people have experience is satisfactory where as some stated very
good in nature. Thus, Balti Palace have good environment which support in better and effective
gain.
Variances are all variations which arise in a series and need to understand by business
managers properly so that high rated and suitable judgement could be gain. It is important to
understand and take all variances in consideration properly so that suitable strategies to deal with
such changes become possible and appropriate.
2.4 Determination of correlation coefficient and quartile
Correlation coefficient stated the relationship of two variables or two data in a series
which support in evaluate and frame appropriate action plan. Every project have multiple number
of variables whom relationship have to get analyse in an appropriate manner so that better and
effective results and outcome could be take.
Quartile is simplifies about four equal groups of random variables which divide a
population properly. Business managers can divide their series into four groups so that better and
effective results could be interpret.
Question R1 R2 R3 Total
Correlation
coefficient
1 75 5 80
7
⊘ This is a preview!⊘
Do you want full access?
Subscribe today to unlock all pages.
Trusted by 1+ million students worldwide
2 20 25 35 80
-
0.99587059
49
3 30 28 22 80
4 30 30 20 80
5 20 60 80 -1
6 45 35 80
7 65 15 80
8 20 25 35 80
-
0.18898223
65
9 25 30 25 80
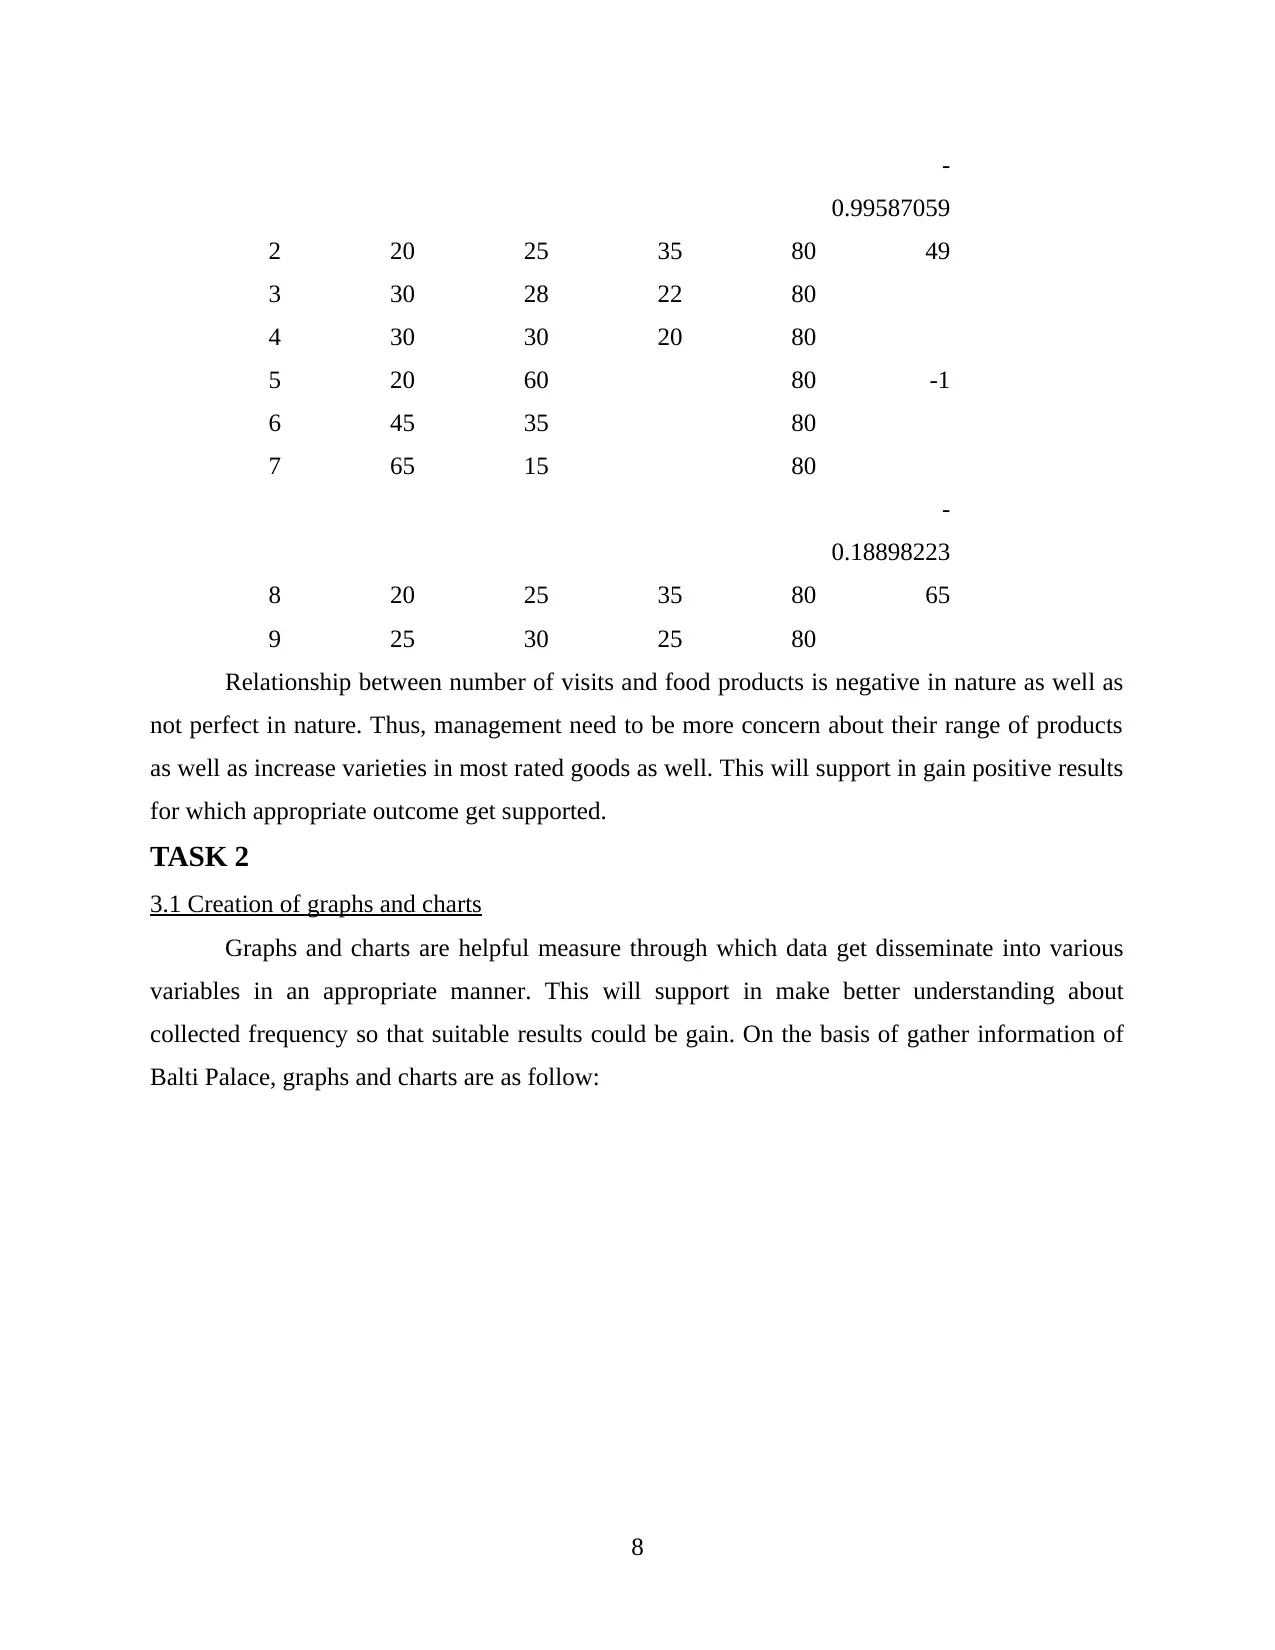
Relationship between number of visits and food products is negative in nature as well as
not perfect in nature. Thus, management need to be more concern about their range of products
as well as increase varieties in most rated goods as well. This will support in gain positive results
for which appropriate outcome get supported.
TASK 2
3.1 Creation of graphs and charts
Graphs and charts are helpful measure through which data get disseminate into various
variables in an appropriate manner. This will support in make better understanding about
collected frequency so that suitable results could be gain. On the basis of gather information of
Balti Palace, graphs and charts are as follow:
8
-
0.99587059
49
3 30 28 22 80
4 30 30 20 80
5 20 60 80 -1
6 45 35 80
7 65 15 80
8 20 25 35 80
-
0.18898223
65
9 25 30 25 80
Relationship between number of visits and food products is negative in nature as well as
not perfect in nature. Thus, management need to be more concern about their range of products
as well as increase varieties in most rated goods as well. This will support in gain positive results
for which appropriate outcome get supported.
TASK 2
3.1 Creation of graphs and charts
Graphs and charts are helpful measure through which data get disseminate into various
variables in an appropriate manner. This will support in make better understanding about
collected frequency so that suitable results could be gain. On the basis of gather information of
Balti Palace, graphs and charts are as follow:
8
Paraphrase This Document
Need a fresh take? Get an instant paraphrase of this document with our AI Paraphraser
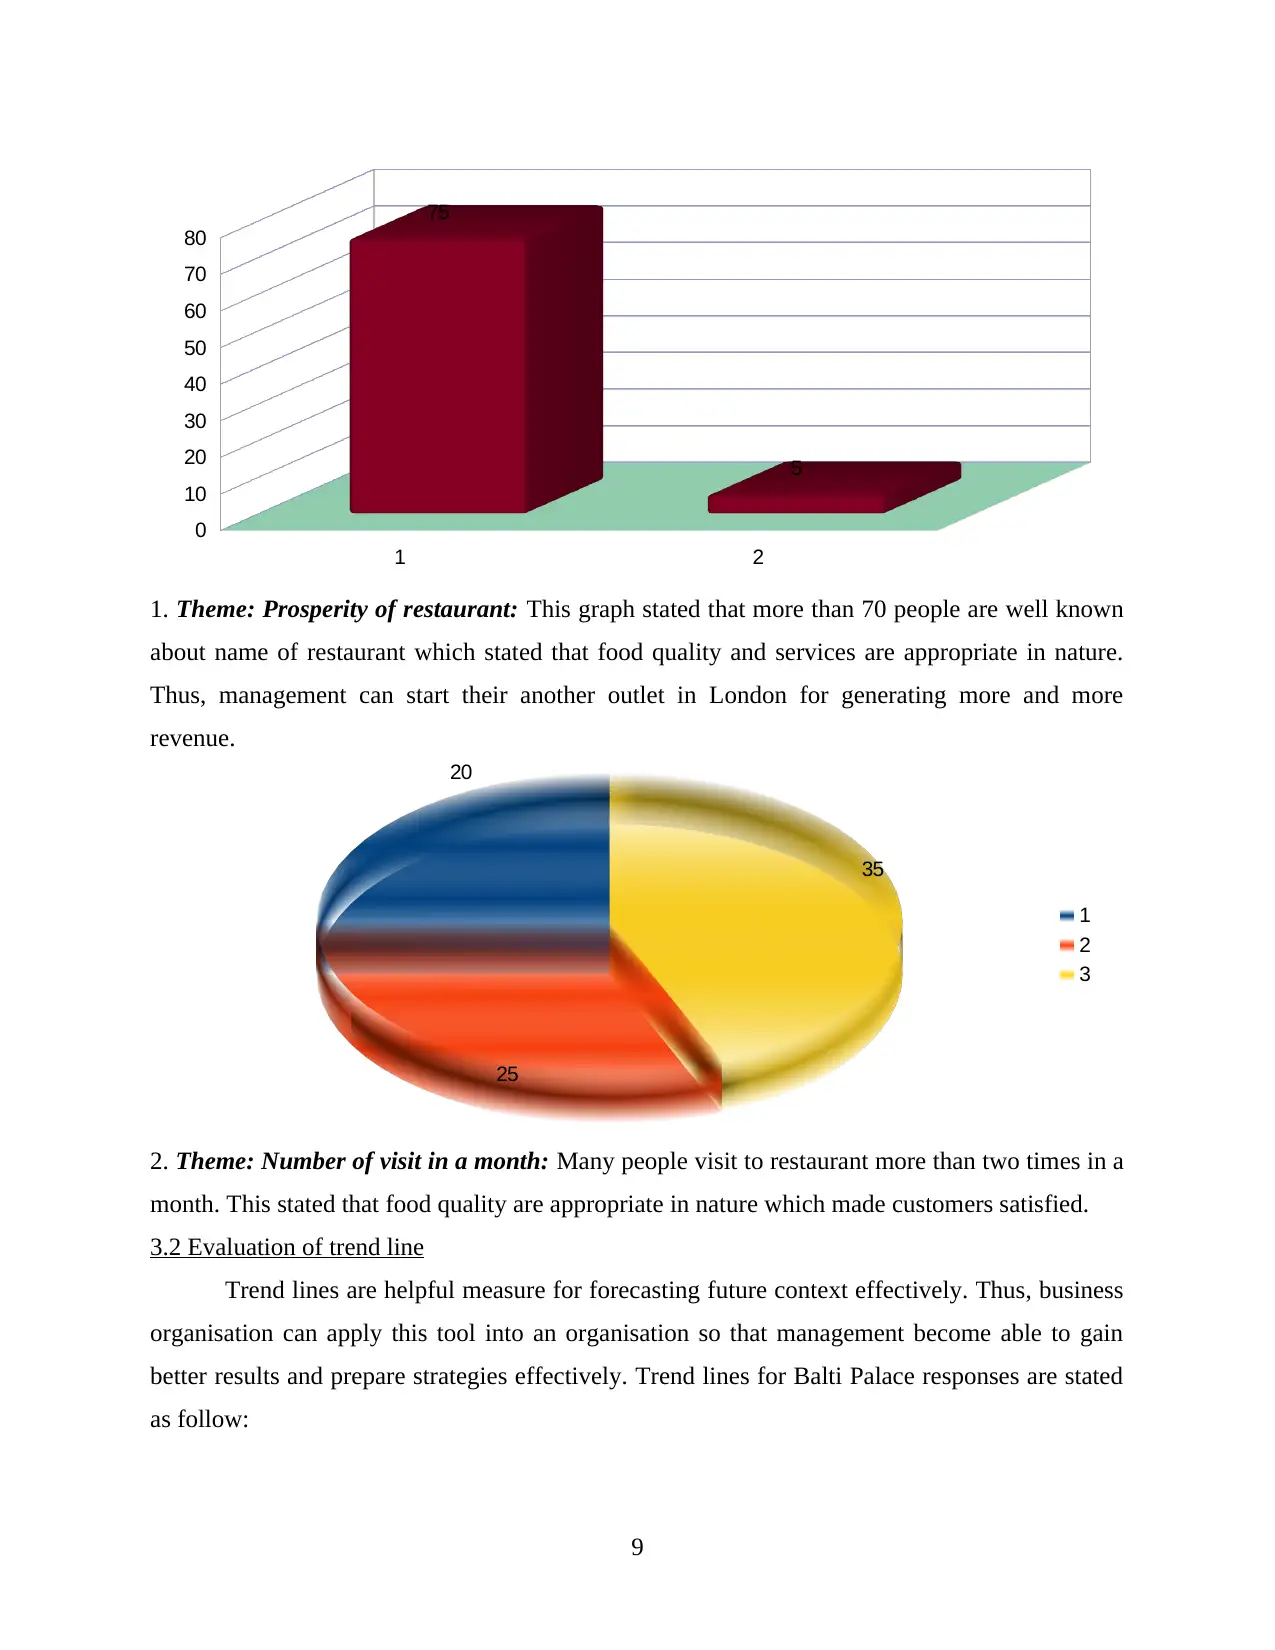
1. Theme: Prosperity of restaurant: This graph stated that more than 70 people are well known
about name of restaurant which stated that food quality and services are appropriate in nature.
Thus, management can start their another outlet in London for generating more and more
revenue.
2. Theme: Number of visit in a month: Many people visit to restaurant more than two times in a
month. This stated that food quality are appropriate in nature which made customers satisfied.
3.2 Evaluation of trend line
Trend lines are helpful measure for forecasting future context effectively. Thus, business
organisation can apply this tool into an organisation so that management become able to gain
better results and prepare strategies effectively. Trend lines for Balti Palace responses are stated
as follow:
9
1 2
0
10
20
30
40
50
60
70
80
75
5
20
25
35
1
2
3
1 2 3
0
5
10
15
20
25
30
35
30 30
20
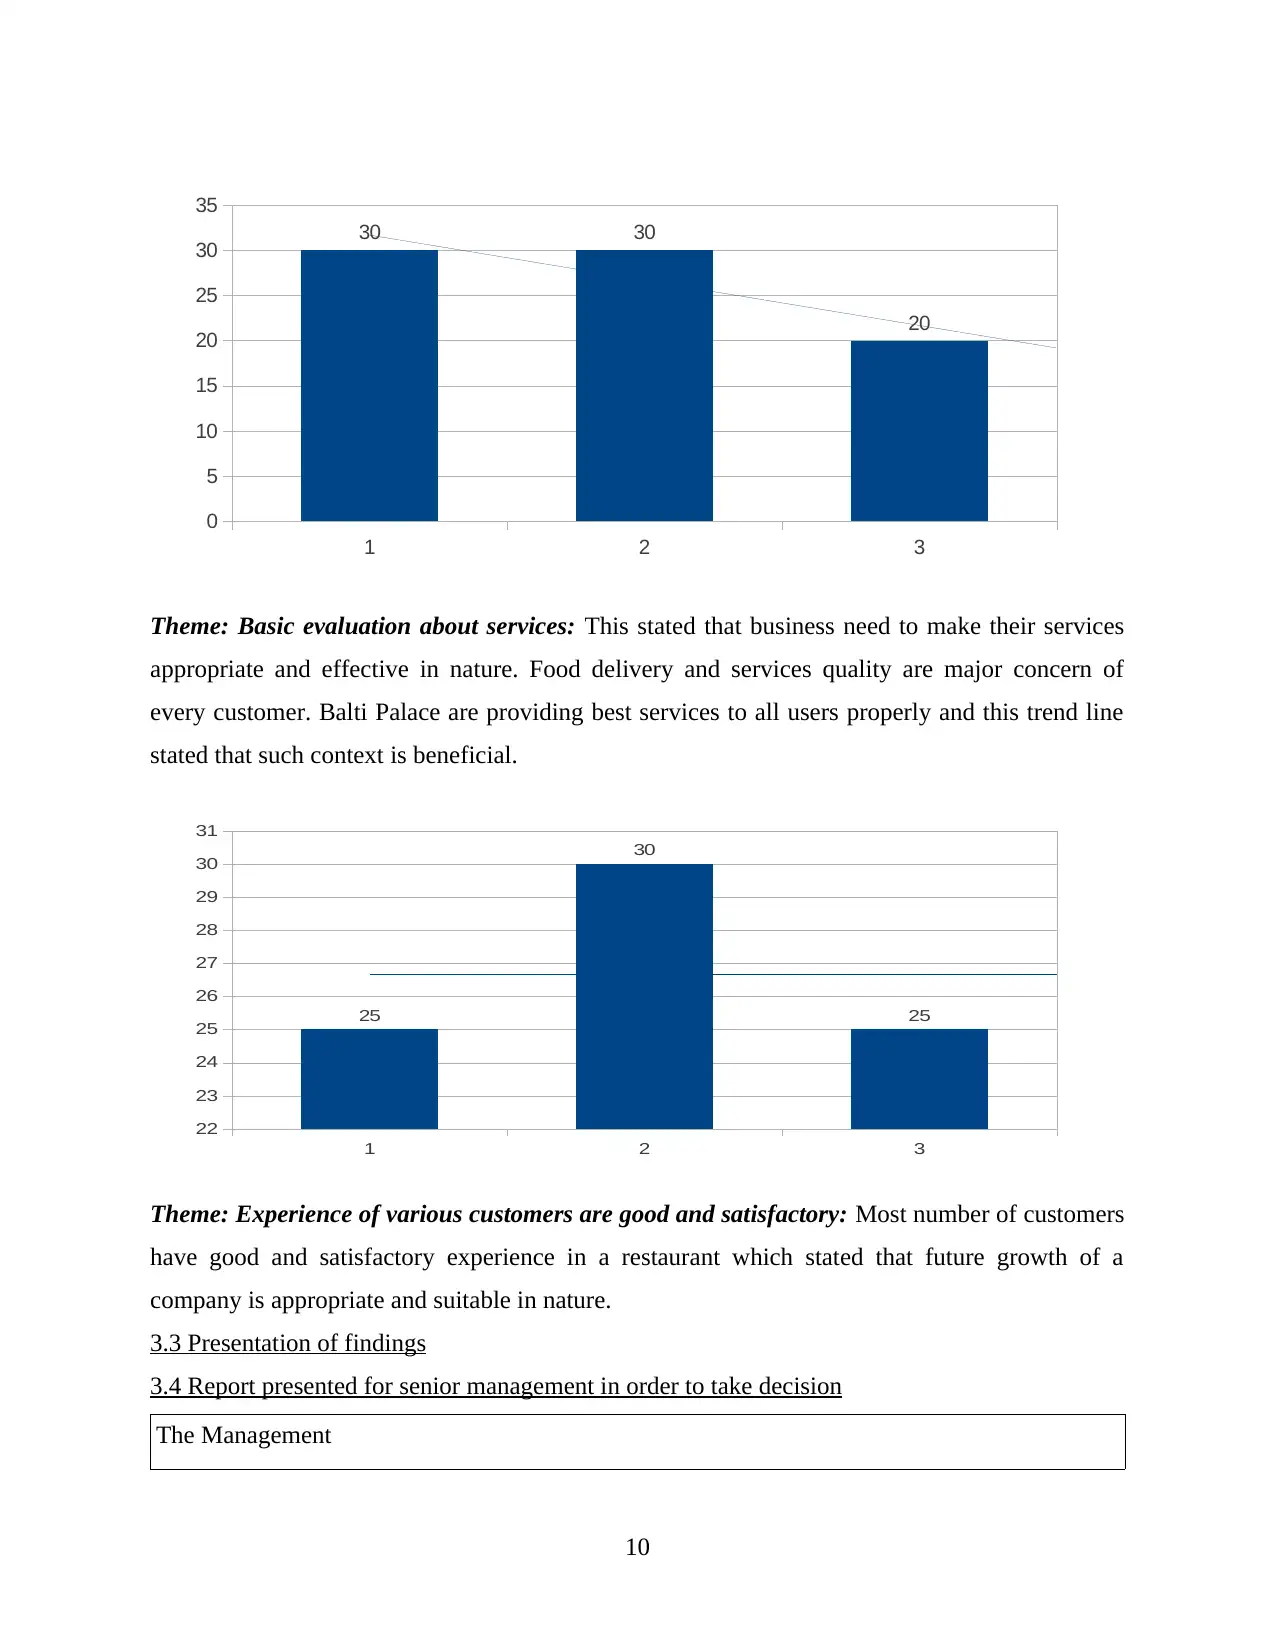
Theme: Basic evaluation about services: This stated that business need to make their services
appropriate and effective in nature. Food delivery and services quality are major concern of
every customer. Balti Palace are providing best services to all users properly and this trend line
stated that such context is beneficial.
1 2 3
22
23
24
25
26
27
28
29
30
31
25
30
25
Theme: Experience of various customers are good and satisfactory: Most number of customers
have good and satisfactory experience in a restaurant which stated that future growth of a
company is appropriate and suitable in nature.
3.3 Presentation of findings
3.4 Report presented for senior management in order to take decision
The Management
10
0
5
10
15
20
25
30
35
30 30
20
Theme: Basic evaluation about services: This stated that business need to make their services
appropriate and effective in nature. Food delivery and services quality are major concern of
every customer. Balti Palace are providing best services to all users properly and this trend line
stated that such context is beneficial.
1 2 3
22
23
24
25
26
27
28
29
30
31
25
30
25
Theme: Experience of various customers are good and satisfactory: Most number of customers
have good and satisfactory experience in a restaurant which stated that future growth of a
company is appropriate and suitable in nature.
3.3 Presentation of findings
3.4 Report presented for senior management in order to take decision
The Management
10
⊘ This is a preview!⊘
Do you want full access?
Subscribe today to unlock all pages.
Trusted by 1+ million students worldwide
1 out of 18
Related Documents


Your All-in-One AI-Powered Toolkit for Academic Success.
+13062052269
info@desklib.com
Available 24*7 on WhatsApp / Email
![[object Object]](/_next/static/media/star-bottom.7253800d.svg)
Unlock your academic potential
Copyright © 2020–2026 A2Z Services. All Rights Reserved. Developed and managed by ZUCOL.