Business Decision Making Report: Launching New Trainer Brand in London
VerifiedAdded on 2019/12/03
|20
|4578
|299
Report
AI Summary
This report presents a detailed analysis of business decision-making, focusing on the launch of a new trainer brand in London. It begins with an introduction to the subject and outlines the methodology, including primary and secondary data collection, survey methodology, and the use of a sampling questionnaire. The report then delves into data analysis, calculating mean, median, mode, measures of dispersion, and correlation coefficients. Visual representations such as line and bar graphs are used to illustrate sales, costs, and profit trends. The report also explores project management techniques, calculating project duration and critical paths. Furthermore, it presents the findings in a formal business report format and concludes with a discussion on the application of financial tools for decision-making, including IRR, NPV, and payback period analysis.

Business Decision Making
Paraphrase This Document
Need a fresh take? Get an instant paraphrase of this document with our AI Paraphraser
TABLE OF CONTENTS
Introduction......................................................................................................................................3
TASK 1............................................................................................................................................3
1.1 Planning for the collection of primary and secondary data...................................................3
1.2 Survey methodology and sampling frame.............................................................................3
1.3 Sampling questionnaire to be used .......................................................................................4
2.1 & 2.2 Calculating mean, median and mode..........................................................................5
2.3 Calculating measures of dispersion.......................................................................................6
2.4 Using quartile, percentile and correlation coefficient............................................................6
TASK 3............................................................................................................................................7
3.1, 4.1 Line/ Bar graphs using spreadsheets...............................................................................7
......................................................................................................................................................8
3.2 Trend lines using spreadsheet for sales, costs and profit ......................................................9
TASK 4..........................................................................................................................................11
4.2 Calculating the project duration and critical path ...............................................................11
........................................................................................................................................................13
3.3 Presenting the findings.........................................................................................................13
3.4 Formal business report ........................................................................................................13
TASK 5..........................................................................................................................................14
4.3 Using financial tools for decision making...........................................................................14
CONCLUSION..............................................................................................................................15
2
Illustration Index
Illustration 1: Line graph of sales, cost and profit...........................................................................9
Illustration 2: Bar graph of sales, cost and profit.............................................................................9
Illustration 3: Trend line of cost.....................................................................................................11
Illustration 4: Trend line for profit.................................................................................................11
Illustration 5: Trend line for sales..................................................................................................12
Illustration 6: Gantt chart...............................................................................................................14
Illustration 7: Critical path method................................................................................................14
Index of Tables
Table 1: Mean, mode and median....................................................................................................7
Table 2: Measures of dispersion......................................................................................................8
Table 3: Coefficient of correlation...................................................................................................8
Table 4: Table 4: Sales, cost and profit............................................................................................9
Table 5: Trend line table................................................................................................................11
Table 6: Activity table...................................................................................................................14
Table 7: IRR and NPV of project Super and Sonic.......................................................................17
Table 8: Payback period.................................................................................................................17
3
⊘ This is a preview!⊘
Do you want full access?
Subscribe today to unlock all pages.
Trusted by 1+ million students worldwide
INTRODUCTION
Business decision making is the imperative aspect which assists management to work
with integrity and take right decision in the direction of growth and success of the firm. Present
report is based on case study in which client wishes to launch new brand of trainers in London.
Thus report will cover the detail analysis regarding the market and marketing dynamics. Further,
analysis is done by collecting large amount of information through use of survey methodology.
In addition to this, forecasting is done for cost and profit analysis for the coming time span. It
proves to be effective in arranging necessary resources for business.
TASK 1
1.1 Planning for the collection of primary and secondary data
There are two types of data collected for the launching of new brand of trainers in
London. Here, both primary and secondary data will be collected in order to create strong
database. Primary data are those which are accessed first time in order to collect fresh and raw
data (Bazerman and Moore, 2012). On the other hand secondary are collected by using range of
sources which are already available. However, collection of primary data taken extensive time in
comparison to secondary data. Also, they are valid and authenticate enough for sowing evidence
for the study.
In this regard, primary data will be collected with the interaction of respondents
(Bojadziev and Bojadziev, 2007). It facilitates to understand the views and ideas of customers
and accordingly corporation can provide services to them. On the other hand, secondary data are
collecting by accessing wide range of secondary sources. It consists of journals, books and online
material.
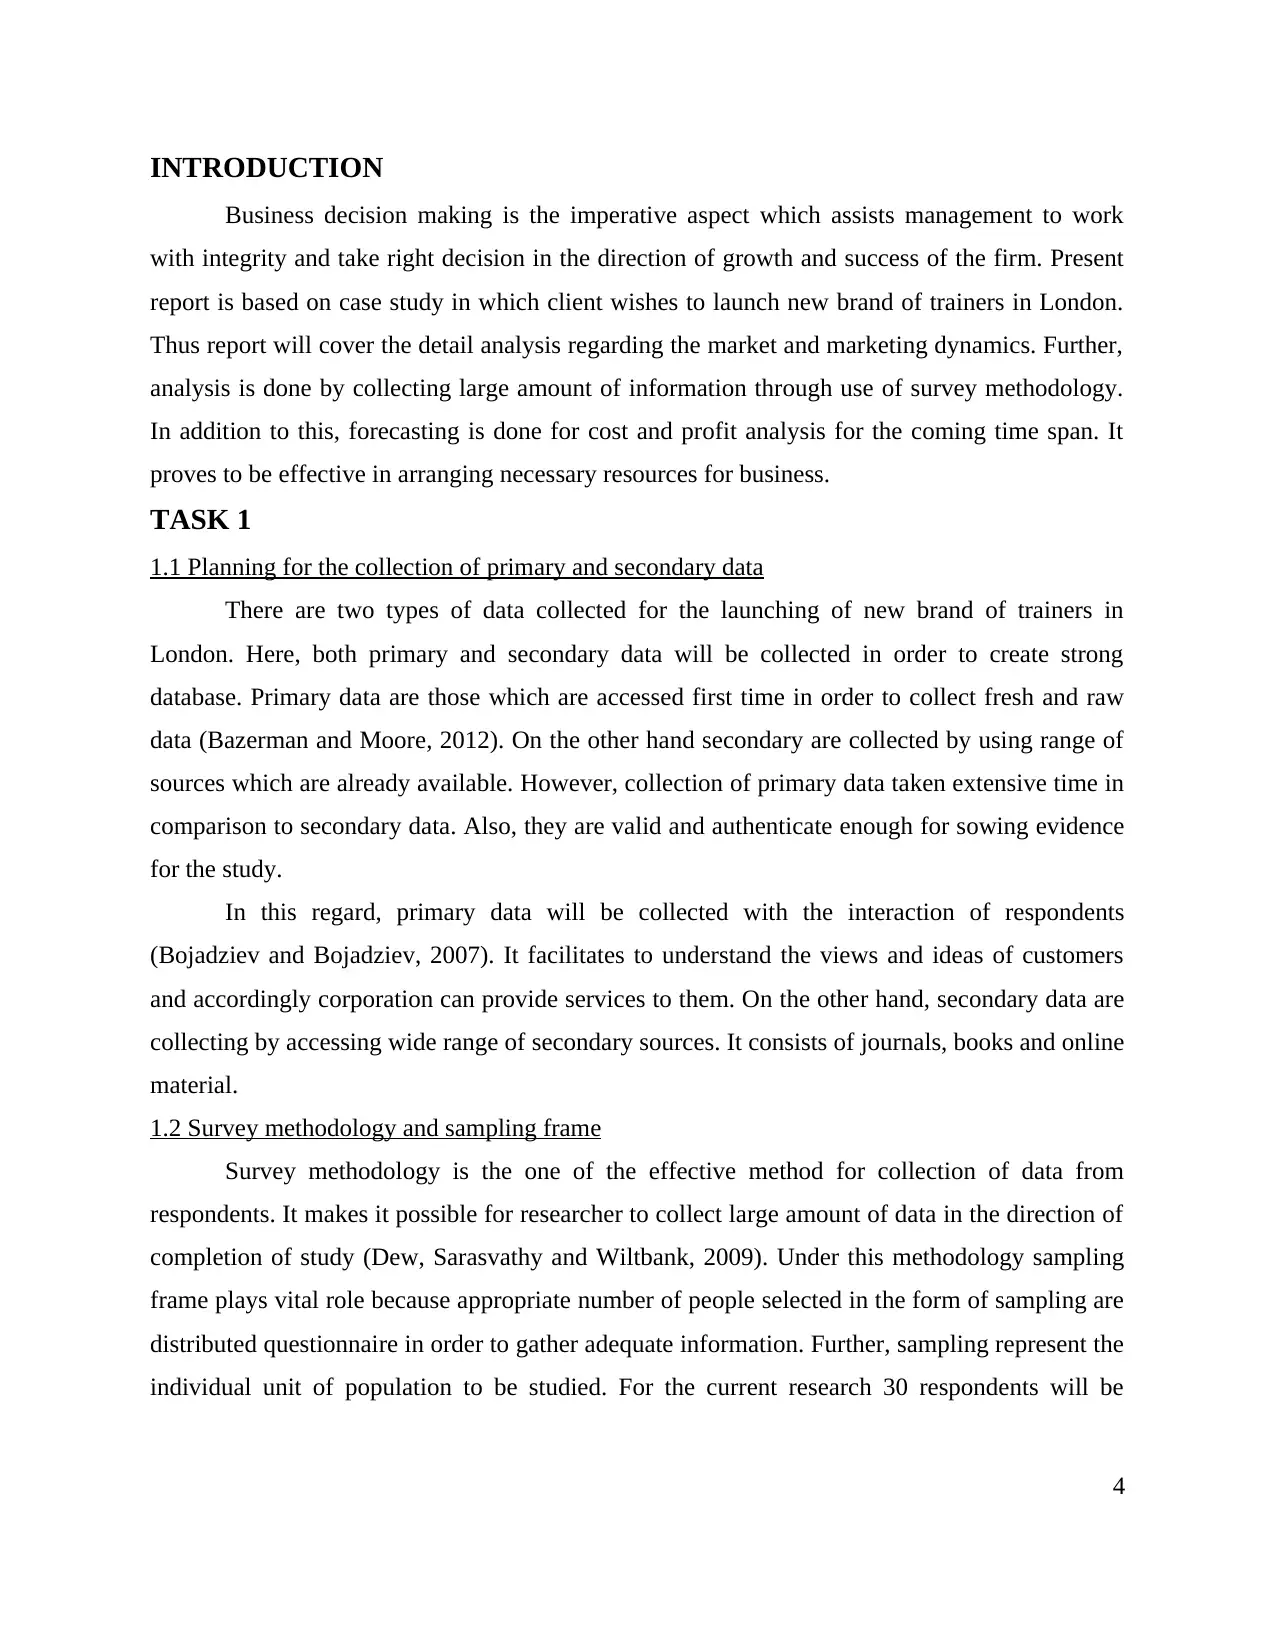
1.2 Survey methodology and sampling frame
Survey methodology is the one of the effective method for collection of data from
respondents. It makes it possible for researcher to collect large amount of data in the direction of
completion of study (Dew, Sarasvathy and Wiltbank, 2009). Under this methodology sampling
frame plays vital role because appropriate number of people selected in the form of sampling are
distributed questionnaire in order to gather adequate information. Further, sampling represent the
individual unit of population to be studied. For the current research 30 respondents will be
4
Business decision making is the imperative aspect which assists management to work
with integrity and take right decision in the direction of growth and success of the firm. Present
report is based on case study in which client wishes to launch new brand of trainers in London.
Thus report will cover the detail analysis regarding the market and marketing dynamics. Further,
analysis is done by collecting large amount of information through use of survey methodology.
In addition to this, forecasting is done for cost and profit analysis for the coming time span. It
proves to be effective in arranging necessary resources for business.
TASK 1
1.1 Planning for the collection of primary and secondary data
There are two types of data collected for the launching of new brand of trainers in
London. Here, both primary and secondary data will be collected in order to create strong
database. Primary data are those which are accessed first time in order to collect fresh and raw
data (Bazerman and Moore, 2012). On the other hand secondary are collected by using range of
sources which are already available. However, collection of primary data taken extensive time in
comparison to secondary data. Also, they are valid and authenticate enough for sowing evidence
for the study.
In this regard, primary data will be collected with the interaction of respondents
(Bojadziev and Bojadziev, 2007). It facilitates to understand the views and ideas of customers
and accordingly corporation can provide services to them. On the other hand, secondary data are
collecting by accessing wide range of secondary sources. It consists of journals, books and online
material.
1.2 Survey methodology and sampling frame
Survey methodology is the one of the effective method for collection of data from
respondents. It makes it possible for researcher to collect large amount of data in the direction of
completion of study (Dew, Sarasvathy and Wiltbank, 2009). Under this methodology sampling
frame plays vital role because appropriate number of people selected in the form of sampling are
distributed questionnaire in order to gather adequate information. Further, sampling represent the
individual unit of population to be studied. For the current research 30 respondents will be
4
Paraphrase This Document
Need a fresh take? Get an instant paraphrase of this document with our AI Paraphraser
selected with the use of simple random sampling (Selecting the Survey Method, 2006). Here,
local will be selected because they can easily provide information regarding the services to be
provided to them in future. It enables scholars to approach respondents and conduct in-depth
survey with them (O’Fallon and Butterfield, 2005). However, respondents will be approached
through online survey and accordingly they will be provided questionnaire. Here, they will be
provided list of related questions so they can easily fill the same in order to meet the purpose of
research. In addition to this, respondents will be provided prior information regarding purpose of
survey.
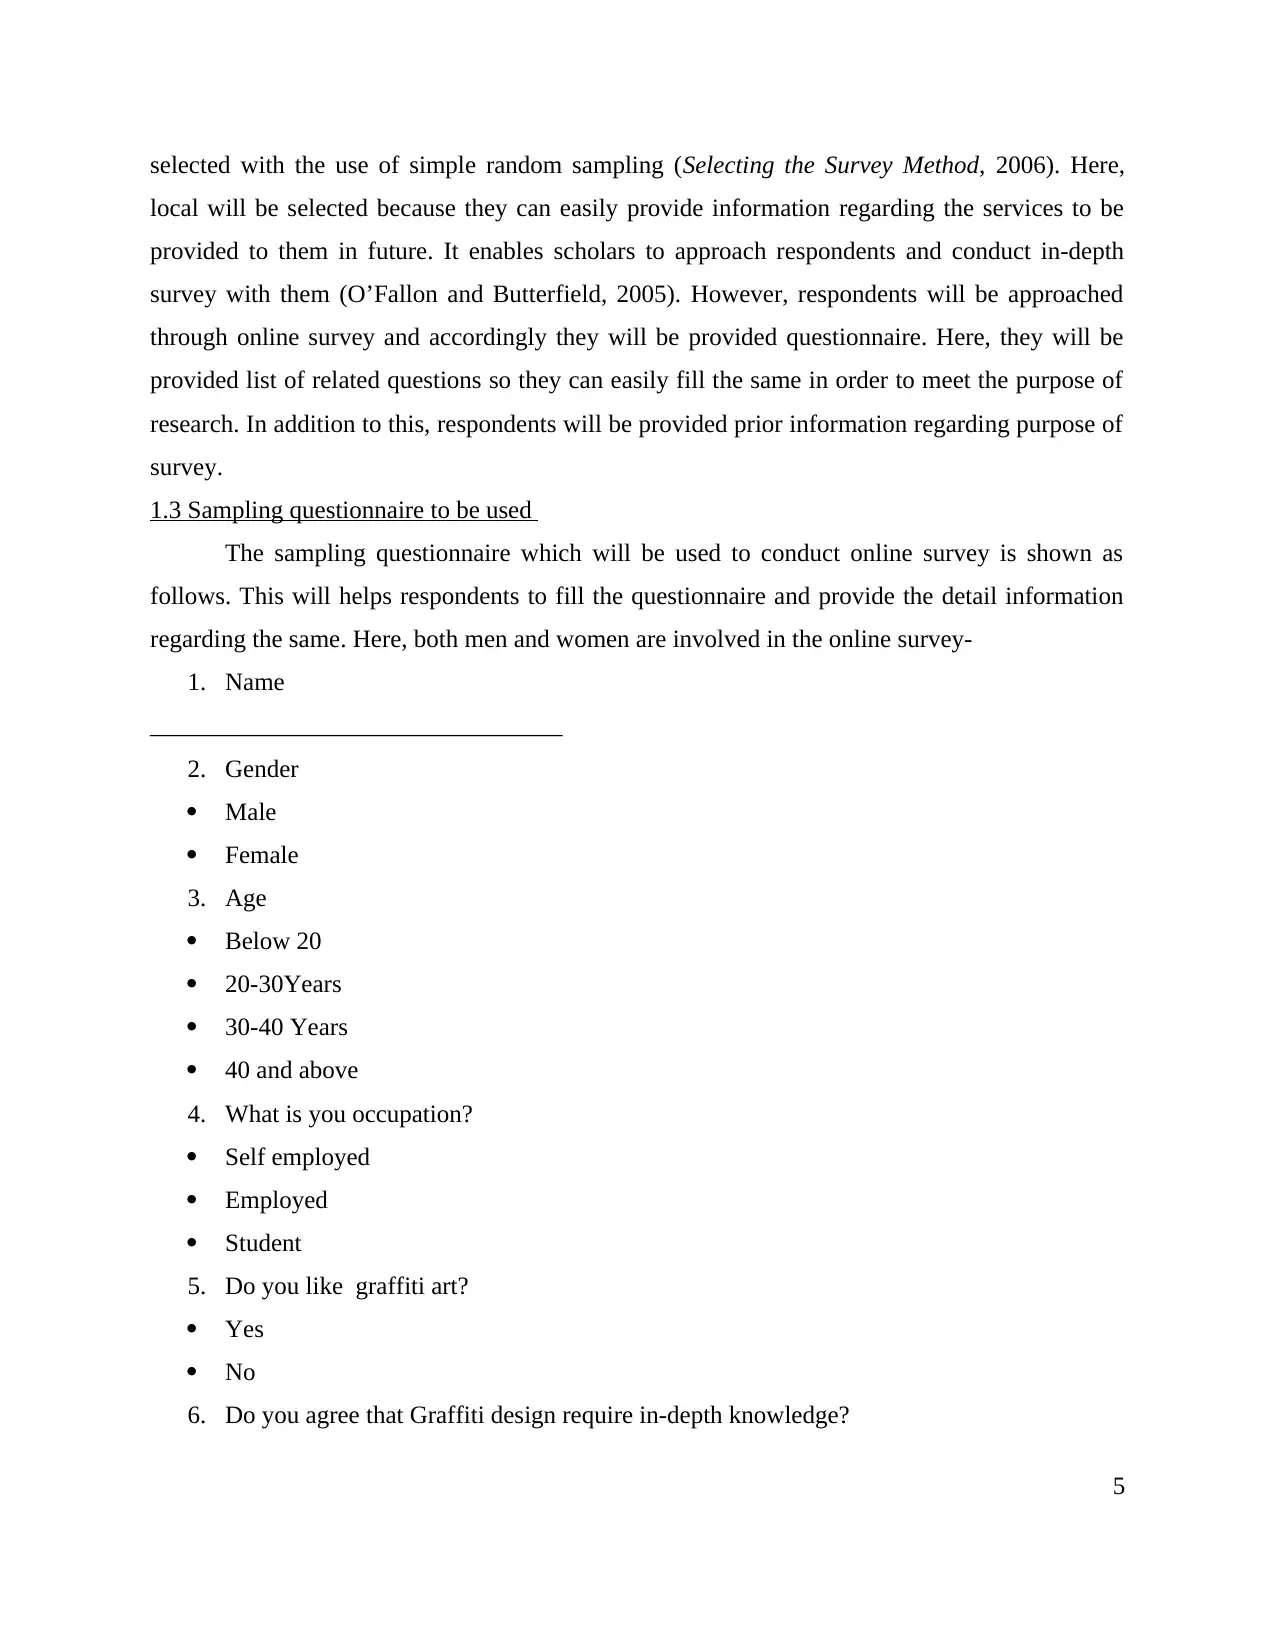
1.3 Sampling questionnaire to be used
The sampling questionnaire which will be used to conduct online survey is shown as
follows. This will helps respondents to fill the questionnaire and provide the detail information
regarding the same. Here, both men and women are involved in the online survey-
1. Name
_________________________________
2. Gender
Male
Female
3. Age
Below 20
20-30Years
30-40 Years
40 and above
4. What is you occupation?
Self employed
Employed
Student
5. Do you like graffiti art?
Yes
No
6. Do you agree that Graffiti design require in-depth knowledge?
5
local will be selected because they can easily provide information regarding the services to be
provided to them in future. It enables scholars to approach respondents and conduct in-depth
survey with them (O’Fallon and Butterfield, 2005). However, respondents will be approached
through online survey and accordingly they will be provided questionnaire. Here, they will be
provided list of related questions so they can easily fill the same in order to meet the purpose of
research. In addition to this, respondents will be provided prior information regarding purpose of
survey.
1.3 Sampling questionnaire to be used
The sampling questionnaire which will be used to conduct online survey is shown as
follows. This will helps respondents to fill the questionnaire and provide the detail information
regarding the same. Here, both men and women are involved in the online survey-
1. Name
_________________________________
2. Gender
Male
Female
3. Age
Below 20
20-30Years
30-40 Years
40 and above
4. What is you occupation?
Self employed
Employed
Student
5. Do you like graffiti art?
Yes
No
6. Do you agree that Graffiti design require in-depth knowledge?
5
Strongly agree
Agree
Neutral
Disagree
Strongly disagree
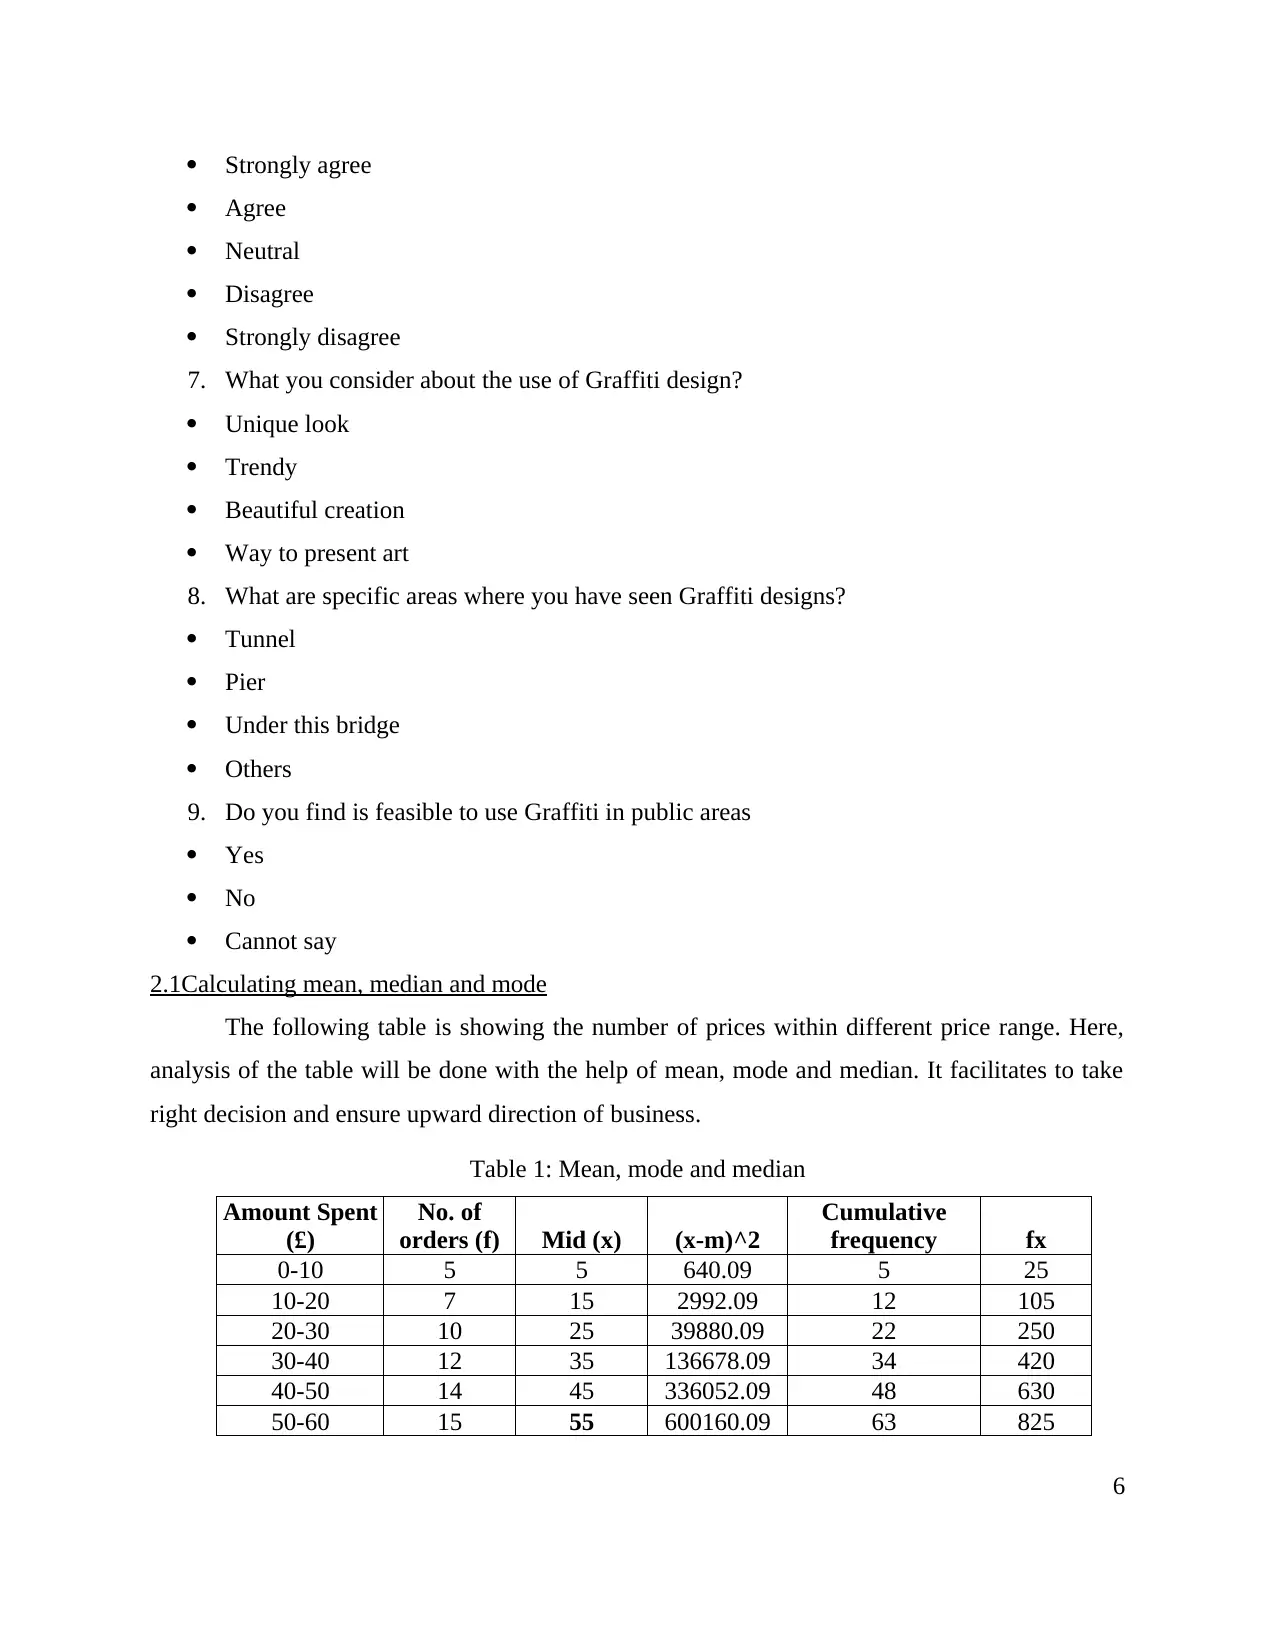
7. What you consider about the use of Graffiti design?
Unique look
Trendy
Beautiful creation
Way to present art
8. What are specific areas where you have seen Graffiti designs?
Tunnel
Pier
Under this bridge
Others
9. Do you find is feasible to use Graffiti in public areas
Yes
No
Cannot say
2.1Calculating mean, median and mode
The following table is showing the number of prices within different price range. Here,
analysis of the table will be done with the help of mean, mode and median. It facilitates to take
right decision and ensure upward direction of business.
Table 1: Mean, mode and median
Amount Spent
(£)
No. of
orders (f) Mid (x) (x-m)^2
Cumulative
frequency fx
0-10 5 5 640.09 5 25
10-20 7 15 2992.09 12 105
20-30 10 25 39880.09 22 250
30-40 12 35 136678.09 34 420
40-50 14 45 336052.09 48 630
50-60 15 55 600160.09 63 825
6
Agree
Neutral
Disagree
Strongly disagree
7. What you consider about the use of Graffiti design?
Unique look
Trendy
Beautiful creation
Way to present art
8. What are specific areas where you have seen Graffiti designs?
Tunnel
Pier
Under this bridge
Others
9. Do you find is feasible to use Graffiti in public areas
Yes
No
Cannot say
2.1Calculating mean, median and mode
The following table is showing the number of prices within different price range. Here,
analysis of the table will be done with the help of mean, mode and median. It facilitates to take
right decision and ensure upward direction of business.
Table 1: Mean, mode and median
Amount Spent
(£)
No. of
orders (f) Mid (x) (x-m)^2
Cumulative
frequency fx
0-10 5 5 640.09 5 25
10-20 7 15 2992.09 12 105
20-30 10 25 39880.09 22 250
30-40 12 35 136678.09 34 420
40-50 14 45 336052.09 48 630
50-60 15 55 600160.09 63 825
6
⊘ This is a preview!⊘
Do you want full access?
Subscribe today to unlock all pages.
Trusted by 1+ million students worldwide
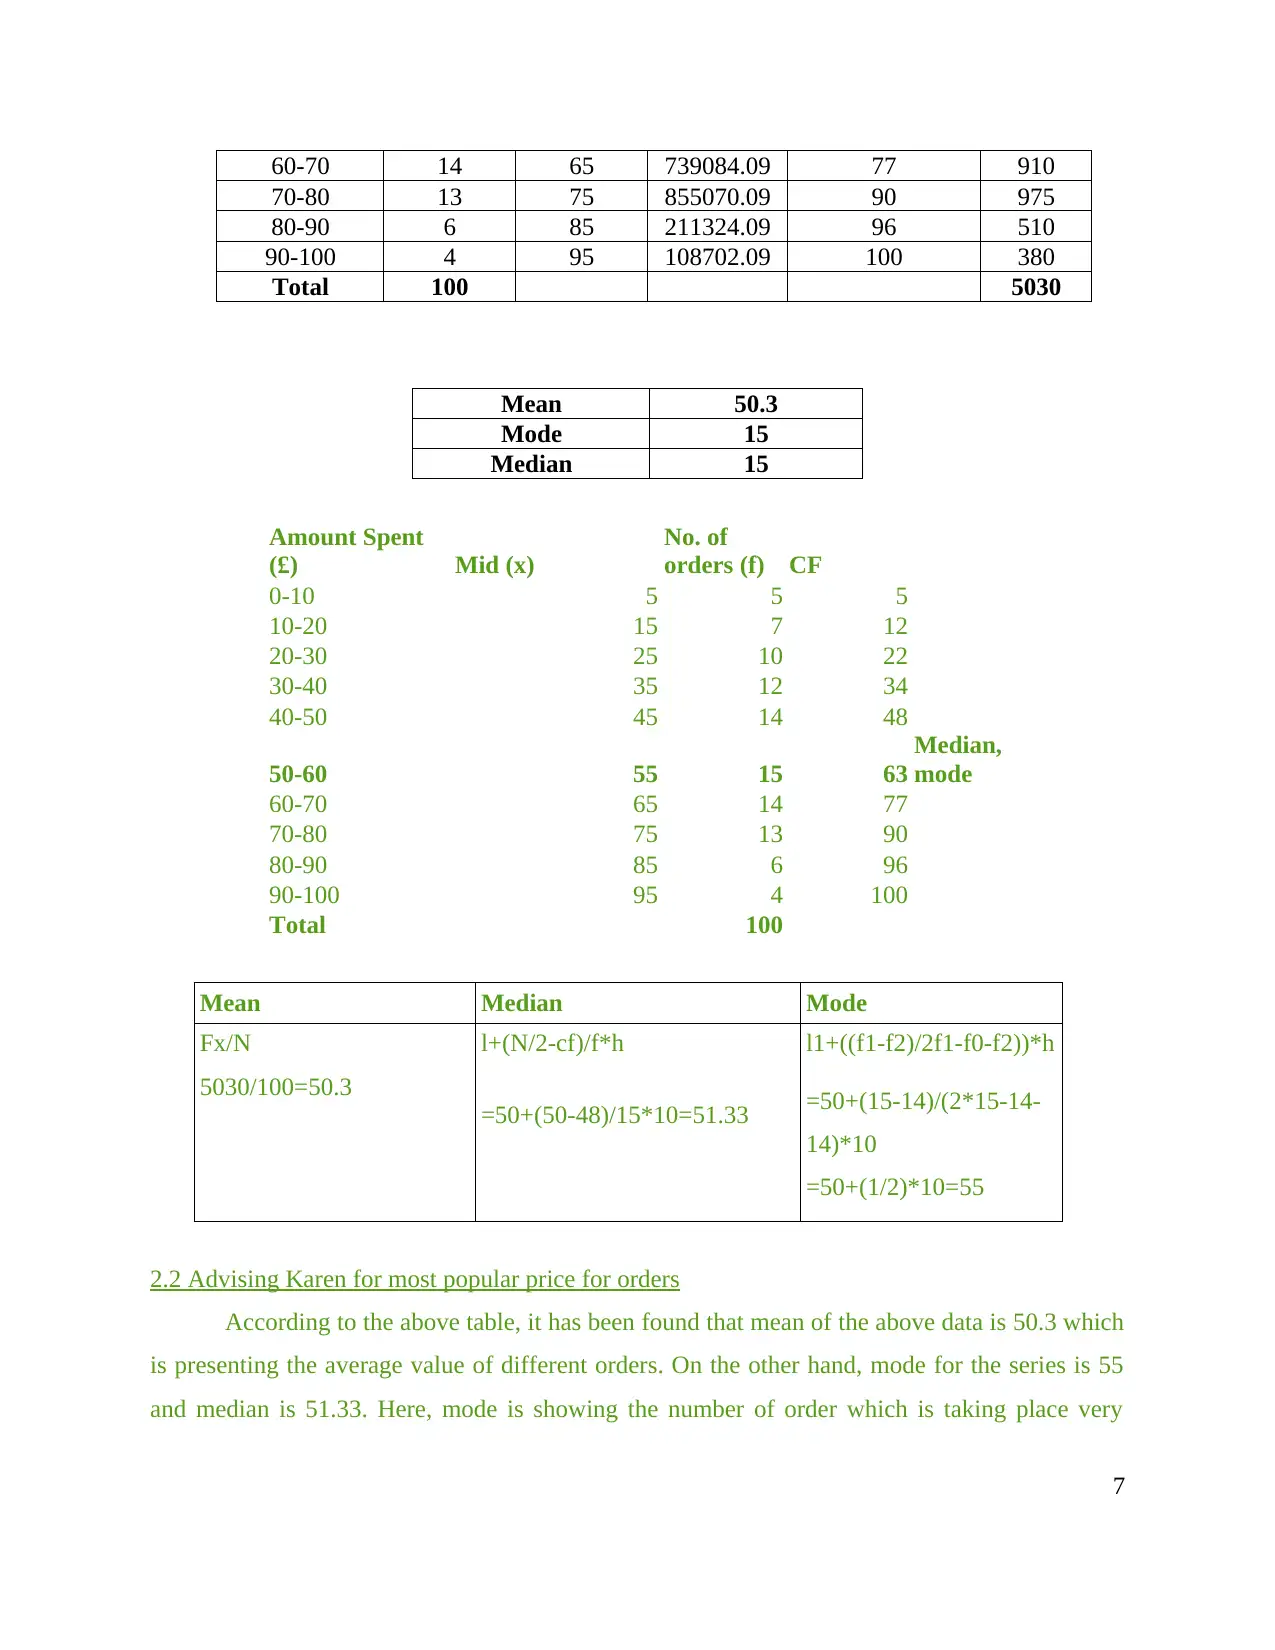
60-70 14 65 739084.09 77 910
70-80 13 75 855070.09 90 975
80-90 6 85 211324.09 96 510
90-100 4 95 108702.09 100 380
Total 100 5030
Mean 50.3
Mode 15
Median 15
Amount Spent
(£) Mid (x)
No. of
orders (f) CF
0-10 5 5 5
10-20 15 7 12
20-30 25 10 22
30-40 35 12 34
40-50 45 14 48
50-60 55 15 63
Median,
mode
60-70 65 14 77
70-80 75 13 90
80-90 85 6 96
90-100 95 4 100
Total 100
Mean Median Mode
Fx/N
5030/100=50.3
l+(N/2-cf)/f*h
=50+(50-48)/15*10=51.33
l1+((f1-f2)/2f1-f0-f2))*h
=50+(15-14)/(2*15-14-
14)*10
=50+(1/2)*10=55
2.2 Advising Karen for most popular price for orders
According to the above table, it has been found that mean of the above data is 50.3 which
is presenting the average value of different orders. On the other hand, mode for the series is 55
and median is 51.33. Here, mode is showing the number of order which is taking place very
7
Paraphrase This Document
Need a fresh take? Get an instant paraphrase of this document with our AI Paraphraser
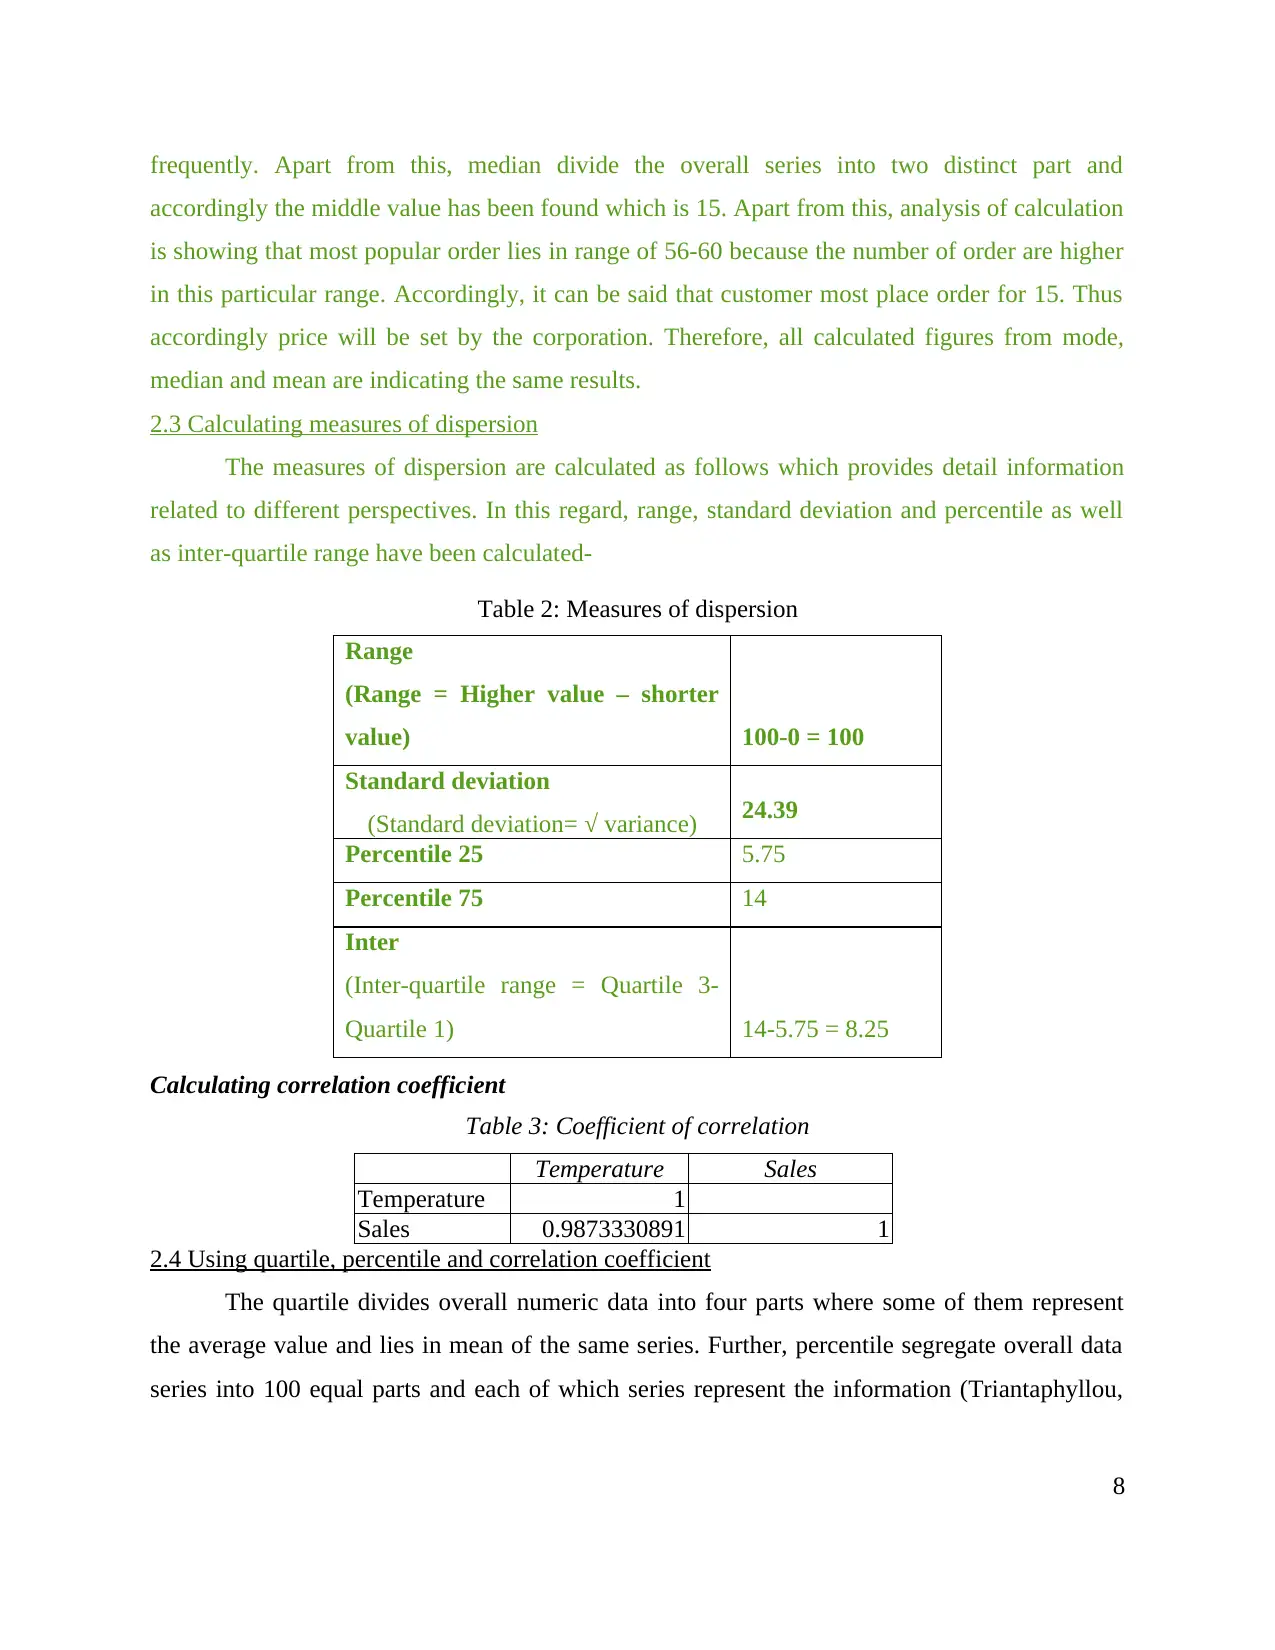
frequently. Apart from this, median divide the overall series into two distinct part and
accordingly the middle value has been found which is 15. Apart from this, analysis of calculation
is showing that most popular order lies in range of 56-60 because the number of order are higher
in this particular range. Accordingly, it can be said that customer most place order for 15. Thus
accordingly price will be set by the corporation. Therefore, all calculated figures from mode,
median and mean are indicating the same results.
2.3 Calculating measures of dispersion
The measures of dispersion are calculated as follows which provides detail information
related to different perspectives. In this regard, range, standard deviation and percentile as well
as inter-quartile range have been calculated-
Table 2: Measures of dispersion
Range
(Range = Higher value – shorter
value) 100-0 = 100
Standard deviation
(Standard deviation= √ variance) 24.39
Percentile 25 5.75
Percentile 75 14
Inter
(Inter-quartile range = Quartile 3-
Quartile 1) 14-5.75 = 8.25
Calculating correlation coefficient
Table 3: Coefficient of correlation
Temperature Sales
Temperature 1
Sales 0.9873330891 1
2.4 Using quartile, percentile and correlation coefficient
The quartile divides overall numeric data into four parts where some of them represent
the average value and lies in mean of the same series. Further, percentile segregate overall data
series into 100 equal parts and each of which series represent the information (Triantaphyllou,
8
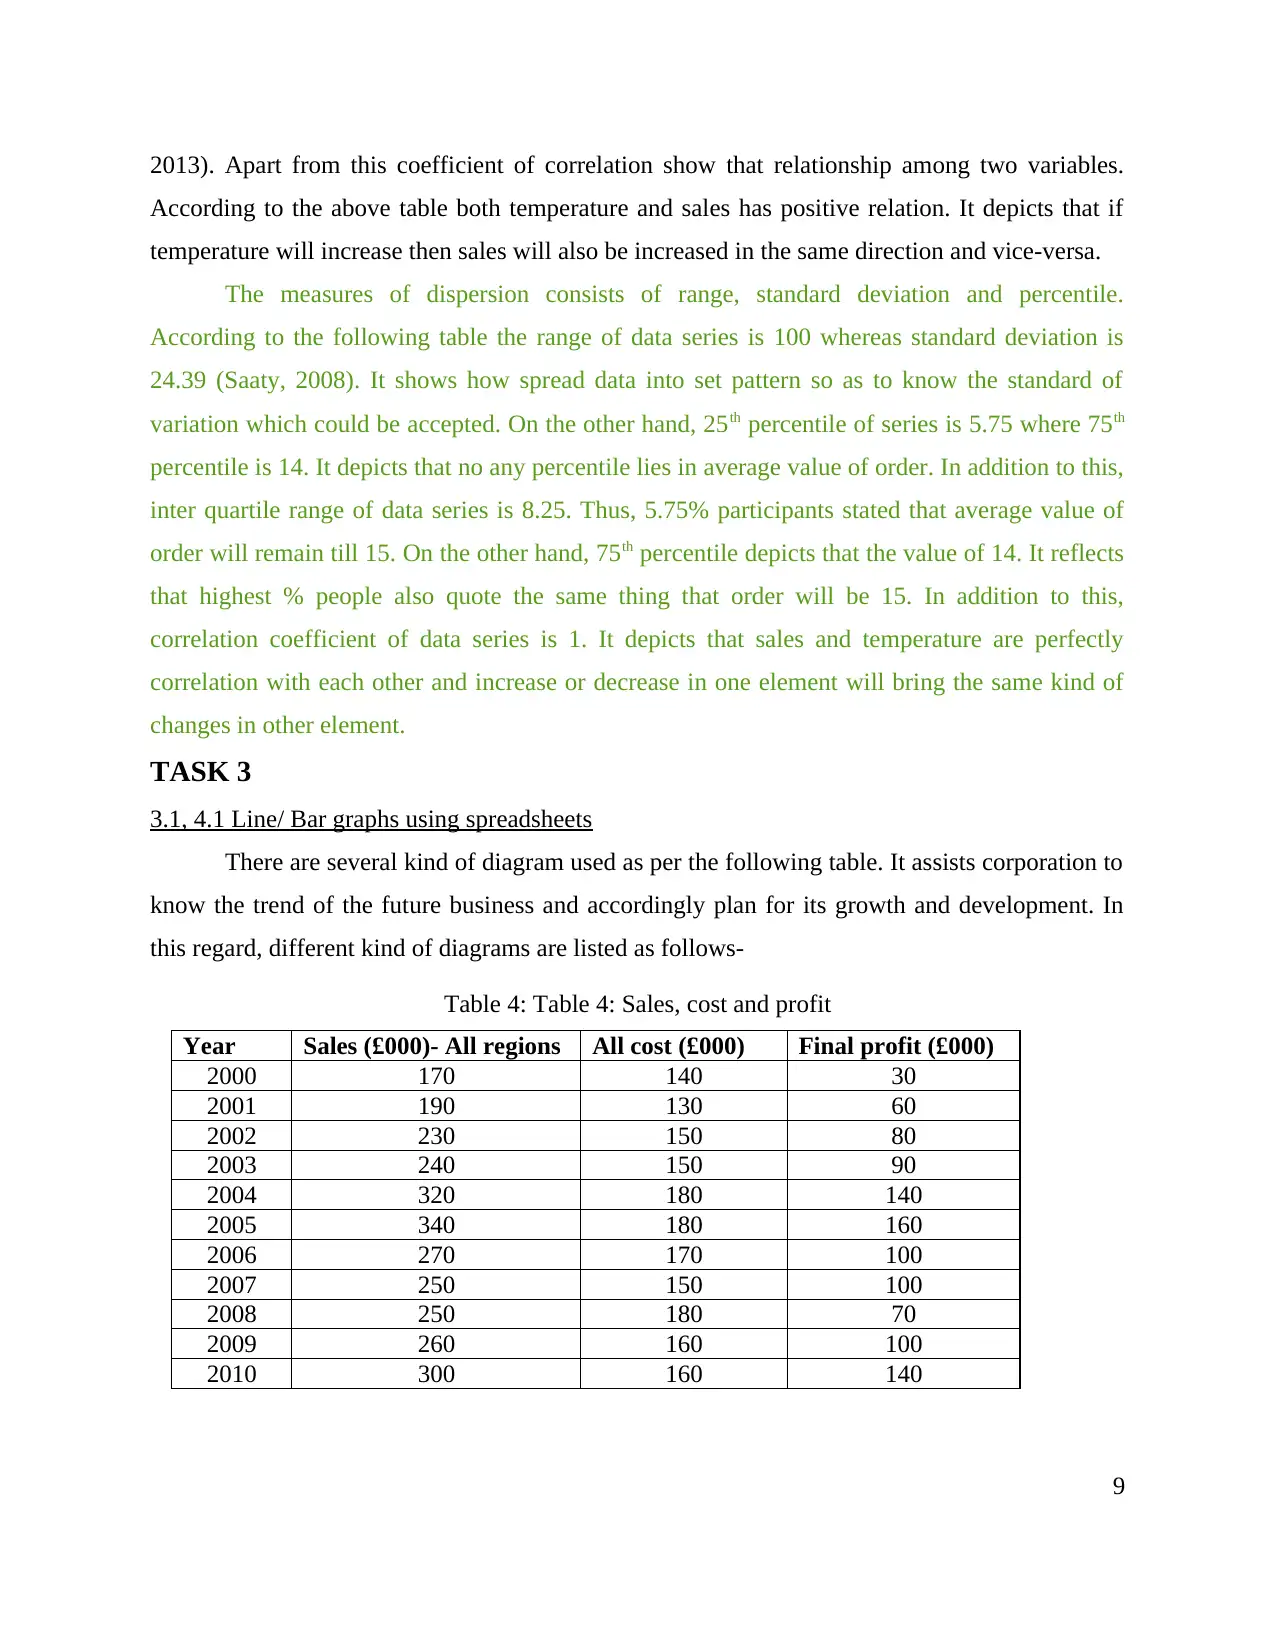
2013). Apart from this coefficient of correlation show that relationship among two variables.
According to the above table both temperature and sales has positive relation. It depicts that if
temperature will increase then sales will also be increased in the same direction and vice-versa.
The measures of dispersion consists of range, standard deviation and percentile.
According to the following table the range of data series is 100 whereas standard deviation is
24.39 (Saaty, 2008). It shows how spread data into set pattern so as to know the standard of
variation which could be accepted. On the other hand, 25th percentile of series is 5.75 where 75th
percentile is 14. It depicts that no any percentile lies in average value of order. In addition to this,
inter quartile range of data series is 8.25. Thus, 5.75% participants stated that average value of
order will remain till 15. On the other hand, 75th percentile depicts that the value of 14. It reflects
that highest % people also quote the same thing that order will be 15. In addition to this,
correlation coefficient of data series is 1. It depicts that sales and temperature are perfectly
correlation with each other and increase or decrease in one element will bring the same kind of
changes in other element.
TASK 3
3.1, 4.1 Line/ Bar graphs using spreadsheets
There are several kind of diagram used as per the following table. It assists corporation to
know the trend of the future business and accordingly plan for its growth and development. In
this regard, different kind of diagrams are listed as follows-
Table 4: Table 4: Sales, cost and profit
Year Sales (£000)- All regions All cost (£000) Final profit (£000)
2000 170 140 30
2001 190 130 60
2002 230 150 80
2003 240 150 90
2004 320 180 140
2005 340 180 160
2006 270 170 100
2007 250 150 100
2008 250 180 70
2009 260 160 100
2010 300 160 140
9
⊘ This is a preview!⊘
Do you want full access?
Subscribe today to unlock all pages.
Trusted by 1+ million students worldwide
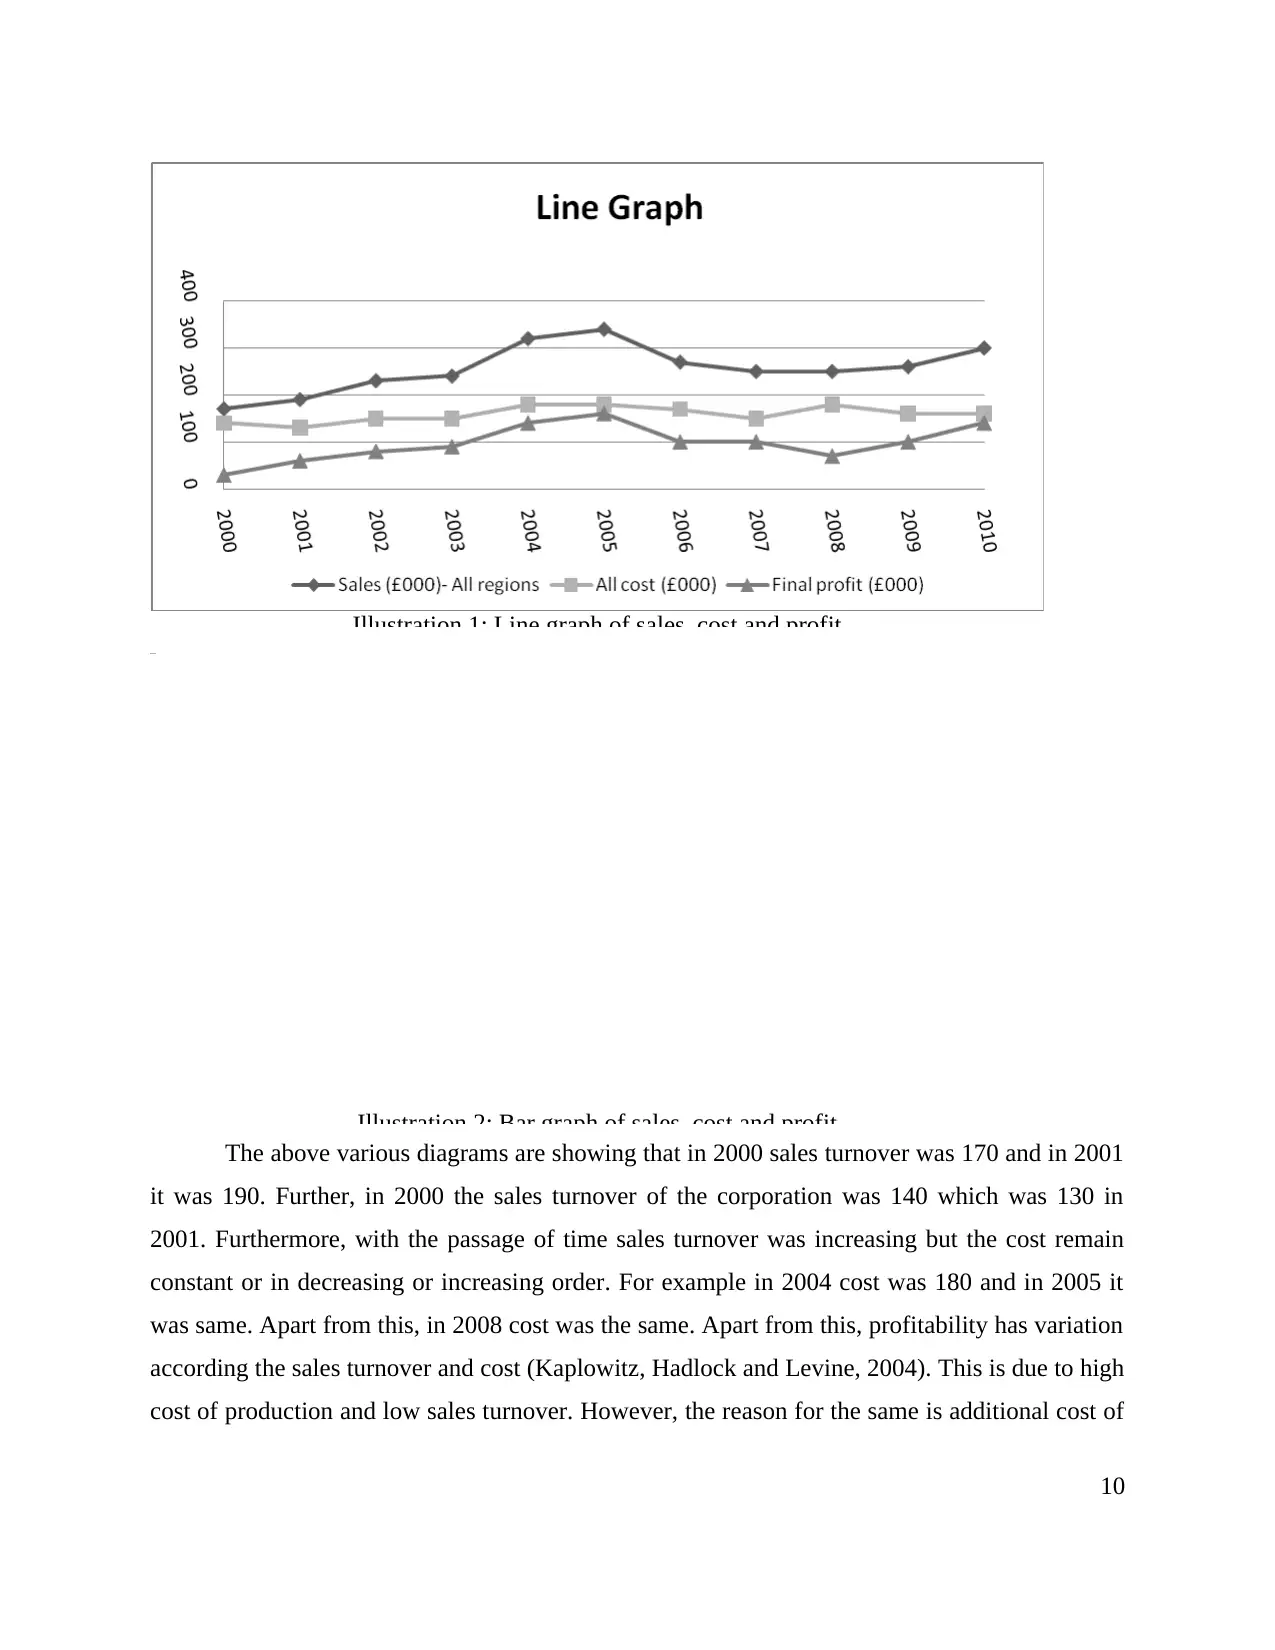
Illustration 1: Line graph of sales, cost and profit
Illustration 2: Bar graph of sales, cost and profit
The above various diagrams are showing that in 2000 sales turnover was 170 and in 2001
it was 190. Further, in 2000 the sales turnover of the corporation was 140 which was 130 in
2001. Furthermore, with the passage of time sales turnover was increasing but the cost remain
constant or in decreasing or increasing order. For example in 2004 cost was 180 and in 2005 it
was same. Apart from this, in 2008 cost was the same. Apart from this, profitability has variation
according the sales turnover and cost (Kaplowitz, Hadlock and Levine, 2004). This is due to high
cost of production and low sales turnover. However, the reason for the same is additional cost of
10
Paraphrase This Document
Need a fresh take? Get an instant paraphrase of this document with our AI Paraphraser
production. In addition to this, final profit in 2008 was 70 which again increased in later years as
2009 and 2010. Therefore, trend of profit and cost has great variations. Thus financial position of
Omega consultant is varying at greater level and accordingly future performance of corporation
can be anticipated effectively.
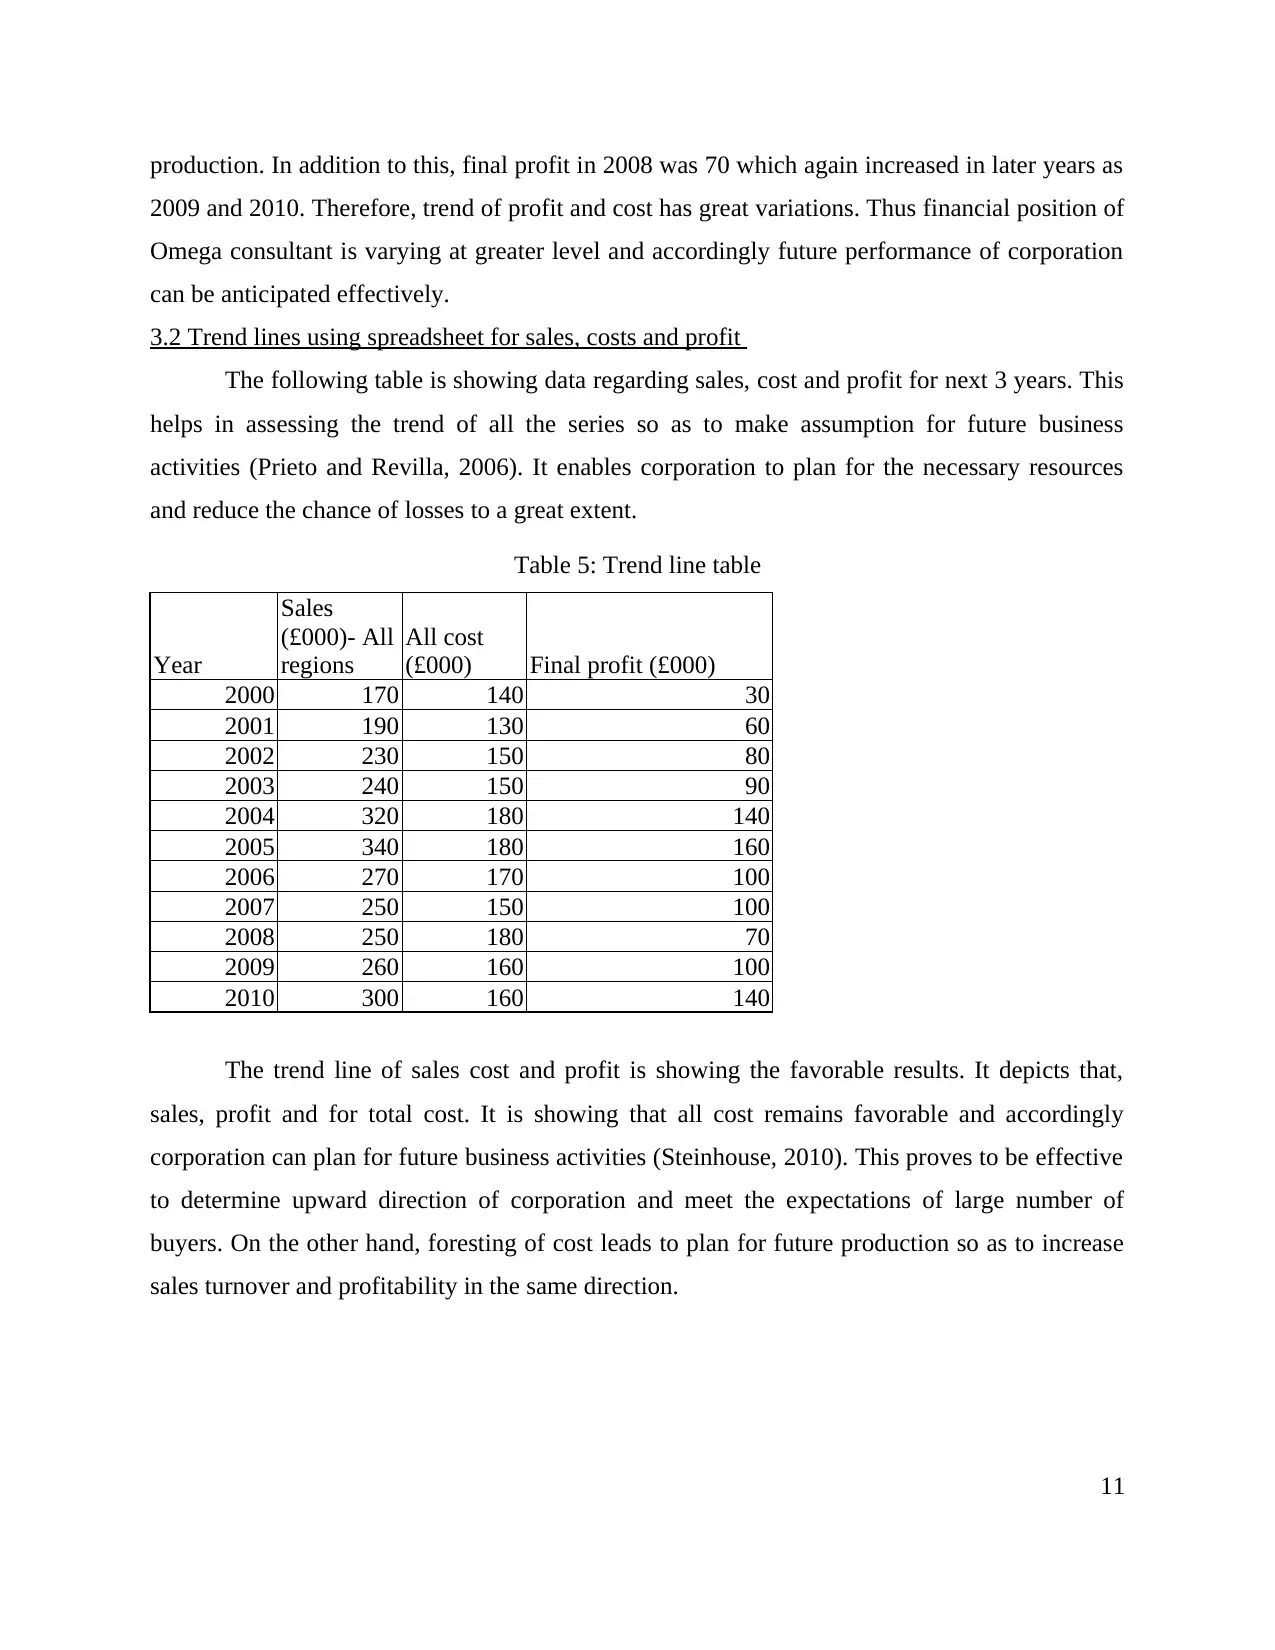
3.2 Trend lines using spreadsheet for sales, costs and profit
The following table is showing data regarding sales, cost and profit for next 3 years. This
helps in assessing the trend of all the series so as to make assumption for future business
activities (Prieto and Revilla, 2006). It enables corporation to plan for the necessary resources
and reduce the chance of losses to a great extent.
Table 5: Trend line table
Year
Sales
(£000)- All
regions
All cost
(£000) Final profit (£000)
2000 170 140 30
2001 190 130 60
2002 230 150 80
2003 240 150 90
2004 320 180 140
2005 340 180 160
2006 270 170 100
2007 250 150 100
2008 250 180 70
2009 260 160 100
2010 300 160 140
The trend line of sales cost and profit is showing the favorable results. It depicts that,
sales, profit and for total cost. It is showing that all cost remains favorable and accordingly
corporation can plan for future business activities (Steinhouse, 2010). This proves to be effective
to determine upward direction of corporation and meet the expectations of large number of
buyers. On the other hand, foresting of cost leads to plan for future production so as to increase
sales turnover and profitability in the same direction.
11
2009 and 2010. Therefore, trend of profit and cost has great variations. Thus financial position of
Omega consultant is varying at greater level and accordingly future performance of corporation
can be anticipated effectively.
3.2 Trend lines using spreadsheet for sales, costs and profit
The following table is showing data regarding sales, cost and profit for next 3 years. This
helps in assessing the trend of all the series so as to make assumption for future business
activities (Prieto and Revilla, 2006). It enables corporation to plan for the necessary resources
and reduce the chance of losses to a great extent.
Table 5: Trend line table
Year
Sales
(£000)- All
regions
All cost
(£000) Final profit (£000)
2000 170 140 30
2001 190 130 60
2002 230 150 80
2003 240 150 90
2004 320 180 140
2005 340 180 160
2006 270 170 100
2007 250 150 100
2008 250 180 70
2009 260 160 100
2010 300 160 140
The trend line of sales cost and profit is showing the favorable results. It depicts that,
sales, profit and for total cost. It is showing that all cost remains favorable and accordingly
corporation can plan for future business activities (Steinhouse, 2010). This proves to be effective
to determine upward direction of corporation and meet the expectations of large number of
buyers. On the other hand, foresting of cost leads to plan for future production so as to increase
sales turnover and profitability in the same direction.
11
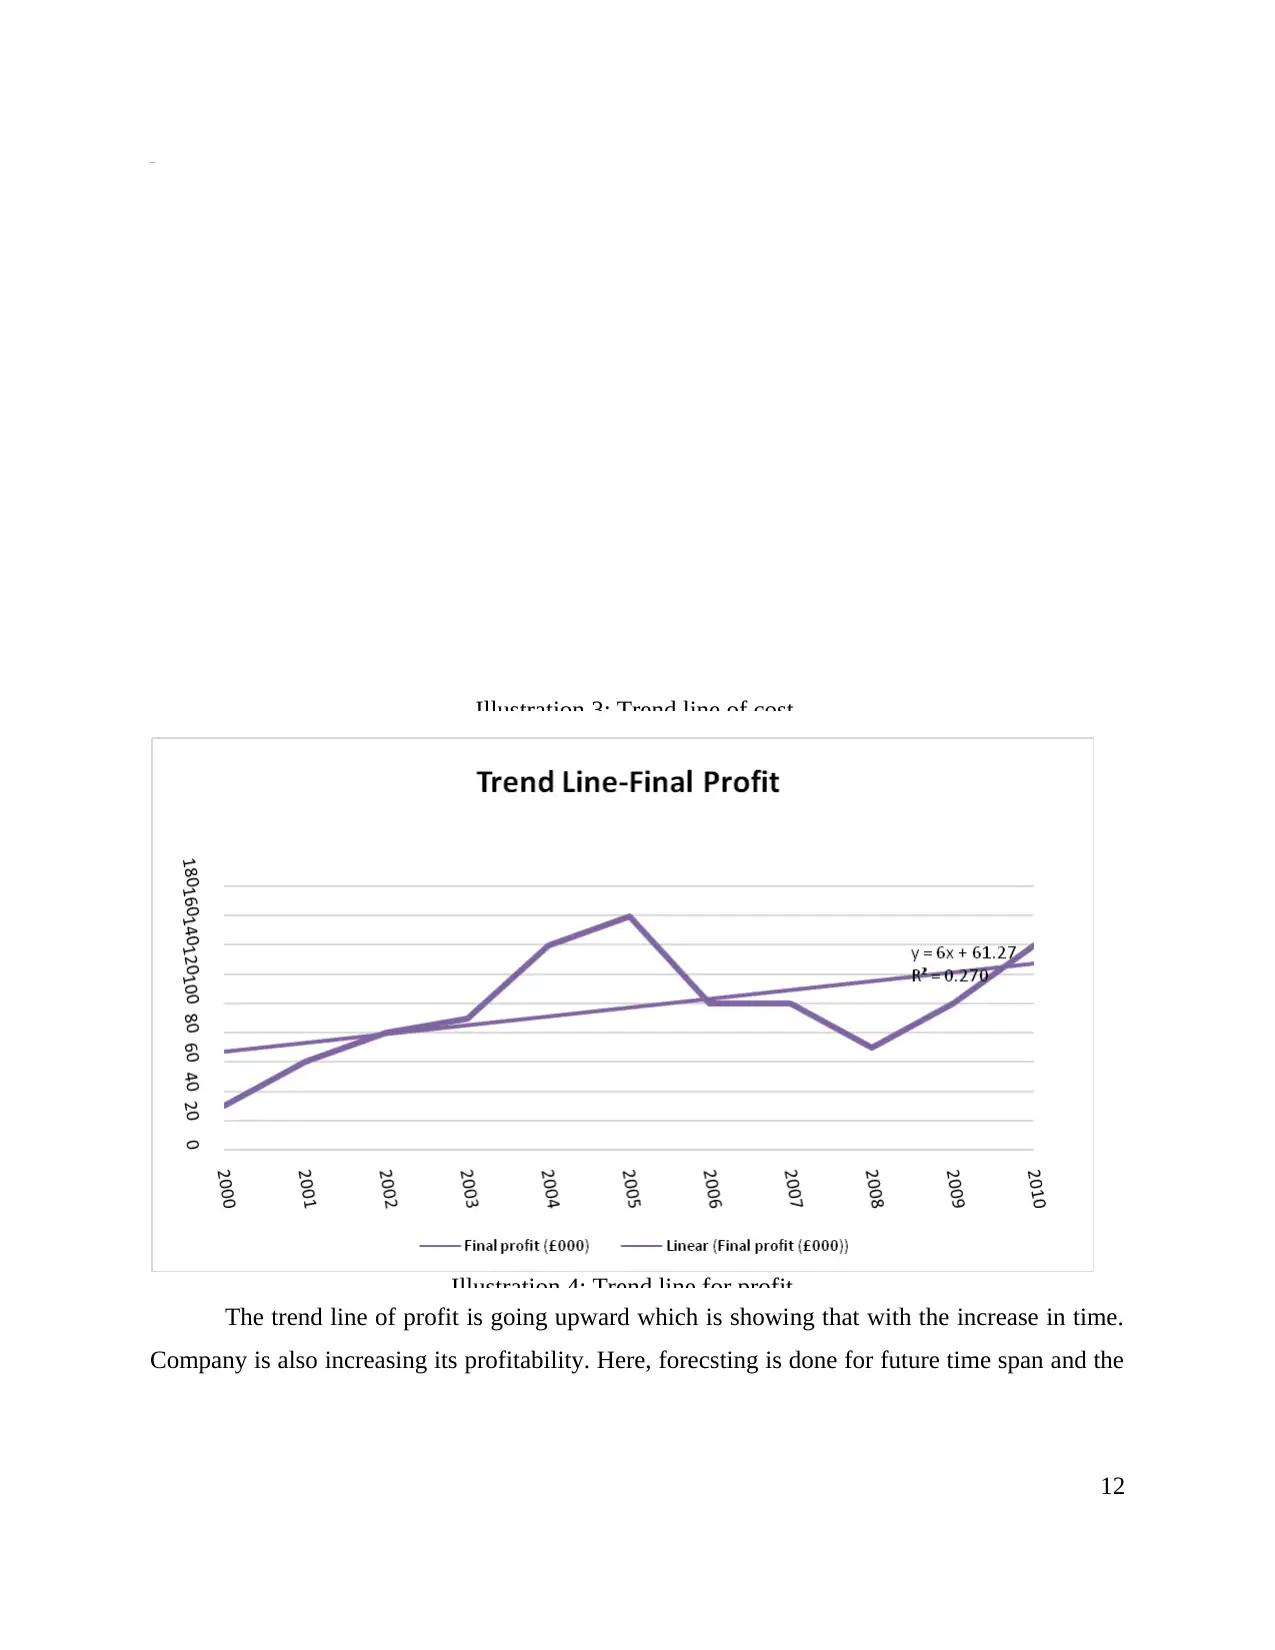
Illustration 3: Trend line of cost
Illustration 4: Trend line for profit
The trend line of profit is going upward which is showing that with the increase in time.
Company is also increasing its profitability. Here, forecsting is done for future time span and the
12
Illustration 4: Trend line for profit
The trend line of profit is going upward which is showing that with the increase in time.
Company is also increasing its profitability. Here, forecsting is done for future time span and the
12
⊘ This is a preview!⊘
Do you want full access?
Subscribe today to unlock all pages.
Trusted by 1+ million students worldwide
1 out of 20
Related Documents


Your All-in-One AI-Powered Toolkit for Academic Success.
+13062052269
info@desklib.com
Available 24*7 on WhatsApp / Email
![[object Object]](/_next/static/media/star-bottom.7253800d.svg)
Unlock your academic potential
Copyright © 2020–2026 A2Z Services. All Rights Reserved. Developed and managed by ZUCOL.