Business Decision-Making Report: Food for Friends Restaurant Analysis
VerifiedAdded on 2020/01/07
|20
|3945
|216
Report
AI Summary
This report analyzes business decision-making processes, using the case of the 'Food for Friends' restaurant. It begins with planning for data collection, including primary and secondary sources, and designing a survey methodology and questionnaire. The report then summarizes and analyzes collected data, calculating measures of dispersion, quartiles, percentiles, and correlation coefficients to draw conclusions. It utilizes spreadsheets to create graphs and trend lines for forecasting, culminating in a business presentation and formal report. The project plan includes the use of information planning tools and the determination of a critical path, alongside the application of financial tools like NPV and IRR for decision-making. The analysis covers data from 2007 to 2016, focusing on sales and profit figures to inform the restaurant's expansion plans. The report demonstrates an understanding of data analysis, financial planning, and project management within a business context.

BUSINESS DECISION-
MAKING
MAKING
Paraphrase This Document
Need a fresh take? Get an instant paraphrase of this document with our AI Paraphraser
TABLE OF CONTENTS
INTRODUCTION...........................................................................................................................1
TASK 1............................................................................................................................................1
P1.1 Create a plan for data collection of primary and secondary data for the given business
problem.......................................................................................................................................1
P1.2 Present a survey methodology and sample frame...............................................................2
P1.3 Design a questionnaire for the given problem....................................................................3
TASK 2............................................................................................................................................5
P2.1 Create information for decision making by summarizing the data.....................................5
P2.2 Analyze the results to draw valid conclusions....................................................................6
P2.3 Analyze the data using the measures of dispersion............................................................6
P2.4 Explain how Quartiles, percentile and correlation coefficient to draw useful conclusions.
.....................................................................................................................................................7
TASK 3............................................................................................................................................8
P3.1 Produce graphs using the spreadsheets and draw the valid conclusions............................8
P3.2 Create trend line to assist in forecasting...........................................................................10
P3.3 Prepare Business presentation...........................................................................................11
P3.4 Produce formal business report. .......................................................................................11
TASK 4..........................................................................................................................................11
P4.1 Use appropriate information planning tools.....................................................................11
P4.2 Prepare the project plan for an activity and determine the critical path...........................12
P4.3 Use financial tools for decision making............................................................................14
CONCLUSION..............................................................................................................................15
REFERENCES..............................................................................................................................16
INDEX OF TABLES
Table 1: Raw data ...........................................................................................................................5
Table 2: Calculation of Mean, Median and Mode...........................................................................6
Table 3: Measures of dispersion......................................................................................................6
Table 4: Percentiles..........................................................................................................................7
Table 5: Quartiles.............................................................................................................................7
Table 6: Correlation Coefficient......................................................................................................7
Table 7: Project plan of activities..................................................................................................12
Table 8: Calculation of NPV..........................................................................................................14
Table 9: Calculation of IRR...........................................................................................................14
⊘ This is a preview!⊘
Do you want full access?
Subscribe today to unlock all pages.
Trusted by 1+ million students worldwide
ILLUSTRATION INDEX
Illustration 1: Pie chart of Sales.......................................................................................................8
Illustration 2: Pie chart of Profit......................................................................................................9
Illustration 3: Column Chart of Profit..............................................................................................9
Illustration 4: Trend Line Sales......................................................................................................10
Illustration 5: Trend Line Profit.....................................................................................................10
Illustration 6: Gantt Chart..............................................................................................................13
Illustration 7: Network diagram.....................................................................................................13
Paraphrase This Document
Need a fresh take? Get an instant paraphrase of this document with our AI Paraphraser
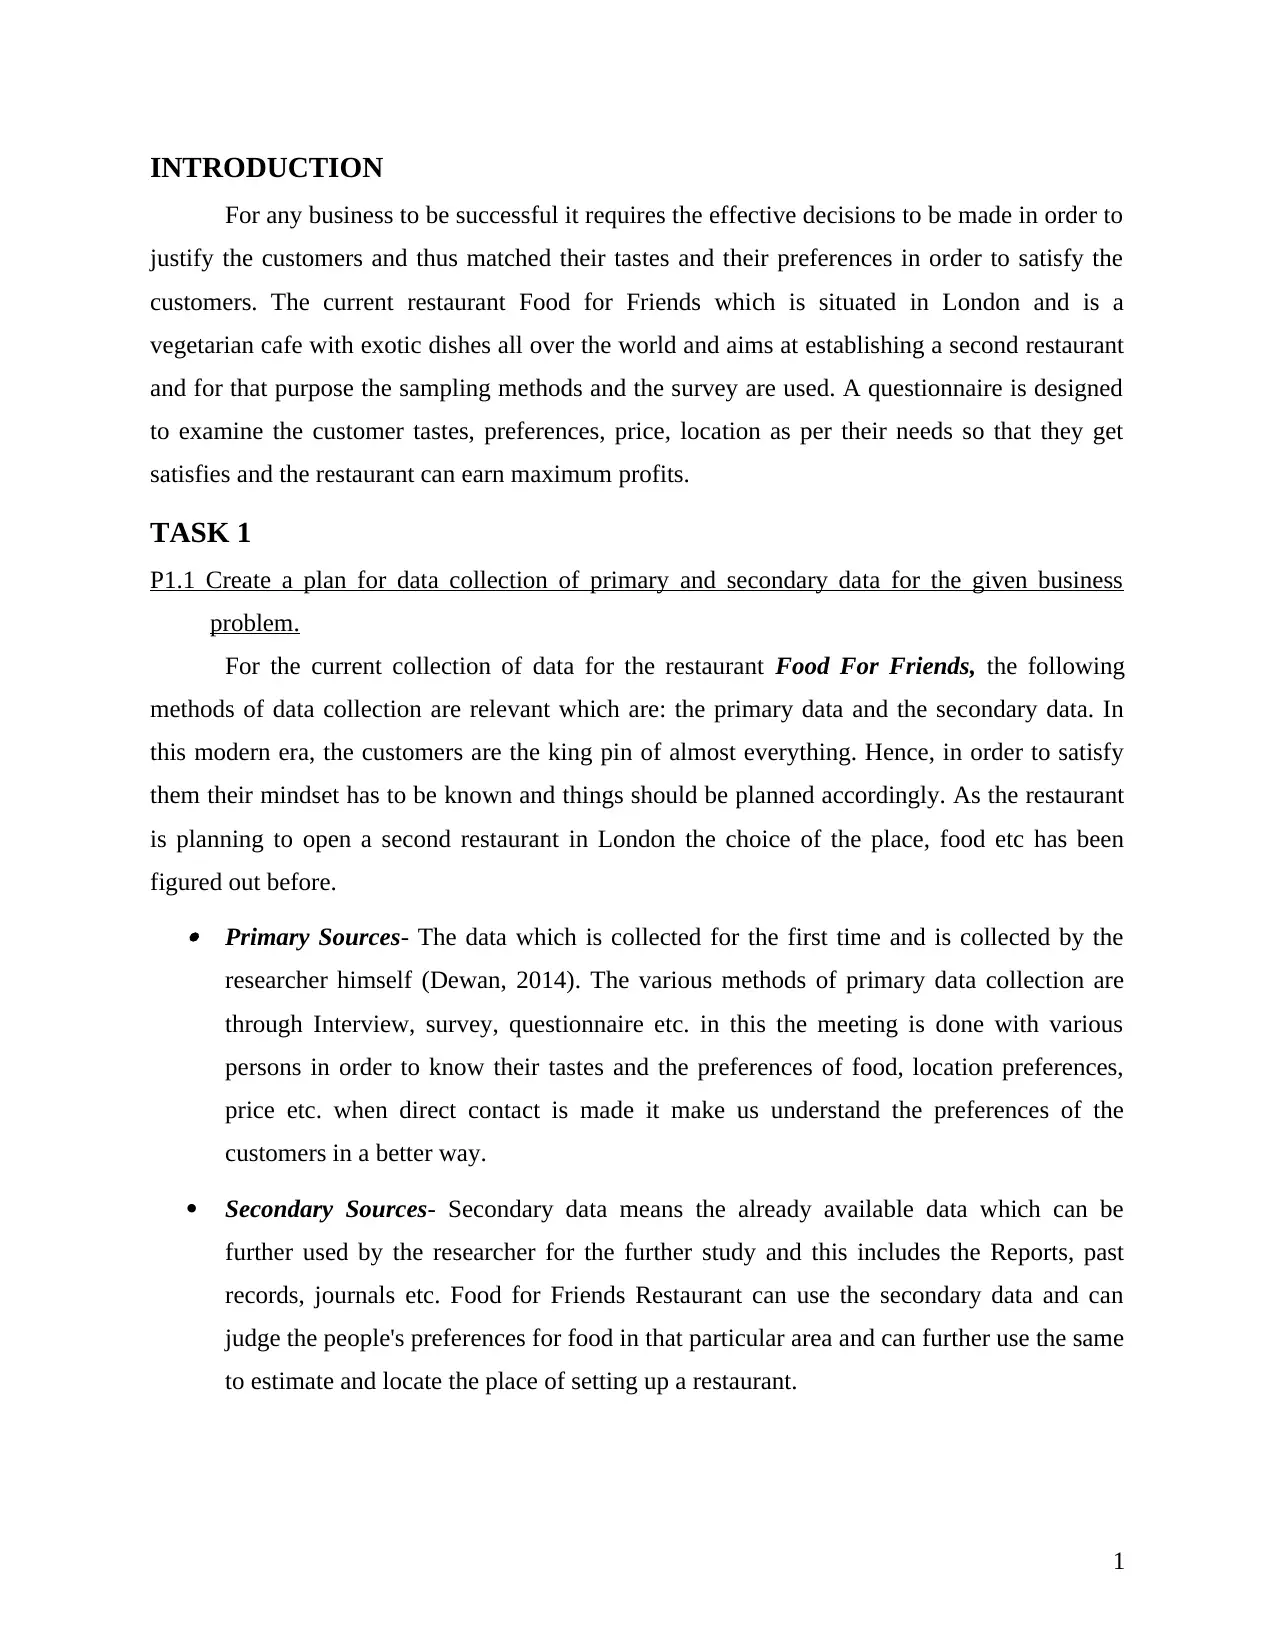
INTRODUCTION
For any business to be successful it requires the effective decisions to be made in order to
justify the customers and thus matched their tastes and their preferences in order to satisfy the
customers. The current restaurant Food for Friends which is situated in London and is a
vegetarian cafe with exotic dishes all over the world and aims at establishing a second restaurant
and for that purpose the sampling methods and the survey are used. A questionnaire is designed
to examine the customer tastes, preferences, price, location as per their needs so that they get
satisfies and the restaurant can earn maximum profits.
TASK 1
P1.1 Create a plan for data collection of primary and secondary data for the given business
problem.
For the current collection of data for the restaurant Food For Friends, the following
methods of data collection are relevant which are: the primary data and the secondary data. In
this modern era, the customers are the king pin of almost everything. Hence, in order to satisfy
them their mindset has to be known and things should be planned accordingly. As the restaurant
is planning to open a second restaurant in London the choice of the place, food etc has been
figured out before. Primary Sources- The data which is collected for the first time and is collected by the
researcher himself (Dewan, 2014). The various methods of primary data collection are
through Interview, survey, questionnaire etc. in this the meeting is done with various
persons in order to know their tastes and the preferences of food, location preferences,
price etc. when direct contact is made it make us understand the preferences of the
customers in a better way.
Secondary Sources- Secondary data means the already available data which can be
further used by the researcher for the further study and this includes the Reports, past
records, journals etc. Food for Friends Restaurant can use the secondary data and can
judge the people's preferences for food in that particular area and can further use the same
to estimate and locate the place of setting up a restaurant.
1
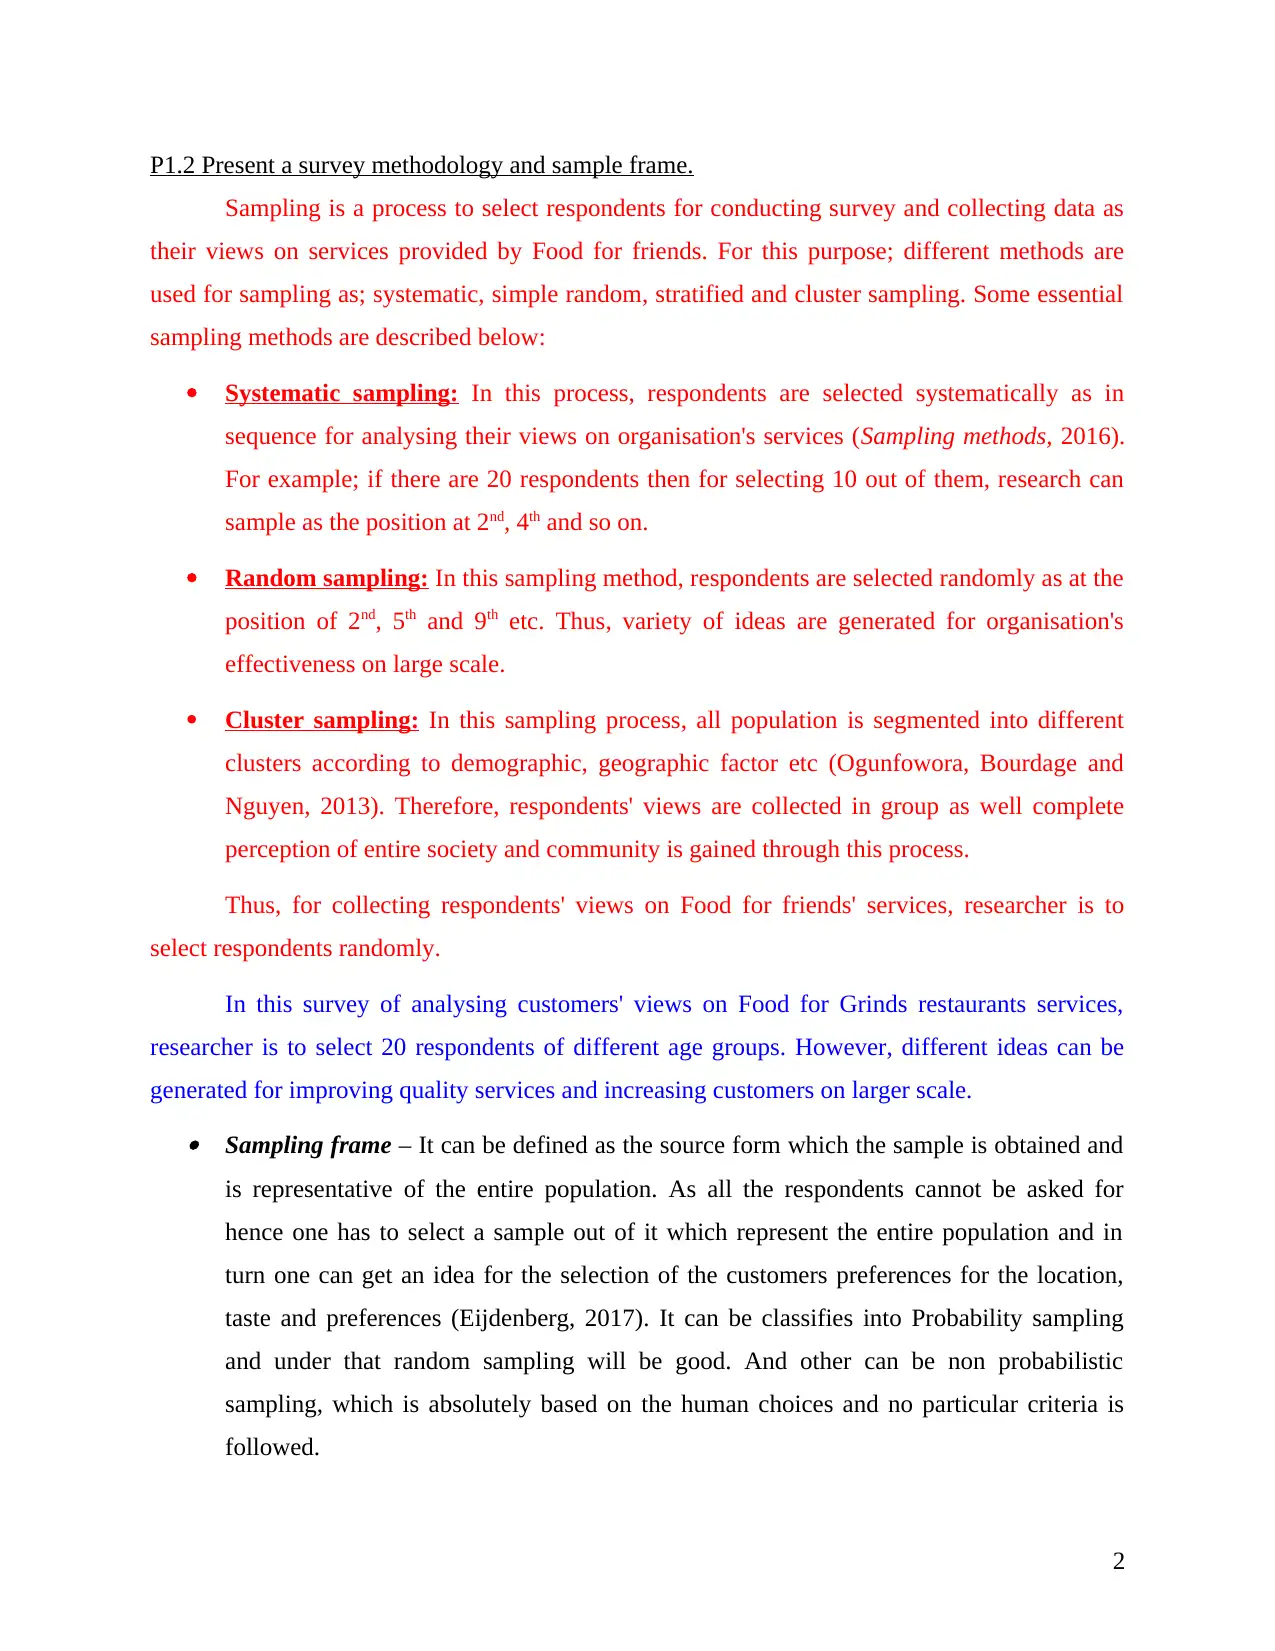
P1.2 Present a survey methodology and sample frame.
Sampling is a process to select respondents for conducting survey and collecting data as
their views on services provided by Food for friends. For this purpose; different methods are
used for sampling as; systematic, simple random, stratified and cluster sampling. Some essential
sampling methods are described below:
Systematic sampling: In this process, respondents are selected systematically as in
sequence for analysing their views on organisation's services (Sampling methods, 2016).
For example; if there are 20 respondents then for selecting 10 out of them, research can
sample as the position at 2nd, 4th and so on.
Random sampling: In this sampling method, respondents are selected randomly as at the
position of 2nd, 5th and 9th etc. Thus, variety of ideas are generated for organisation's
effectiveness on large scale.
Cluster sampling: In this sampling process, all population is segmented into different
clusters according to demographic, geographic factor etc (Ogunfowora, Bourdage and
Nguyen, 2013). Therefore, respondents' views are collected in group as well complete
perception of entire society and community is gained through this process.
Thus, for collecting respondents' views on Food for friends' services, researcher is to
select respondents randomly.
In this survey of analysing customers' views on Food for Grinds restaurants services,
researcher is to select 20 respondents of different age groups. However, different ideas can be
generated for improving quality services and increasing customers on larger scale. Sampling frame – It can be defined as the source form which the sample is obtained and
is representative of the entire population. As all the respondents cannot be asked for
hence one has to select a sample out of it which represent the entire population and in
turn one can get an idea for the selection of the customers preferences for the location,
taste and preferences (Eijdenberg, 2017). It can be classifies into Probability sampling
and under that random sampling will be good. And other can be non probabilistic
sampling, which is absolutely based on the human choices and no particular criteria is
followed.
2
⊘ This is a preview!⊘
Do you want full access?
Subscribe today to unlock all pages.
Trusted by 1+ million students worldwide
Survey Methodology- When one plans to open a restaurant one has to design the plan
before staring the restaurant, as if its done without considering the customers then the
entire idea can go in vain. Survey can be done in many ways with the help of
questionnaire, interviews in which in depth information is gathered which will in turn
help us in achieving the ultimate objective of maximizing the profit. This is a reliable
source of collecting the data. Interviews can help as when number of questions are asked
to the respondent and according to the questions the person answers the same. This helps
in answering the exact research problem.
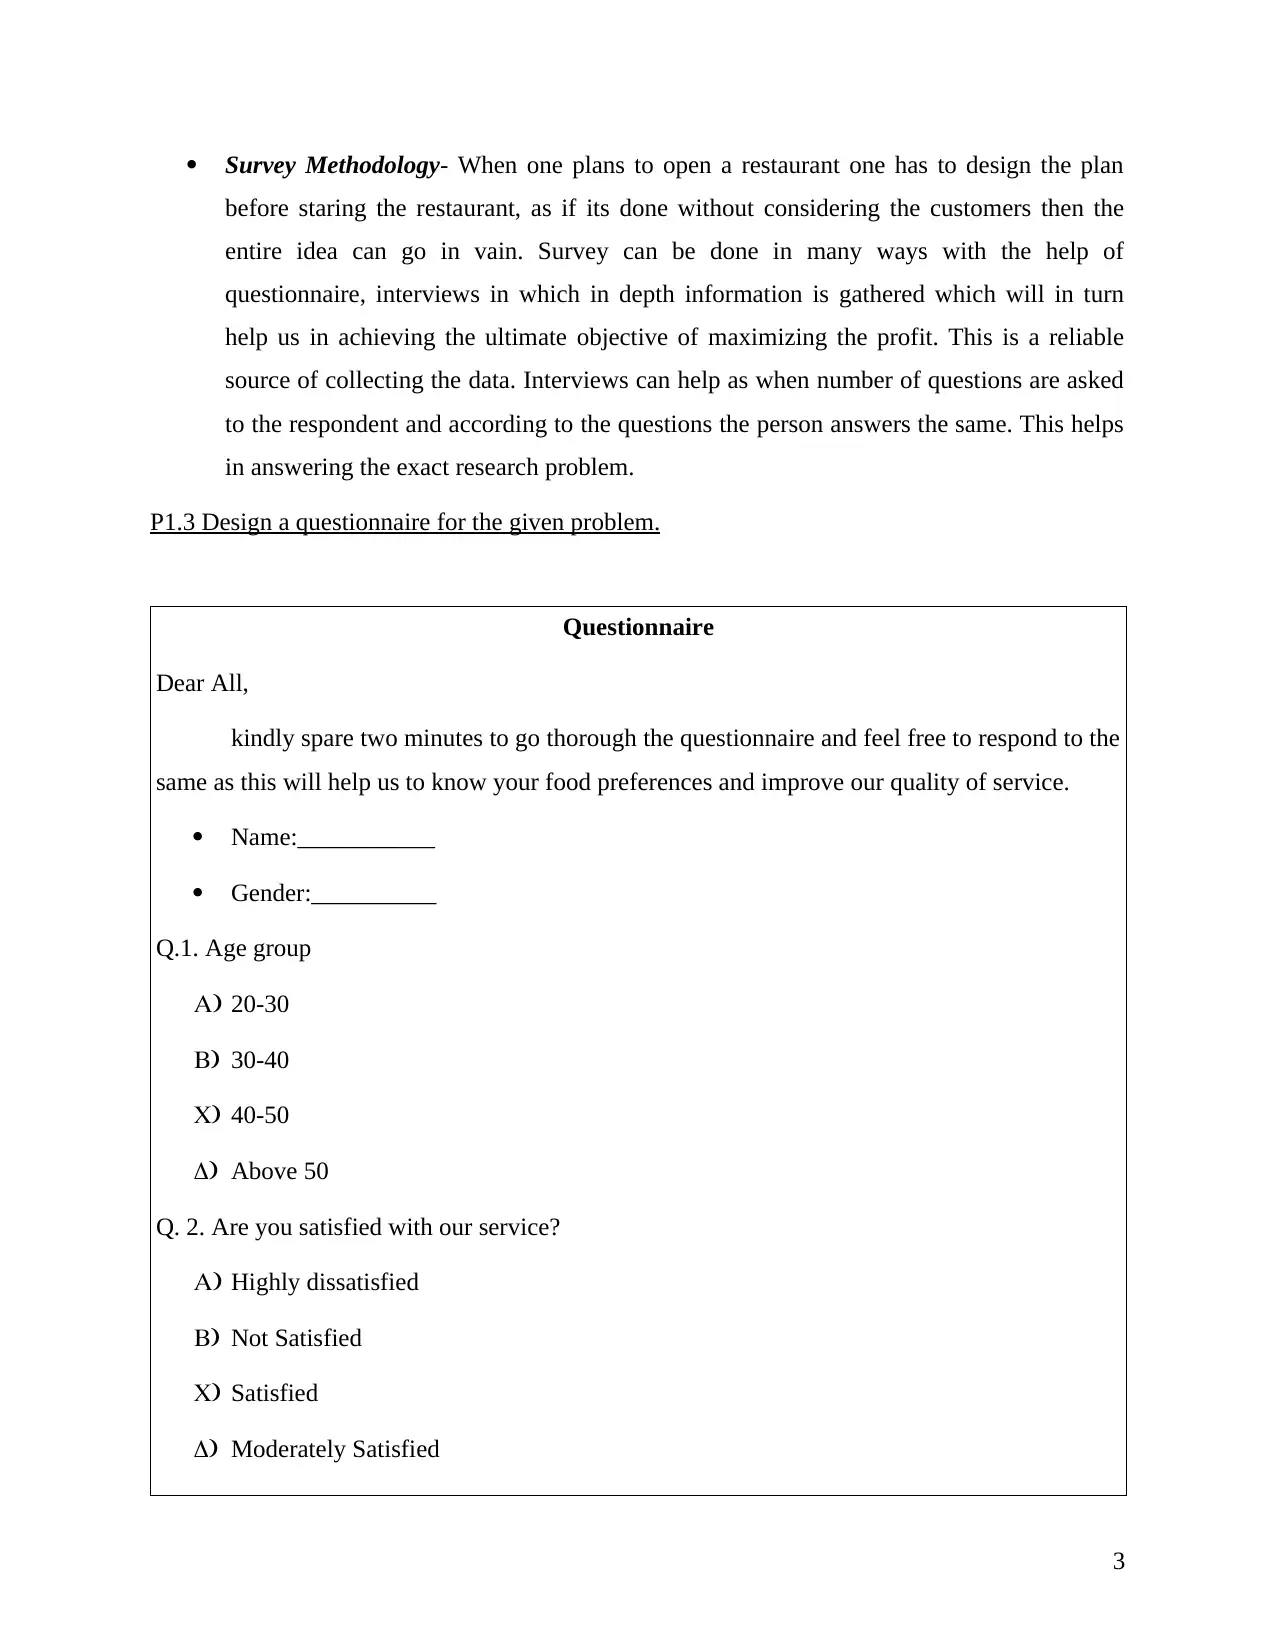
P1.3 Design a questionnaire for the given problem.
Questionnaire
Dear All,
kindly spare two minutes to go thorough the questionnaire and feel free to respond to the
same as this will help us to know your food preferences and improve our quality of service.
Name:___________
Gender:__________
Q.1. Age group
A) 20-30
B) 30-40
C) 40-50
D) Above 50
Q. 2. Are you satisfied with our service?
A) Highly dissatisfied
B) Not Satisfied
C) Satisfied
D) Moderately Satisfied
3
before staring the restaurant, as if its done without considering the customers then the
entire idea can go in vain. Survey can be done in many ways with the help of
questionnaire, interviews in which in depth information is gathered which will in turn
help us in achieving the ultimate objective of maximizing the profit. This is a reliable
source of collecting the data. Interviews can help as when number of questions are asked
to the respondent and according to the questions the person answers the same. This helps
in answering the exact research problem.
P1.3 Design a questionnaire for the given problem.
Questionnaire
Dear All,
kindly spare two minutes to go thorough the questionnaire and feel free to respond to the
same as this will help us to know your food preferences and improve our quality of service.
Name:___________
Gender:__________
Q.1. Age group
A) 20-30
B) 30-40
C) 40-50
D) Above 50
Q. 2. Are you satisfied with our service?
A) Highly dissatisfied
B) Not Satisfied
C) Satisfied
D) Moderately Satisfied
3
Paraphrase This Document
Need a fresh take? Get an instant paraphrase of this document with our AI Paraphraser
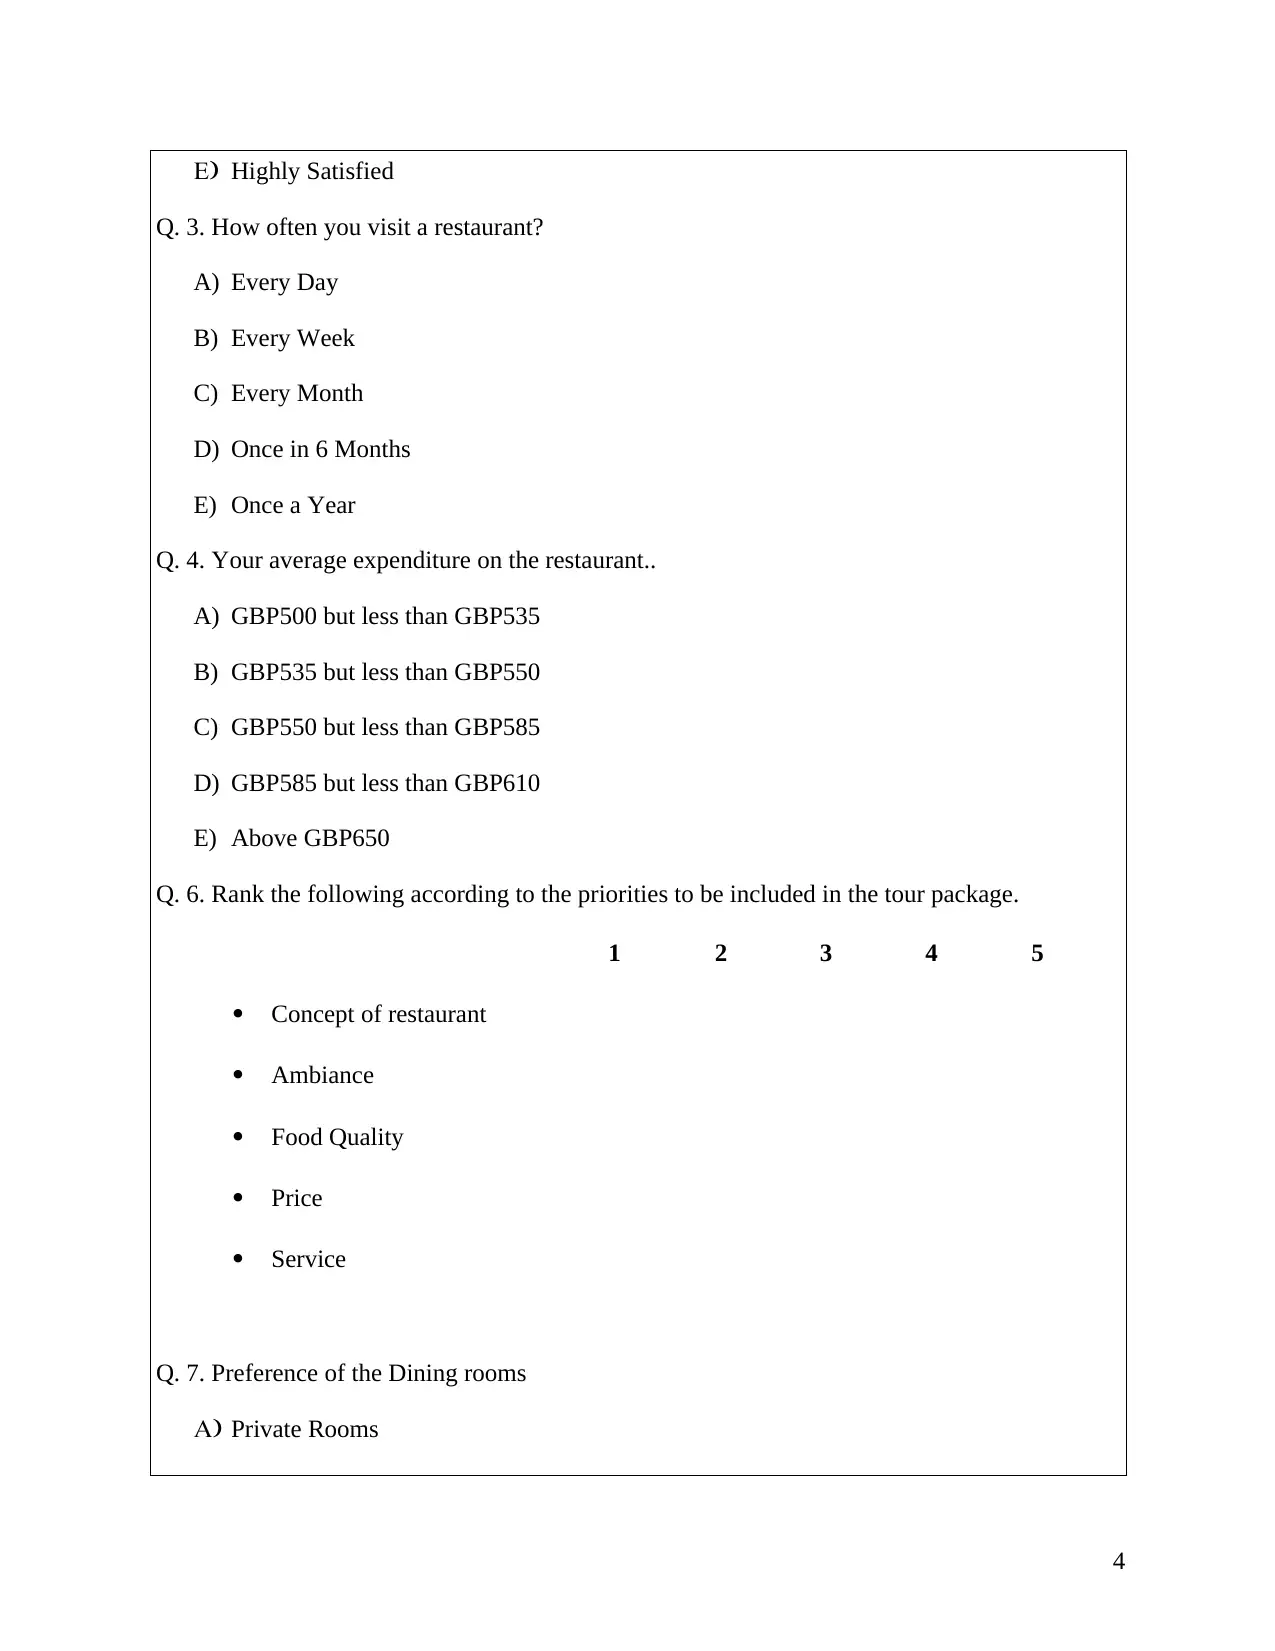
E) Highly Satisfied
Q. 3. How often you visit a restaurant?
A) Every Day
B) Every Week
C) Every Month
D) Once in 6 Months
E) Once a Year
Q. 4. Your average expenditure on the restaurant..
A) GBP500 but less than GBP535
B) GBP535 but less than GBP550
C) GBP550 but less than GBP585
D) GBP585 but less than GBP610
E) Above GBP650
Q. 6. Rank the following according to the priorities to be included in the tour package.
1 2 3 4 5
Concept of restaurant
Ambiance
Food Quality
Price
Service
Q. 7. Preference of the Dining rooms
A) Private Rooms
4
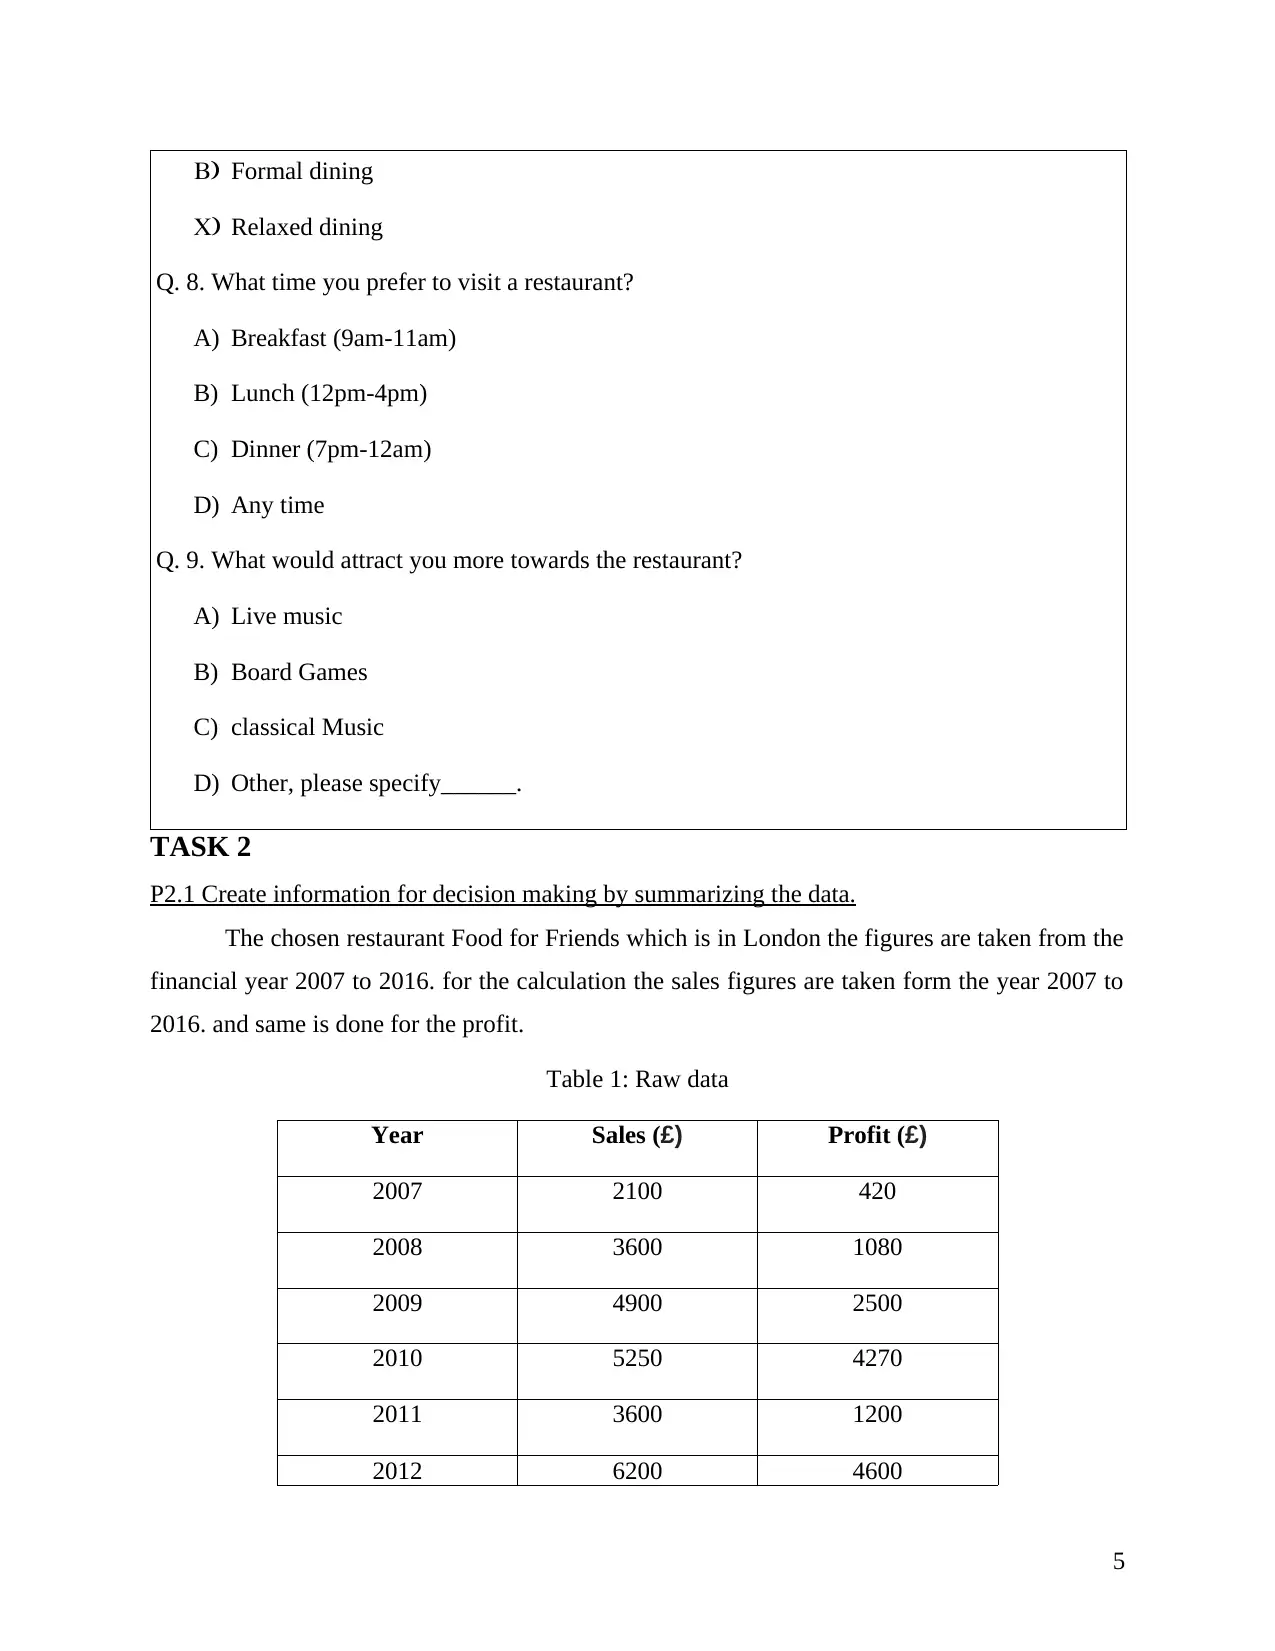
B) Formal dining
C) Relaxed dining
Q. 8. What time you prefer to visit a restaurant?
A) Breakfast (9am-11am)
B) Lunch (12pm-4pm)
C) Dinner (7pm-12am)
D) Any time
Q. 9. What would attract you more towards the restaurant?
A) Live music
B) Board Games
C) classical Music
D) Other, please specify______.
TASK 2
P2.1 Create information for decision making by summarizing the data.
The chosen restaurant Food for Friends which is in London the figures are taken from the
financial year 2007 to 2016. for the calculation the sales figures are taken form the year 2007 to
2016. and same is done for the profit.
Table 1: Raw data
Year Sales (£) Profit (£)
2007 2100 420
2008 3600 1080
2009 4900 2500
2010 5250 4270
2011 3600 1200
2012 6200 4600
5
⊘ This is a preview!⊘
Do you want full access?
Subscribe today to unlock all pages.
Trusted by 1+ million students worldwide
2013 7400 6900
2014 6950 4170
2015 8045 2011.25
2016 9020 8118
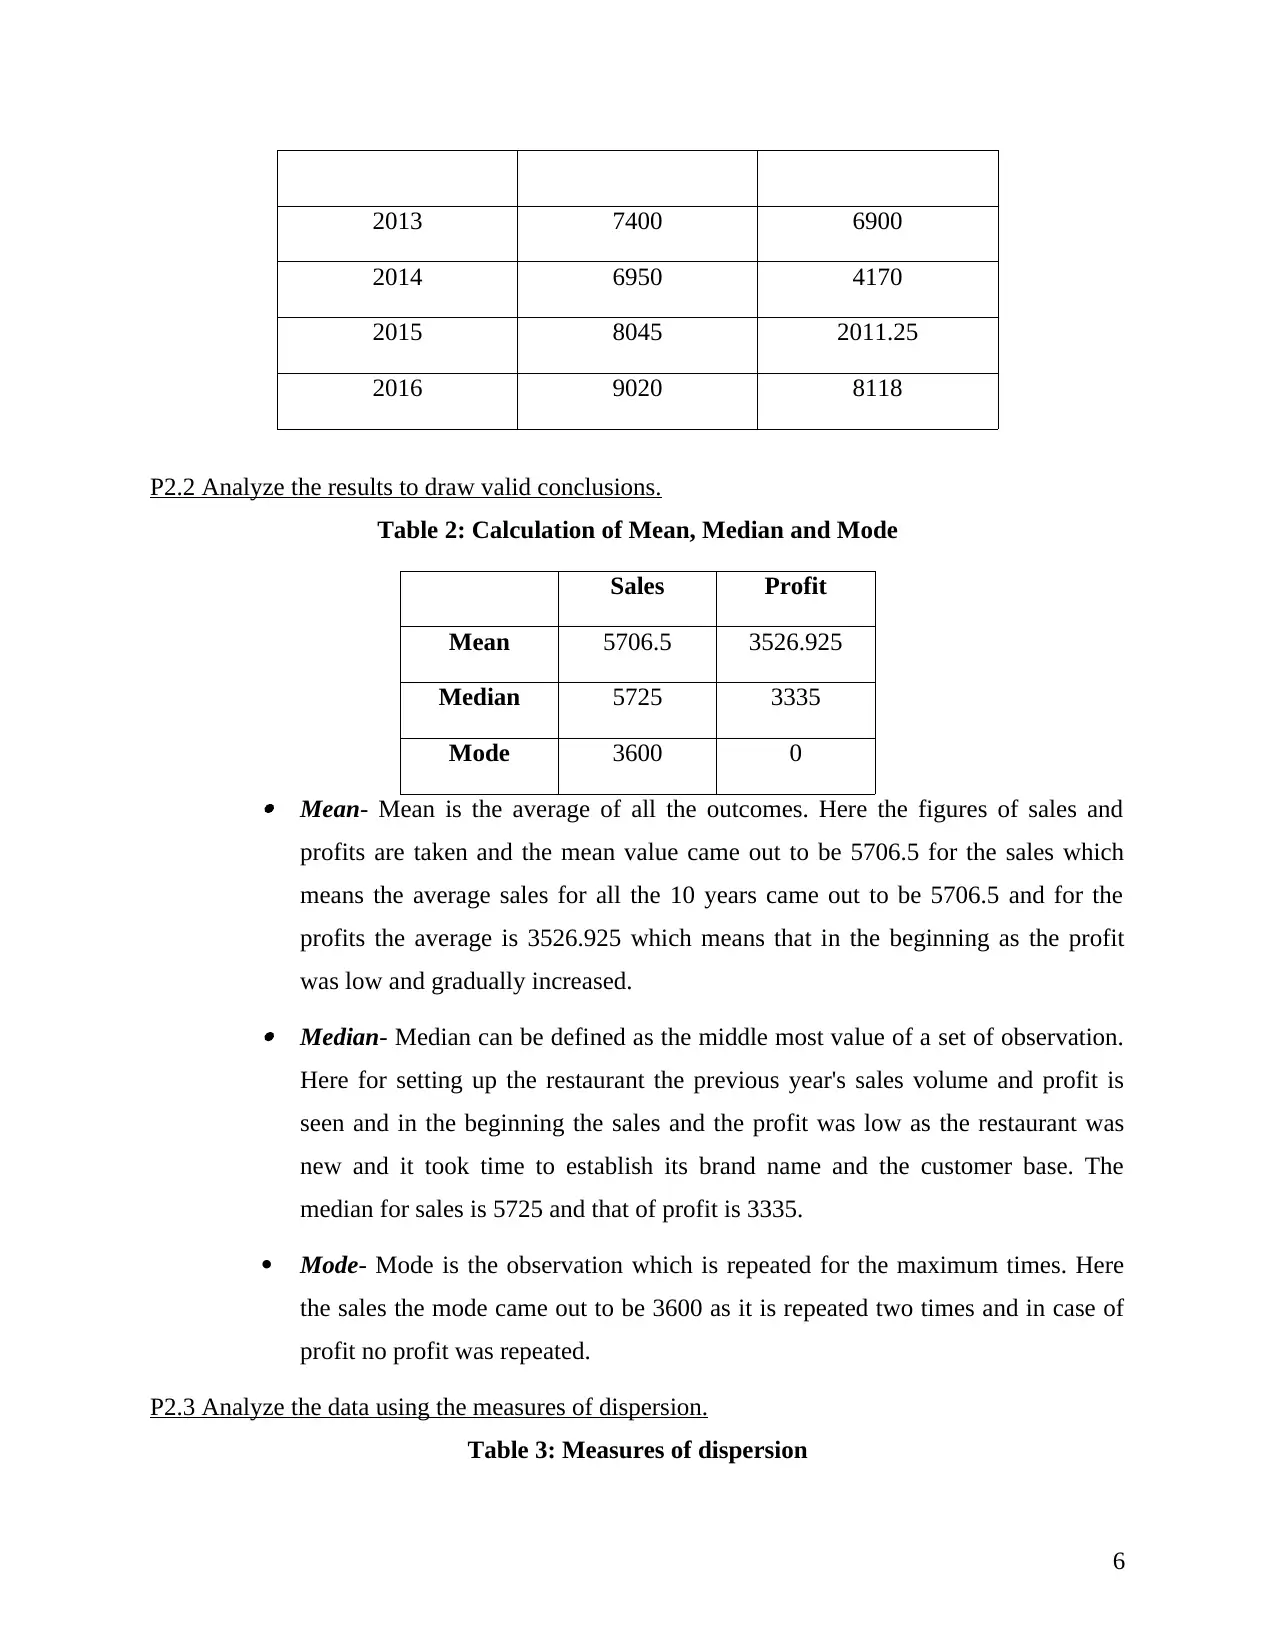
P2.2 Analyze the results to draw valid conclusions.
Table 2: Calculation of Mean, Median and Mode
Sales Profit
Mean 5706.5 3526.925
Median 5725 3335
Mode 3600 0
Mean- Mean is the average of all the outcomes. Here the figures of sales and
profits are taken and the mean value came out to be 5706.5 for the sales which
means the average sales for all the 10 years came out to be 5706.5 and for the
profits the average is 3526.925 which means that in the beginning as the profit
was low and gradually increased.
Median- Median can be defined as the middle most value of a set of observation.
Here for setting up the restaurant the previous year's sales volume and profit is
seen and in the beginning the sales and the profit was low as the restaurant was
new and it took time to establish its brand name and the customer base. The
median for sales is 5725 and that of profit is 3335.
Mode- Mode is the observation which is repeated for the maximum times. Here
the sales the mode came out to be 3600 as it is repeated two times and in case of
profit no profit was repeated.
P2.3 Analyze the data using the measures of dispersion.
Table 3: Measures of dispersion
6
2014 6950 4170
2015 8045 2011.25
2016 9020 8118
P2.2 Analyze the results to draw valid conclusions.
Table 2: Calculation of Mean, Median and Mode
Sales Profit
Mean 5706.5 3526.925
Median 5725 3335
Mode 3600 0
Mean- Mean is the average of all the outcomes. Here the figures of sales and
profits are taken and the mean value came out to be 5706.5 for the sales which
means the average sales for all the 10 years came out to be 5706.5 and for the
profits the average is 3526.925 which means that in the beginning as the profit
was low and gradually increased.
Median- Median can be defined as the middle most value of a set of observation.
Here for setting up the restaurant the previous year's sales volume and profit is
seen and in the beginning the sales and the profit was low as the restaurant was
new and it took time to establish its brand name and the customer base. The
median for sales is 5725 and that of profit is 3335.
Mode- Mode is the observation which is repeated for the maximum times. Here
the sales the mode came out to be 3600 as it is repeated two times and in case of
profit no profit was repeated.
P2.3 Analyze the data using the measures of dispersion.
Table 3: Measures of dispersion
6
Paraphrase This Document
Need a fresh take? Get an instant paraphrase of this document with our AI Paraphraser
Sales Profit
SD 2207.21 2559.94
RANGE 6920 7698
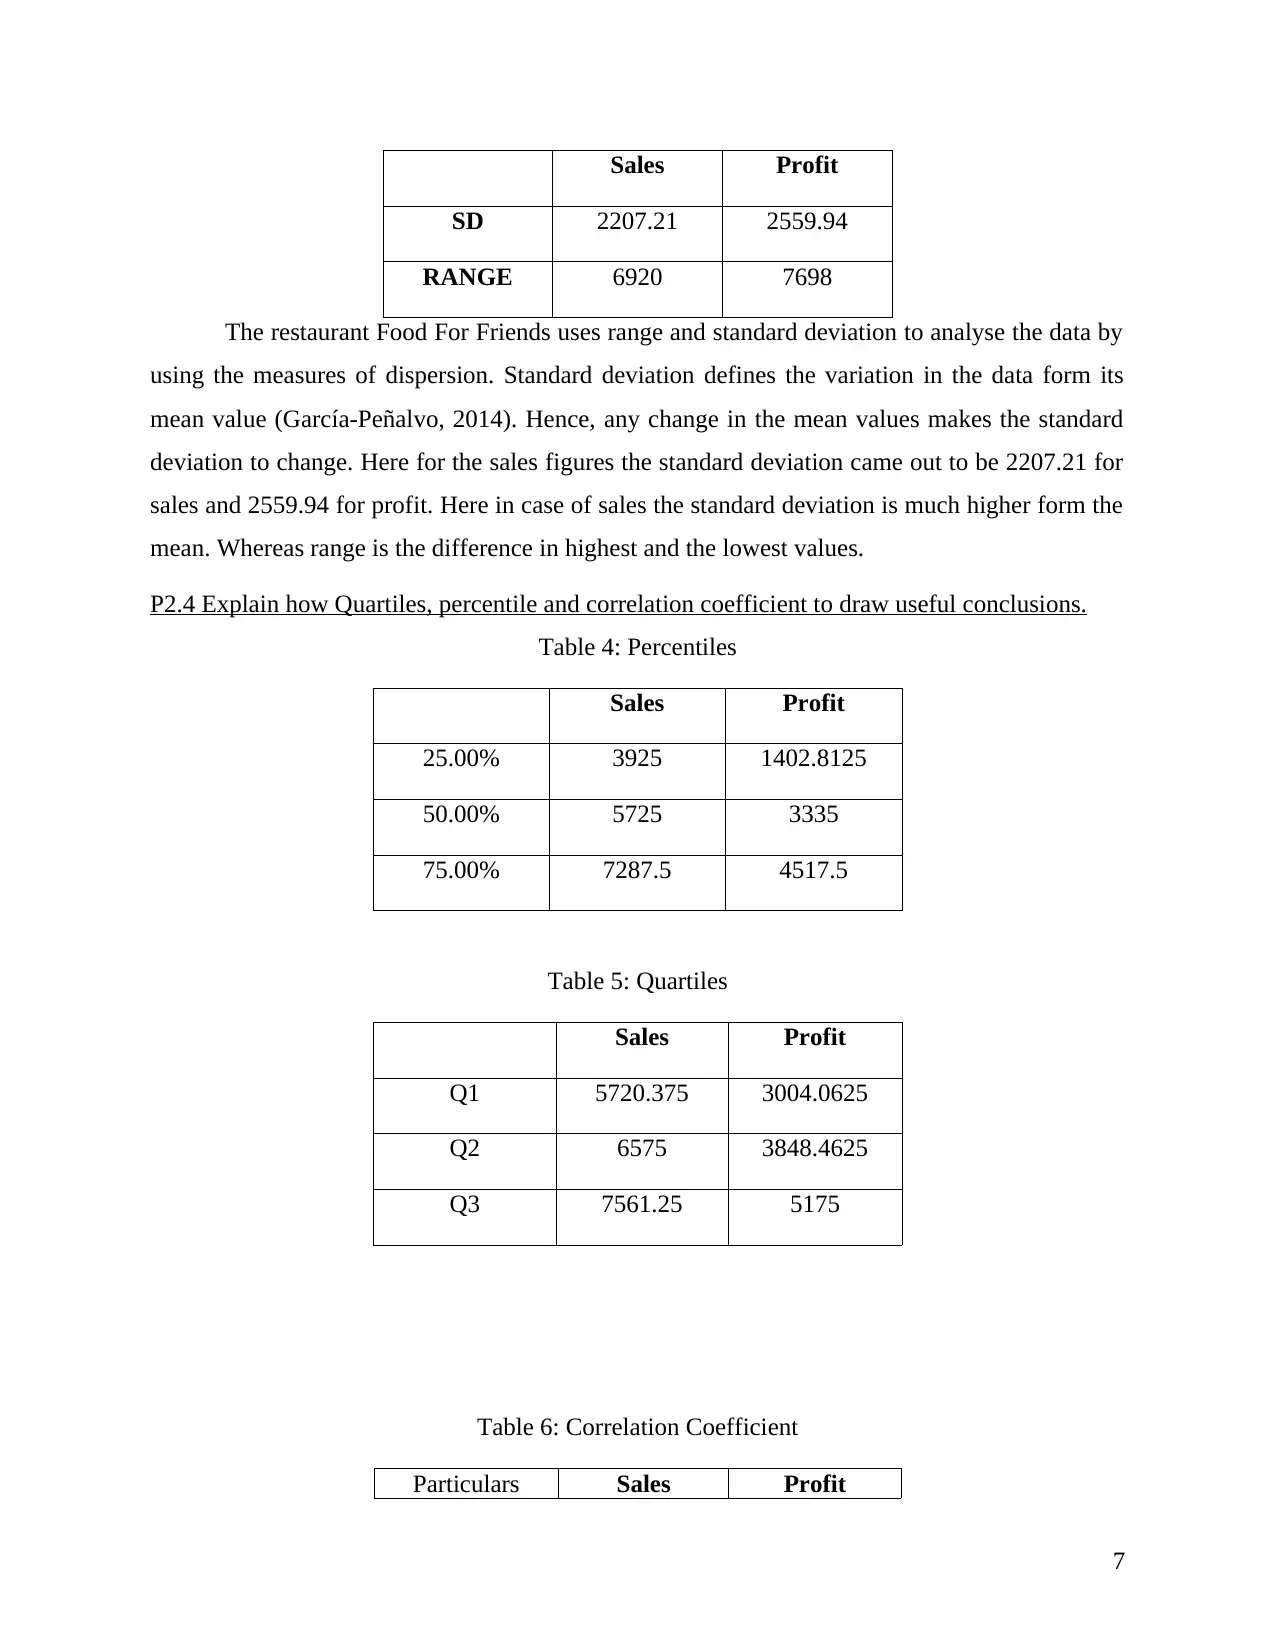
The restaurant Food For Friends uses range and standard deviation to analyse the data by
using the measures of dispersion. Standard deviation defines the variation in the data form its
mean value (García-Peñalvo, 2014). Hence, any change in the mean values makes the standard
deviation to change. Here for the sales figures the standard deviation came out to be 2207.21 for
sales and 2559.94 for profit. Here in case of sales the standard deviation is much higher form the
mean. Whereas range is the difference in highest and the lowest values.
P2.4 Explain how Quartiles, percentile and correlation coefficient to draw useful conclusions.
Table 4: Percentiles
Sales Profit
25.00% 3925 1402.8125
50.00% 5725 3335
75.00% 7287.5 4517.5
Table 5: Quartiles
Sales Profit
Q1 5720.375 3004.0625
Q2 6575 3848.4625
Q3 7561.25 5175
Table 6: Correlation Coefficient
Particulars Sales Profit
7
SD 2207.21 2559.94
RANGE 6920 7698
The restaurant Food For Friends uses range and standard deviation to analyse the data by
using the measures of dispersion. Standard deviation defines the variation in the data form its
mean value (García-Peñalvo, 2014). Hence, any change in the mean values makes the standard
deviation to change. Here for the sales figures the standard deviation came out to be 2207.21 for
sales and 2559.94 for profit. Here in case of sales the standard deviation is much higher form the
mean. Whereas range is the difference in highest and the lowest values.
P2.4 Explain how Quartiles, percentile and correlation coefficient to draw useful conclusions.
Table 4: Percentiles
Sales Profit
25.00% 3925 1402.8125
50.00% 5725 3335
75.00% 7287.5 4517.5
Table 5: Quartiles
Sales Profit
Q1 5720.375 3004.0625
Q2 6575 3848.4625
Q3 7561.25 5175
Table 6: Correlation Coefficient
Particulars Sales Profit
7
Sales 1 0.80
Profit 0.80 1
Quartiles are divided in 3 variants which depicts the Q1 For the 25th percentile, Q2 is for
the 50th percentile and Q3 is form the 75th percentile. Here the entire data is divided into four
equal parts and thus it enables the decision making. Percentile is defines as the data is divided
into parts which aid in decision making. Whereas correlation coefficient draws the
interrelationship between two variables. It lies between -1 to +1. n this case the correlation
coefficient came out to be 0.80 which means that the correlation coefficient is positive which
means that both the variables move in the same direction. When sales increases profit also
increase and thus helpful in finding out the tastes and preferences of the customers.
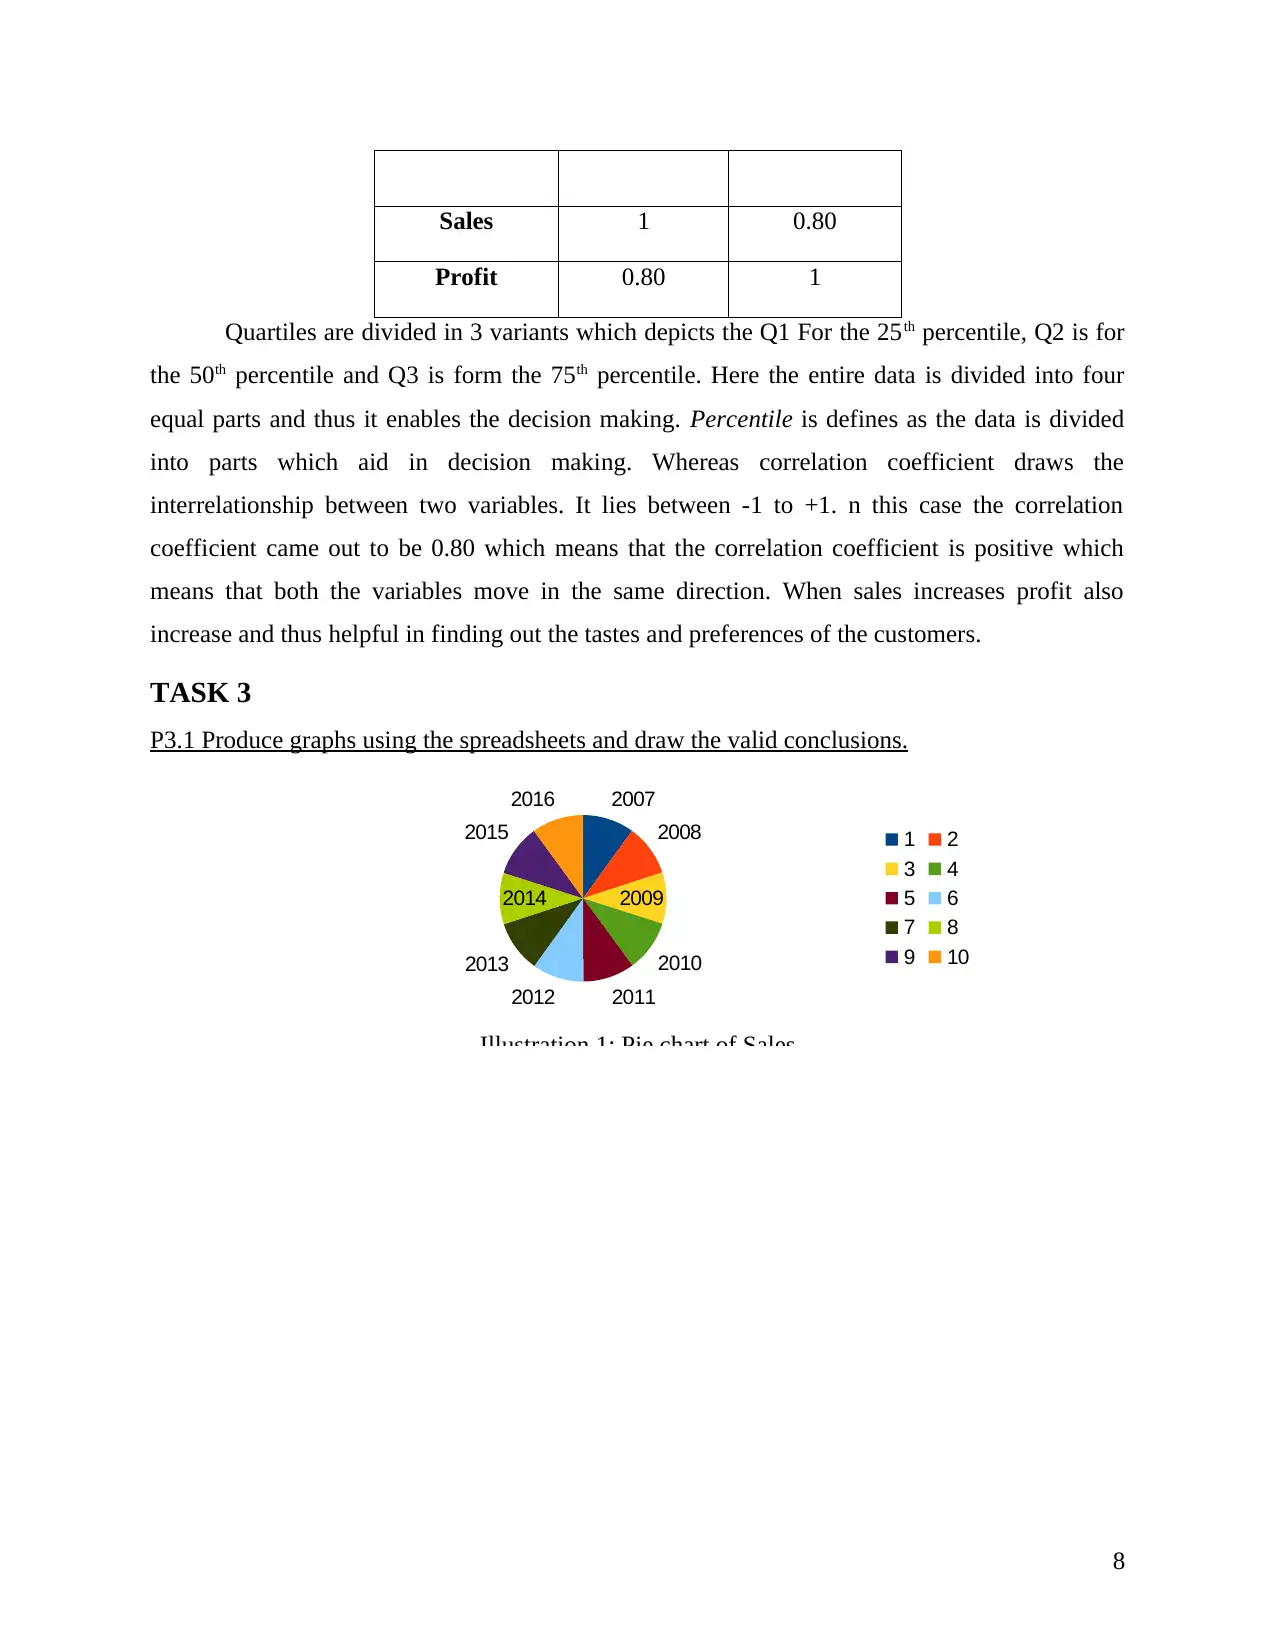
TASK 3
P3.1 Produce graphs using the spreadsheets and draw the valid conclusions.
2007
2008
2009
2010
20112012
2013
2014
2015
2016
1 2
3 4
5 6
7 8
9 10
Illustration 1: Pie chart of Sales
8
Profit 0.80 1
Quartiles are divided in 3 variants which depicts the Q1 For the 25th percentile, Q2 is for
the 50th percentile and Q3 is form the 75th percentile. Here the entire data is divided into four
equal parts and thus it enables the decision making. Percentile is defines as the data is divided
into parts which aid in decision making. Whereas correlation coefficient draws the
interrelationship between two variables. It lies between -1 to +1. n this case the correlation
coefficient came out to be 0.80 which means that the correlation coefficient is positive which
means that both the variables move in the same direction. When sales increases profit also
increase and thus helpful in finding out the tastes and preferences of the customers.
TASK 3
P3.1 Produce graphs using the spreadsheets and draw the valid conclusions.
2007
2008
2009
2010
20112012
2013
2014
2015
2016
1 2
3 4
5 6
7 8
9 10
Illustration 1: Pie chart of Sales
8
⊘ This is a preview!⊘
Do you want full access?
Subscribe today to unlock all pages.
Trusted by 1+ million students worldwide
1 out of 20
Related Documents


Your All-in-One AI-Powered Toolkit for Academic Success.
+13062052269
info@desklib.com
Available 24*7 on WhatsApp / Email
![[object Object]](/_next/static/media/star-bottom.7253800d.svg)
Unlock your academic potential
Copyright © 2020–2026 A2Z Services. All Rights Reserved. Developed and managed by ZUCOL.