Business Decision Making Report: Tour Company Project and Analysis
VerifiedAdded on 2020/01/28
|41
|2637
|28
Report
AI Summary
This report focuses on business decision-making within a tour company context. It begins by outlining the importance of effective decisions for profitability and then delves into the research methodology employed, including data collection methods (primary and secondary), survey design (questionnaire), and sampling techniques (simple random sampling). The report details the questionnaire used to gather data from a sample of 90 individuals and explains how data is summarized to inform decisions about launching new tour products. Furthermore, it discusses information processing tools like Management Information Systems, Decision Support Systems, and Transaction Processing Systems. The report concludes with a project plan, including a network diagram, Gantt chart, and identification of the critical path for launching a new tour product, alongside an overview of investment appraisal techniques used to evaluate the financial viability of new ventures. The report provides a comprehensive overview of the steps involved in making informed business decisions in the context of a tour company.

BUSINESS DECISION
MAKING
MAKING
Paraphrase This Document
Need a fresh take? Get an instant paraphrase of this document with our AI Paraphraser
1
⊘ This is a preview!⊘
Do you want full access?
Subscribe today to unlock all pages.
Trusted by 1+ million students worldwide
INTRODUCTION
In the business it is very necessary to take highly better and effectual business decisions
which helps to make it more profitable in the industry. The current study is based on the tour
company which provides various number of tour products at different destinations. It describes
about data collection methods and sampling frame which is used by the scholar to carry out
current research. The study describes about different statistical tools as well as measures of
dispersion to analyse the data and make valid conclusion. Further, it helps to determine level of
sales and revenue generated by different destinations in the FY 2014, 2015 and 2016. at the last
project plan as well as investment appraisal technique is describes.
TASK 1
1.1 Plan for collecting primary and secondary data
Research is one of the important technique for analyse any kind of business problem and
make solution of it within firm. For this data and informations are to be required which are
collected from various sources like as primary and secondary. In the present case the company is
going to launch a new tour product and analysing responses of local community of the country
regarding respective product. There are number of sources which provide wide range of
information to the scholar in order to collect data (Desmond, 2014). Those kinds of source from
where data are collected by the investigator at first time and then summarised in a structure. Such
type of data are fresh as well as provide reliable and appropriate information for analysing
problems and take effective decision to resolve it. In the primary data, different sources are used
like as survey, questionnaire, interview etc. Apart from this, for carrying out survey telephones,
calls, online, social media networks, emails, meeting personally etc. Used by the firm. In the
current case, questionnaire source is to be used by the researcher which will distributed among
90 local community of the country. In this case, there are local community is to be selected
because the tour company is going to offer the tour packages to them. So it is better and effectual
to analyse that what kind of tour products the people want. At the current research the tour
operator want to launch a new tour product for different destinations for the people and local
community of the country. Due to this reason, it is highly necessary to analyse about the buying
behaviour, income as well as spending capability for the each and every person. Hence, there is
local community is chosen for distribute the questionnaire and then analyse about them. Further,
because of targeting them for tour product there are local community is to be selected.
2
Paraphrase This Document
Need a fresh take? Get an instant paraphrase of this document with our AI Paraphraser
On the other side, those types of data and informations which are already collected by the
another scholar and published are identified as secondary data. In this there are various number
of source are available which provide secondary information for conducting research. Further,
secondary data are collected from publications, articles, annual report of the firm, newspaper etc.
In the current scenario for launching a new project annual report of the company is to be used
from where sales data are determined (Schwalbe, 2015). On the basis of existing and current
sales of tour packages and products further decisions are taken by it.
1.2 Survey methodology and sampling frame
The method and technique through which survey is to be conducted and appropriate
decisions are made is known as survey methodology. There are various methods used by scholar
for analysing and researching on the problem. In the present case, survey is to be done by using
online method. Further, the questionnaire which are framed that will be distributed in 90 people
with the help of online such as email and social media networks. Through direct mail or social
media questionnaire will be distributed and then responses as well as recommendations are taken
through same. It is the best survey method in which cost and time both are taken less which is
helpful for the company.
In order to take sample for surveying about new tour package or product there are various
methods and techniques used by the scholar (Lee and et.al., 2014). Different sampling methods
or frames are like as stratified, cluster, simple random, convenience sampling etc. In the present
case simple random sampling method is used by the investigator for analyse about the taste and
preferences, attitude, consumer profit as well as buying behaviour etc.
According to the stratified sampling method there is sample data are to be taken on the basis of
various demographic elements which are associated with the people. The local community and
people are to be divided in age, income, education, marital status etc. The current kind of
sampling technique is highly based on the demographic factors which are associated with the
local community and people.
In the cluster method of sampling the sample assessed by considering the geographical areas
where the whole area is to be divided in small areas. Further, the current kind of method is to be
mostly used by the marketing firms. It is mostly based on the geographical areas where overall
research area is to be segmented on the basis of small areas.
3
As per the convenience process of the sampling scholar take sample data on the basis of his
understanding without considering any type of parameter. As the researcher understand about the
research and how to do survey there are sample is taken which is as appropriate and suitable for
him. In this any type of parameters as well as concepts are not to be used at the time of taking
assessing sample.
According to the chosen method that is simple random sampling technique the sample is taken
on the randomly basis because there are any kinds of parameter has not followed by scholar. At
the time of researching and conducting survey on the larger number of local community and
population then to take the sample data is very necessary. On the basis of the simple random
sampling method the researcher used and adopt sample data which are such as 90 people among
the overall population.
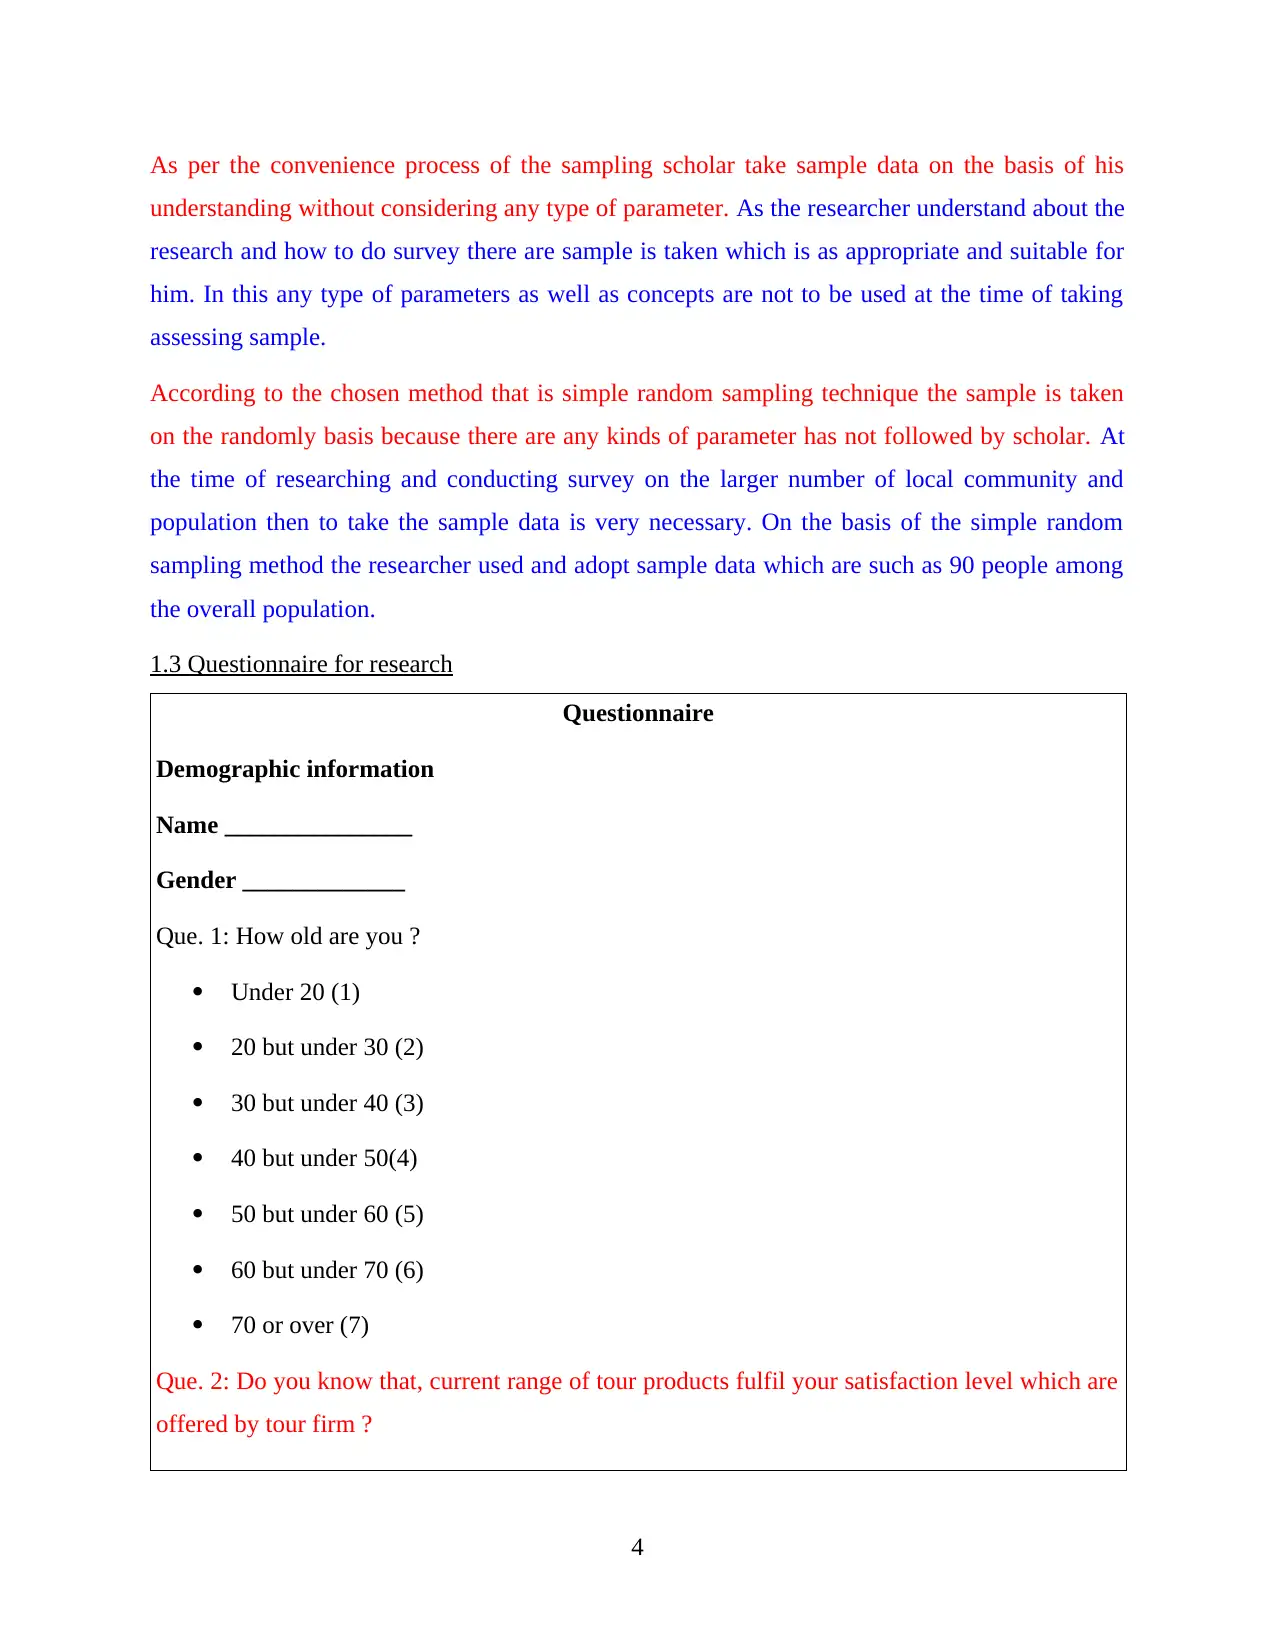
1.3 Questionnaire for research
Questionnaire
Demographic information
Name _______________
Gender _____________
Que. 1: How old are you ?
Under 20 (1)
20 but under 30 (2)
30 but under 40 (3)
40 but under 50(4)
50 but under 60 (5)
60 but under 70 (6)
70 or over (7)
Que. 2: Do you know that, current range of tour products fulfil your satisfaction level which are
offered by tour firm ?
4
understanding without considering any type of parameter. As the researcher understand about the
research and how to do survey there are sample is taken which is as appropriate and suitable for
him. In this any type of parameters as well as concepts are not to be used at the time of taking
assessing sample.
According to the chosen method that is simple random sampling technique the sample is taken
on the randomly basis because there are any kinds of parameter has not followed by scholar. At
the time of researching and conducting survey on the larger number of local community and
population then to take the sample data is very necessary. On the basis of the simple random
sampling method the researcher used and adopt sample data which are such as 90 people among
the overall population.
1.3 Questionnaire for research
Questionnaire
Demographic information
Name _______________
Gender _____________
Que. 1: How old are you ?
Under 20 (1)
20 but under 30 (2)
30 but under 40 (3)
40 but under 50(4)
50 but under 60 (5)
60 but under 70 (6)
70 or over (7)
Que. 2: Do you know that, current range of tour products fulfil your satisfaction level which are
offered by tour firm ?
4
⊘ This is a preview!⊘
Do you want full access?
Subscribe today to unlock all pages.
Trusted by 1+ million students worldwide
Yes
No
Que. 3: How much tour packages purchase by you within a year ?
1
2
3
4
More than 4
Que. 4: Will you purchase tour product for destination A, Morocco in the future ?
1. Highly disagree
2. Disagree
3. Neutral
4. Agree
5. Highly agree
Que. 5: How much you are able to pay per person for tour package of destination A
(Morocco) ?
1. £ 600- but less than 625
2. £ 625 but less than 650
3. £ 650- but less than 675
4. £675- but less than 700
5. £ 700- but less than 725
Que. 6: Will you purchase tour product for destination B, Turkey in the further year ?
1. Highly disagree
2. Disagree
5
Paraphrase This Document
Need a fresh take? Get an instant paraphrase of this document with our AI Paraphraser
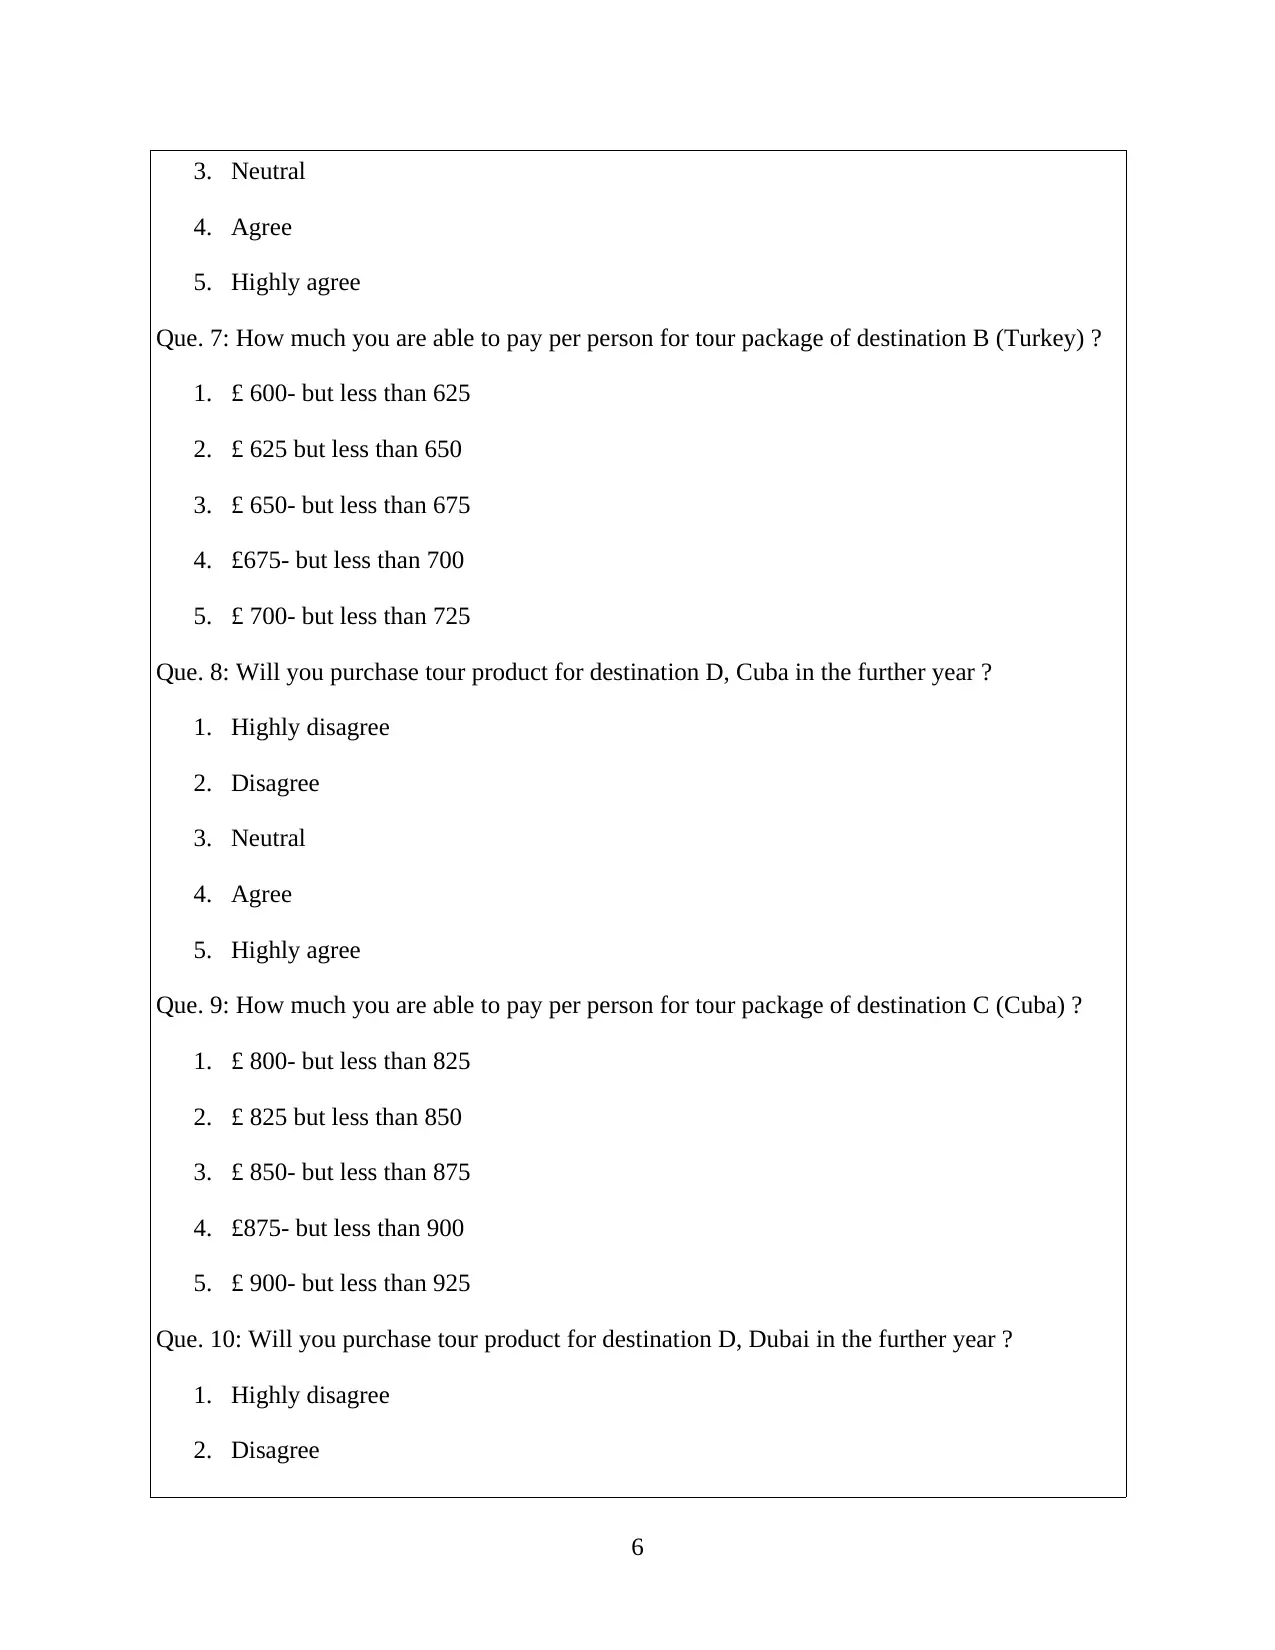
3. Neutral
4. Agree
5. Highly agree
Que. 7: How much you are able to pay per person for tour package of destination B (Turkey) ?
1. £ 600- but less than 625
2. £ 625 but less than 650
3. £ 650- but less than 675
4. £675- but less than 700
5. £ 700- but less than 725
Que. 8: Will you purchase tour product for destination D, Cuba in the further year ?
1. Highly disagree
2. Disagree
3. Neutral
4. Agree
5. Highly agree
Que. 9: How much you are able to pay per person for tour package of destination C (Cuba) ?
1. £ 800- but less than 825
2. £ 825 but less than 850
3. £ 850- but less than 875
4. £875- but less than 900
5. £ 900- but less than 925
Que. 10: Will you purchase tour product for destination D, Dubai in the further year ?
1. Highly disagree
2. Disagree
6
4. Agree
5. Highly agree
Que. 7: How much you are able to pay per person for tour package of destination B (Turkey) ?
1. £ 600- but less than 625
2. £ 625 but less than 650
3. £ 650- but less than 675
4. £675- but less than 700
5. £ 700- but less than 725
Que. 8: Will you purchase tour product for destination D, Cuba in the further year ?
1. Highly disagree
2. Disagree
3. Neutral
4. Agree
5. Highly agree
Que. 9: How much you are able to pay per person for tour package of destination C (Cuba) ?
1. £ 800- but less than 825
2. £ 825 but less than 850
3. £ 850- but less than 875
4. £875- but less than 900
5. £ 900- but less than 925
Que. 10: Will you purchase tour product for destination D, Dubai in the further year ?
1. Highly disagree
2. Disagree
6
3. Neutral
4. Agree
5. Highly agree
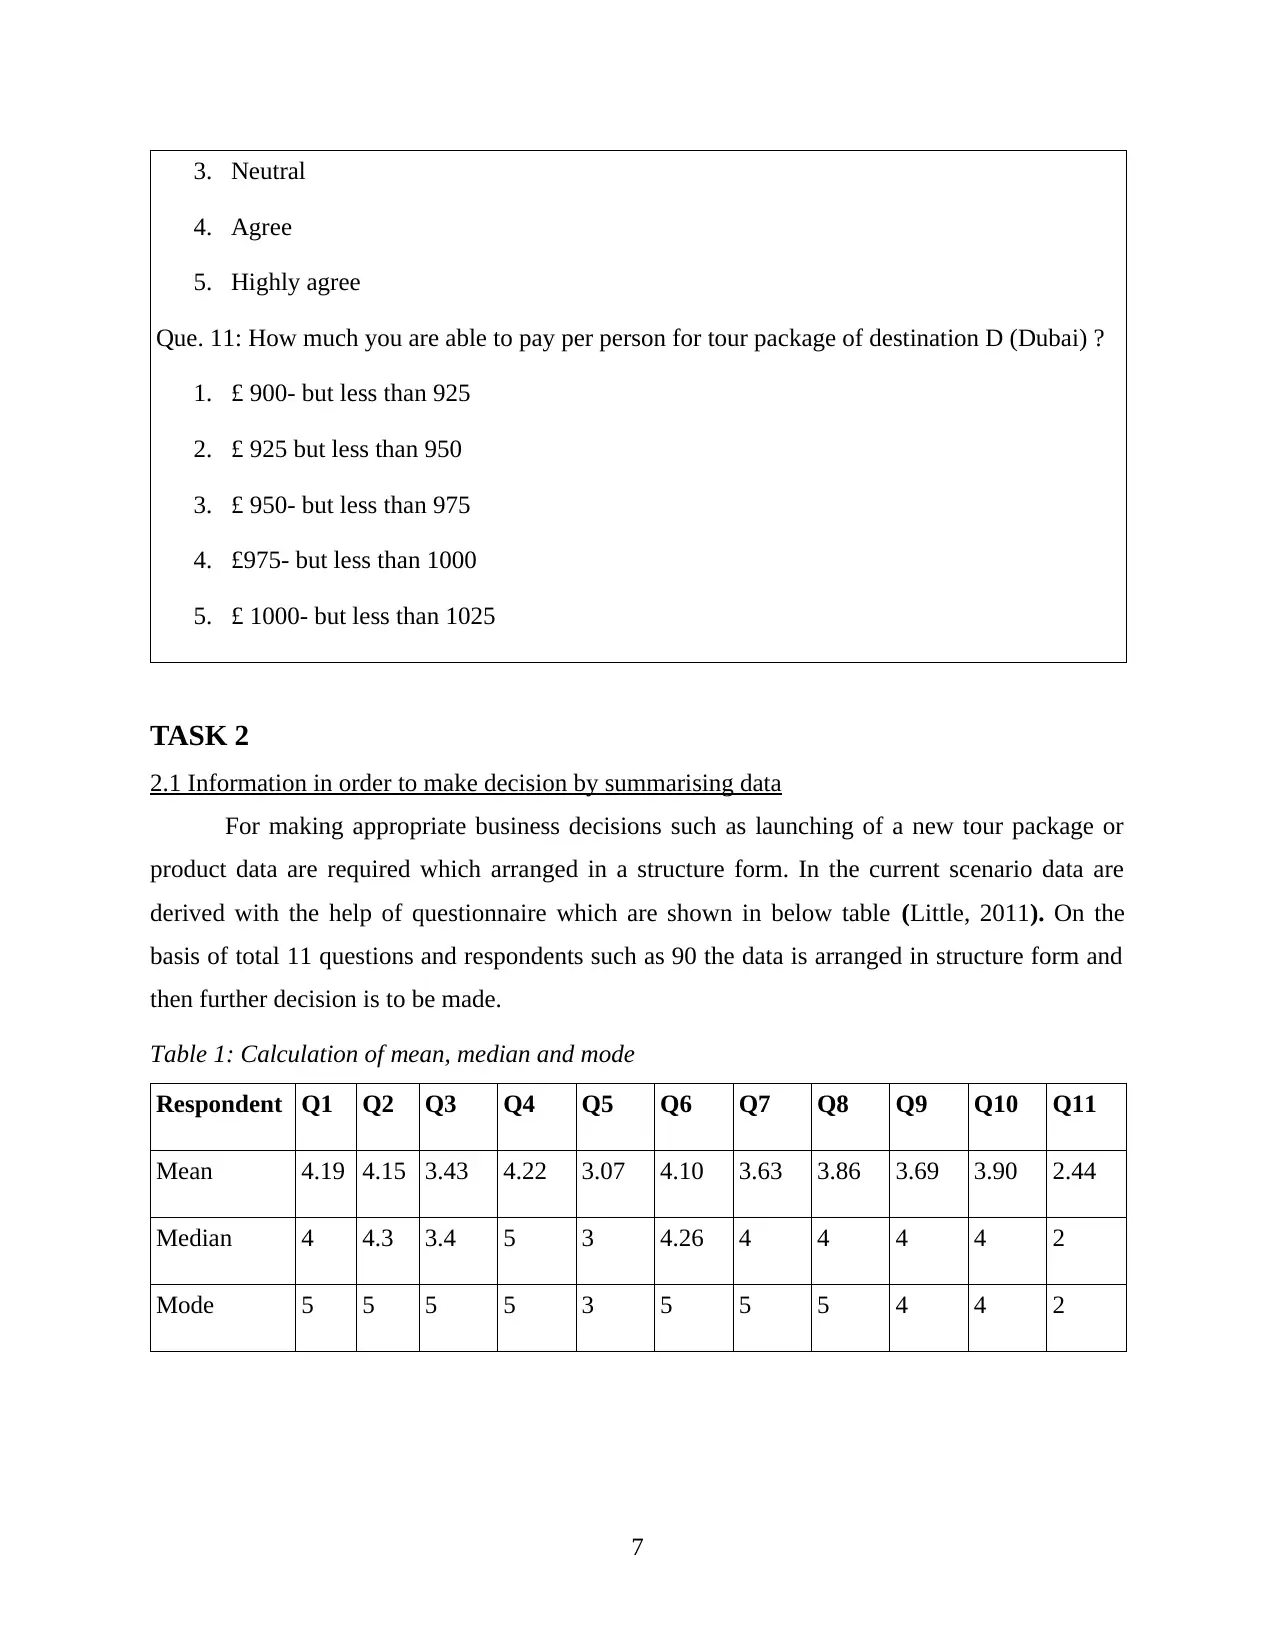
Que. 11: How much you are able to pay per person for tour package of destination D (Dubai) ?
1. £ 900- but less than 925
2. £ 925 but less than 950
3. £ 950- but less than 975
4. £975- but less than 1000
5. £ 1000- but less than 1025
TASK 2
2.1 Information in order to make decision by summarising data
For making appropriate business decisions such as launching of a new tour package or
product data are required which arranged in a structure form. In the current scenario data are
derived with the help of questionnaire which are shown in below table (Little, 2011). On the
basis of total 11 questions and respondents such as 90 the data is arranged in structure form and
then further decision is to be made.
Table 1: Calculation of mean, median and mode
Respondent Q1 Q2 Q3 Q4 Q5 Q6 Q7 Q8 Q9 Q10 Q11
Mean 4.19 4.15 3.43 4.22 3.07 4.10 3.63 3.86 3.69 3.90 2.44
Median 4 4.3 3.4 5 3 4.26 4 4 4 4 2
Mode 5 5 5 5 3 5 5 5 4 4 2
7
4. Agree
5. Highly agree
Que. 11: How much you are able to pay per person for tour package of destination D (Dubai) ?
1. £ 900- but less than 925
2. £ 925 but less than 950
3. £ 950- but less than 975
4. £975- but less than 1000
5. £ 1000- but less than 1025
TASK 2
2.1 Information in order to make decision by summarising data
For making appropriate business decisions such as launching of a new tour package or
product data are required which arranged in a structure form. In the current scenario data are
derived with the help of questionnaire which are shown in below table (Little, 2011). On the
basis of total 11 questions and respondents such as 90 the data is arranged in structure form and
then further decision is to be made.
Table 1: Calculation of mean, median and mode
Respondent Q1 Q2 Q3 Q4 Q5 Q6 Q7 Q8 Q9 Q10 Q11
Mean 4.19 4.15 3.43 4.22 3.07 4.10 3.63 3.86 3.69 3.90 2.44
Median 4 4.3 3.4 5 3 4.26 4 4 4 4 2
Mode 5 5 5 5 3 5 5 5 4 4 2
7
⊘ This is a preview!⊘
Do you want full access?
Subscribe today to unlock all pages.
Trusted by 1+ million students worldwide
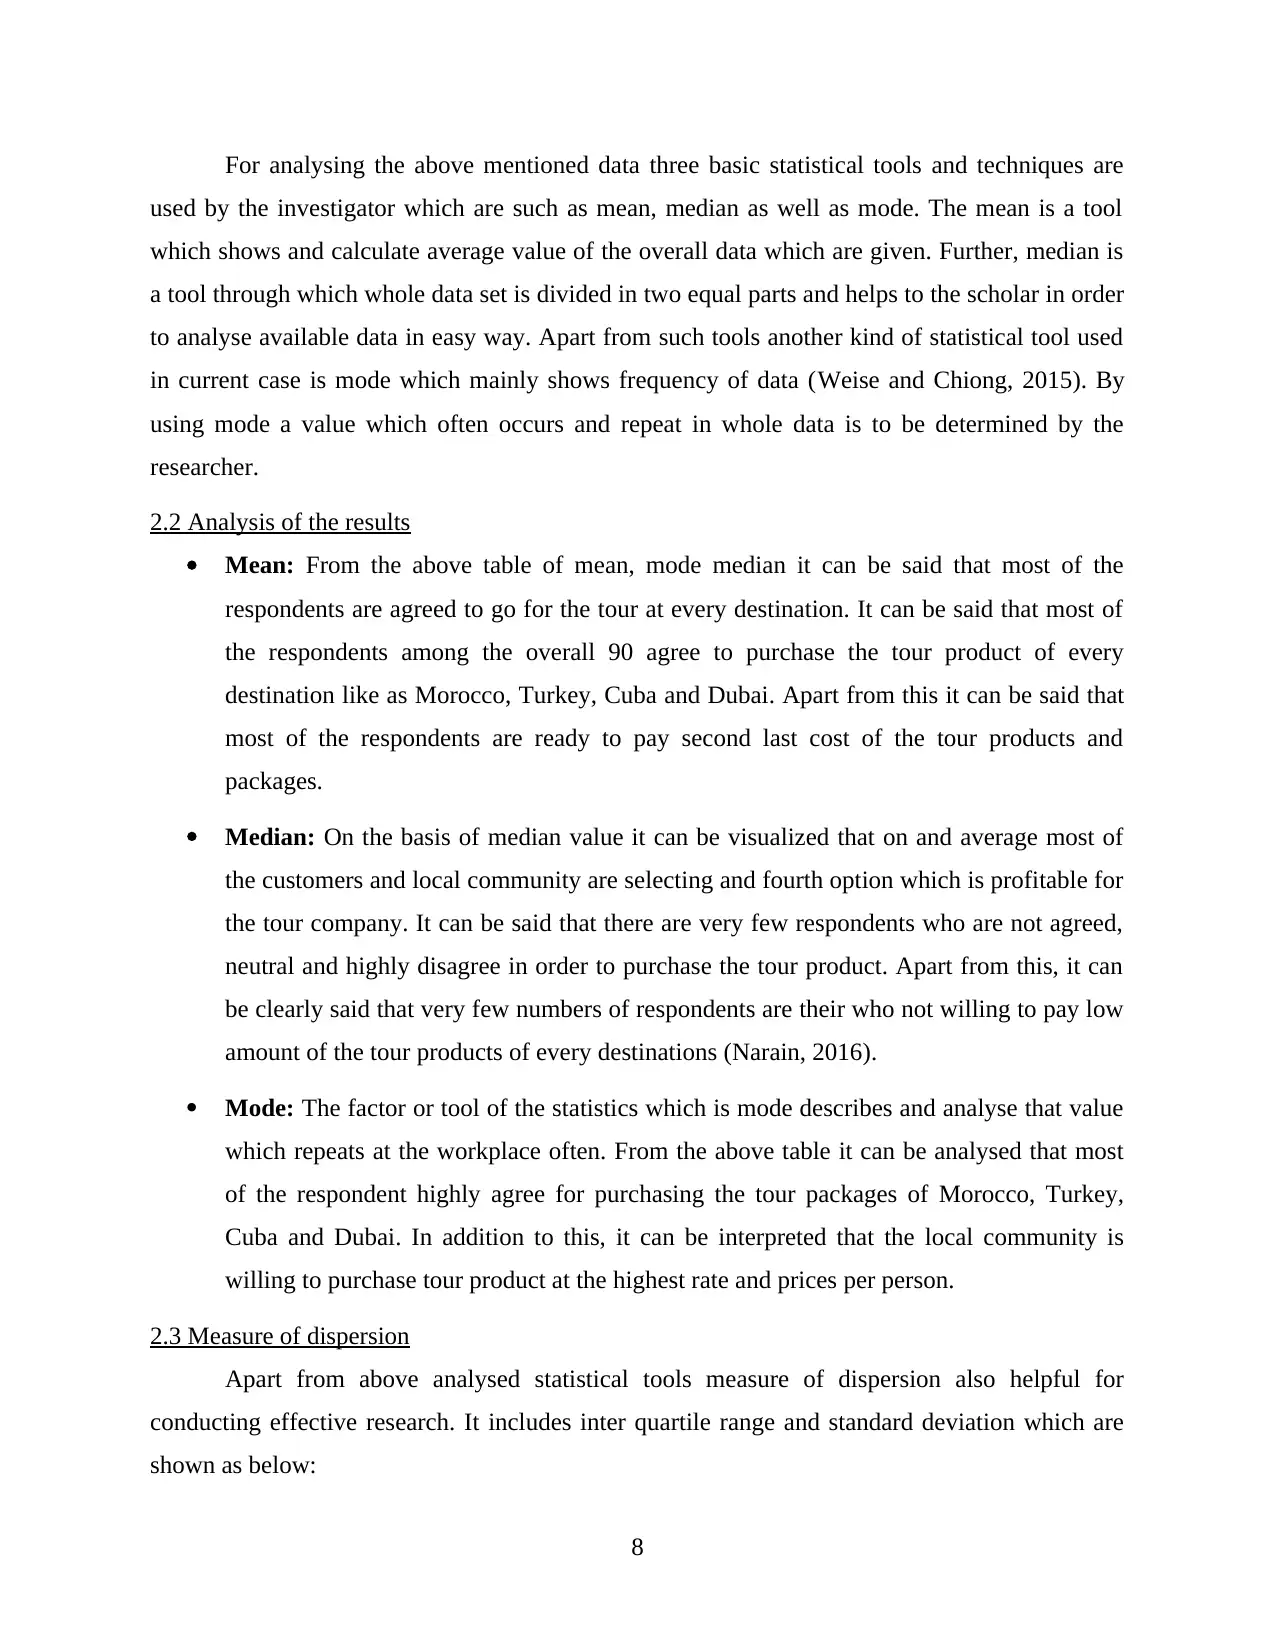
For analysing the above mentioned data three basic statistical tools and techniques are
used by the investigator which are such as mean, median as well as mode. The mean is a tool
which shows and calculate average value of the overall data which are given. Further, median is
a tool through which whole data set is divided in two equal parts and helps to the scholar in order
to analyse available data in easy way. Apart from such tools another kind of statistical tool used
in current case is mode which mainly shows frequency of data (Weise and Chiong, 2015). By
using mode a value which often occurs and repeat in whole data is to be determined by the
researcher.
2.2 Analysis of the results
Mean: From the above table of mean, mode median it can be said that most of the
respondents are agreed to go for the tour at every destination. It can be said that most of
the respondents among the overall 90 agree to purchase the tour product of every
destination like as Morocco, Turkey, Cuba and Dubai. Apart from this it can be said that
most of the respondents are ready to pay second last cost of the tour products and
packages.
Median: On the basis of median value it can be visualized that on and average most of
the customers and local community are selecting and fourth option which is profitable for
the tour company. It can be said that there are very few respondents who are not agreed,
neutral and highly disagree in order to purchase the tour product. Apart from this, it can
be clearly said that very few numbers of respondents are their who not willing to pay low
amount of the tour products of every destinations (Narain, 2016).
Mode: The factor or tool of the statistics which is mode describes and analyse that value
which repeats at the workplace often. From the above table it can be analysed that most
of the respondent highly agree for purchasing the tour packages of Morocco, Turkey,
Cuba and Dubai. In addition to this, it can be interpreted that the local community is
willing to purchase tour product at the highest rate and prices per person.
2.3 Measure of dispersion
Apart from above analysed statistical tools measure of dispersion also helpful for
conducting effective research. It includes inter quartile range and standard deviation which are
shown as below:
8
Paraphrase This Document
Need a fresh take? Get an instant paraphrase of this document with our AI Paraphraser
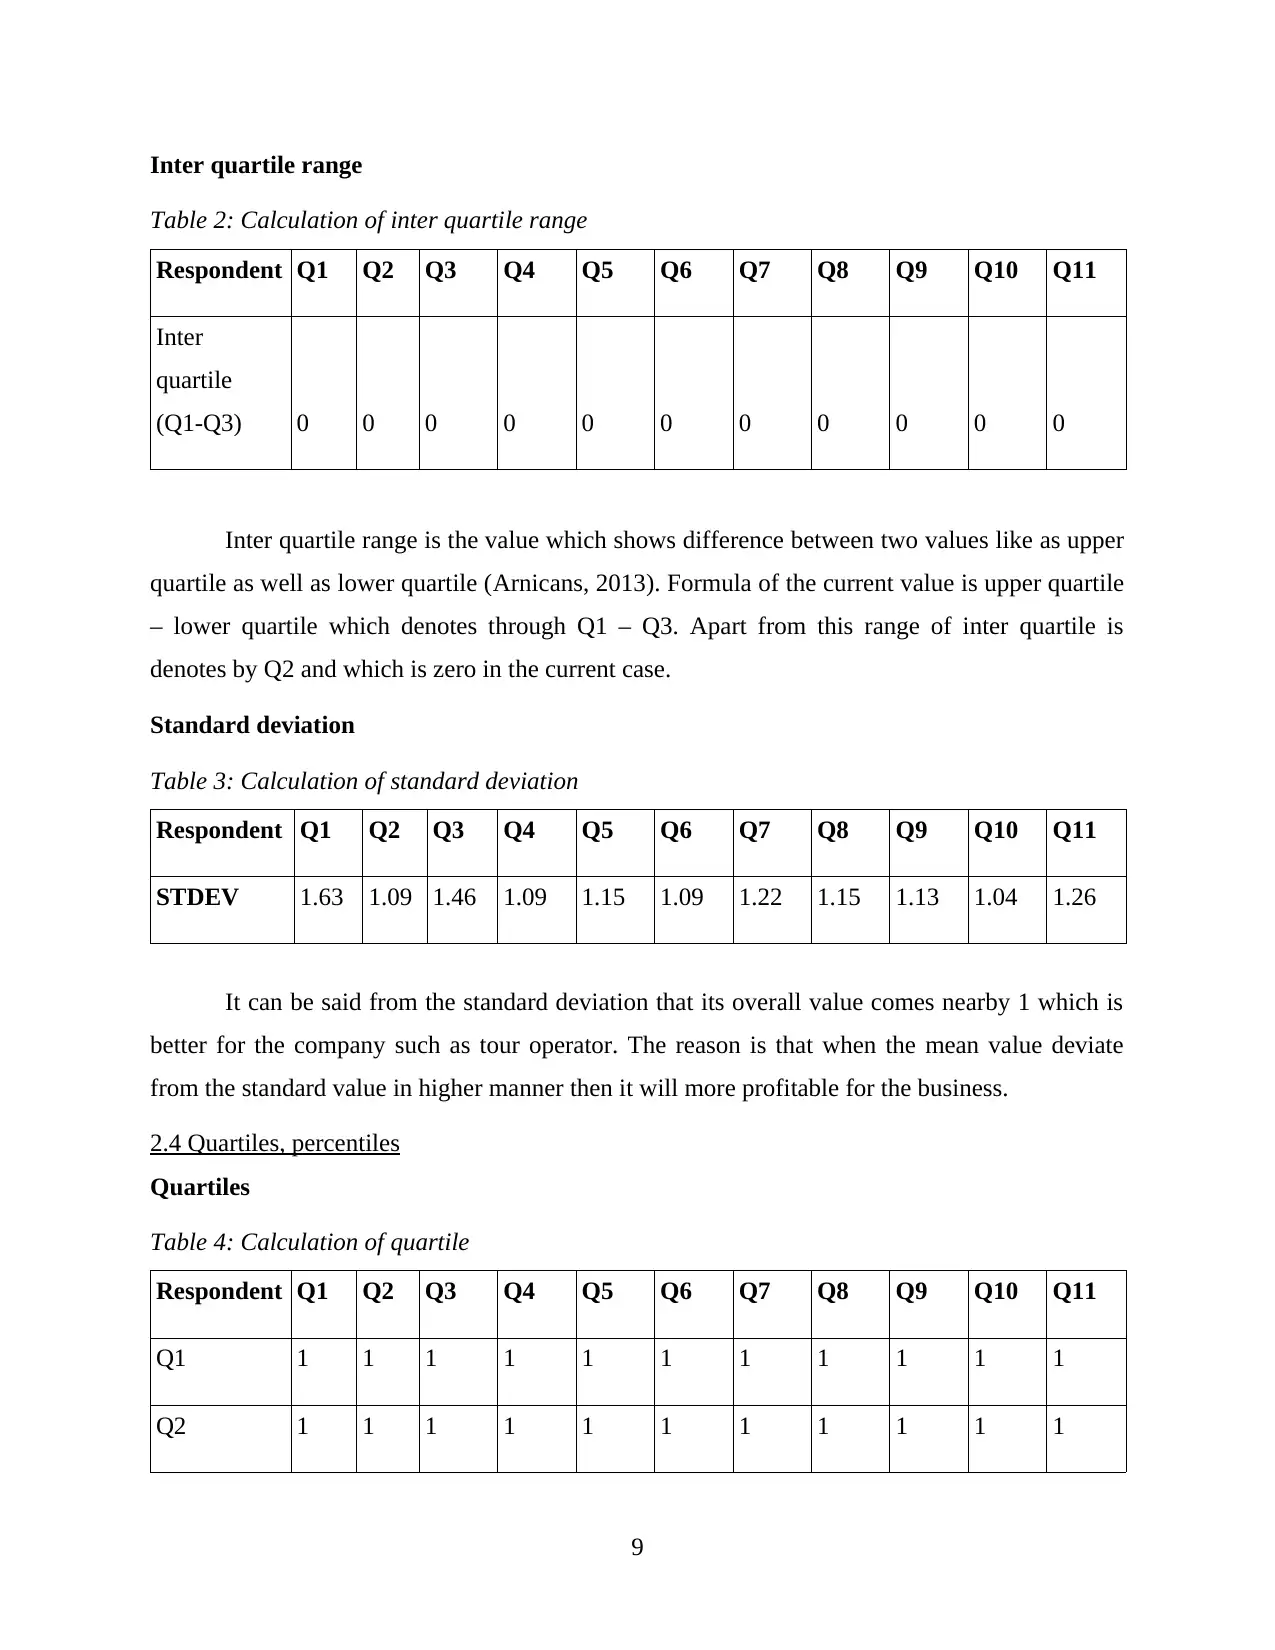
Inter quartile range
Table 2: Calculation of inter quartile range
Respondent Q1 Q2 Q3 Q4 Q5 Q6 Q7 Q8 Q9 Q10 Q11
Inter
quartile
(Q1-Q3) 0 0 0 0 0 0 0 0 0 0 0
Inter quartile range is the value which shows difference between two values like as upper
quartile as well as lower quartile (Arnicans, 2013). Formula of the current value is upper quartile
– lower quartile which denotes through Q1 – Q3. Apart from this range of inter quartile is
denotes by Q2 and which is zero in the current case.
Standard deviation
Table 3: Calculation of standard deviation
Respondent Q1 Q2 Q3 Q4 Q5 Q6 Q7 Q8 Q9 Q10 Q11
STDEV 1.63 1.09 1.46 1.09 1.15 1.09 1.22 1.15 1.13 1.04 1.26
It can be said from the standard deviation that its overall value comes nearby 1 which is
better for the company such as tour operator. The reason is that when the mean value deviate
from the standard value in higher manner then it will more profitable for the business.
2.4 Quartiles, percentiles
Quartiles
Table 4: Calculation of quartile
Respondent Q1 Q2 Q3 Q4 Q5 Q6 Q7 Q8 Q9 Q10 Q11
Q1 1 1 1 1 1 1 1 1 1 1 1
Q2 1 1 1 1 1 1 1 1 1 1 1
9
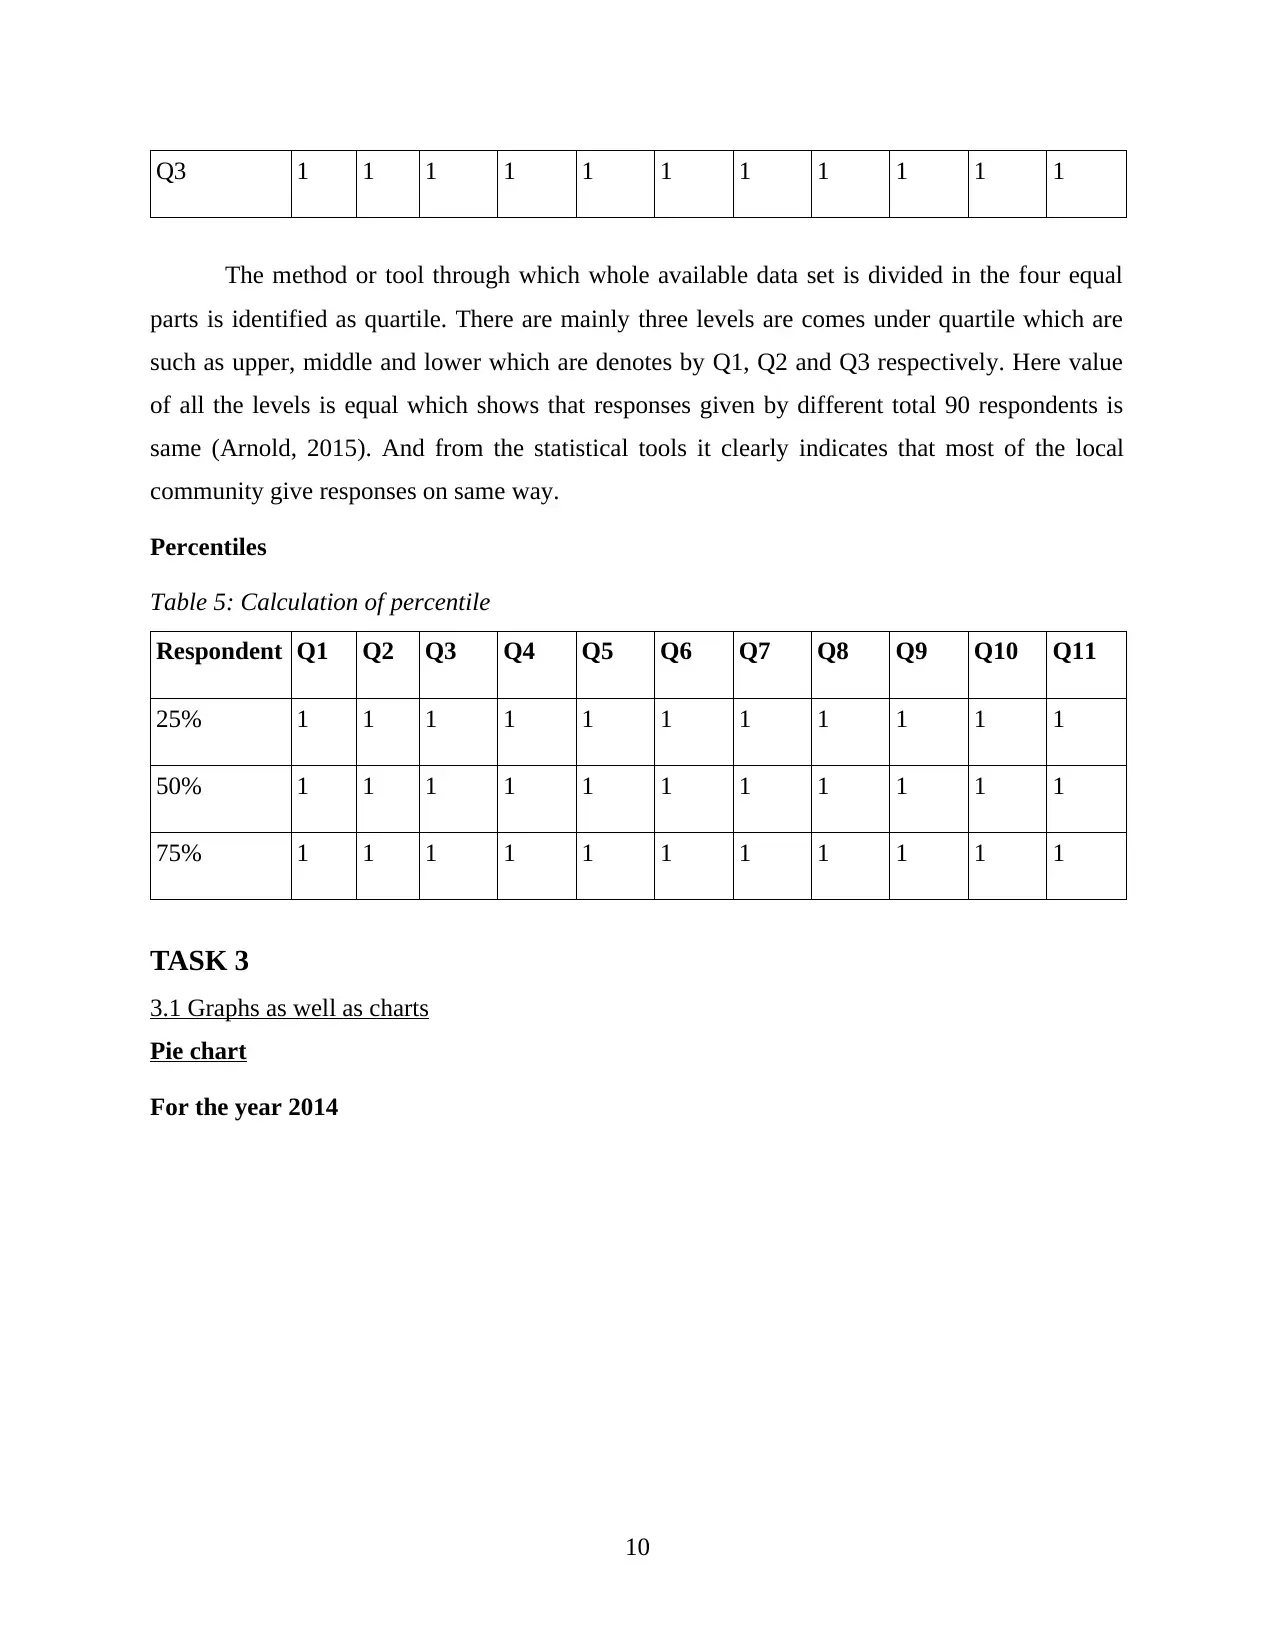
Q3 1 1 1 1 1 1 1 1 1 1 1
The method or tool through which whole available data set is divided in the four equal
parts is identified as quartile. There are mainly three levels are comes under quartile which are
such as upper, middle and lower which are denotes by Q1, Q2 and Q3 respectively. Here value
of all the levels is equal which shows that responses given by different total 90 respondents is
same (Arnold, 2015). And from the statistical tools it clearly indicates that most of the local
community give responses on same way.
Percentiles
Table 5: Calculation of percentile
Respondent Q1 Q2 Q3 Q4 Q5 Q6 Q7 Q8 Q9 Q10 Q11
25% 1 1 1 1 1 1 1 1 1 1 1
50% 1 1 1 1 1 1 1 1 1 1 1
75% 1 1 1 1 1 1 1 1 1 1 1
TASK 3
3.1 Graphs as well as charts
Pie chart
For the year 2014
10
⊘ This is a preview!⊘
Do you want full access?
Subscribe today to unlock all pages.
Trusted by 1+ million students worldwide
1 out of 41
Related Documents


Your All-in-One AI-Powered Toolkit for Academic Success.
+13062052269
info@desklib.com
Available 24*7 on WhatsApp / Email
![[object Object]](/_next/static/media/star-bottom.7253800d.svg)
Unlock your academic potential
Copyright © 2020–2026 A2Z Services. All Rights Reserved. Developed and managed by ZUCOL.