Business Decision Making Report: Analysis of Thomas Cook's Strategies
VerifiedAdded on 2020/02/03
|26
|5637
|180
Report
AI Summary
This report provides a comprehensive analysis of Thomas Cook's business decision-making processes, focusing on the launch of new tour packages. It begins with an introduction to the role of statistics in business analytics and the selection of Thomas Cook as a case study. Task 1 explores market research methodologies, including primary and secondary data collection, and various sampling techniques like random and stratified sampling. A questionnaire example is also included. Task 2 delves into data analysis, presenting customer feedback in a pie chart and calculating measures of central tendency (mean, median, and mode) to understand customer spending patterns. Task 3 (included as a PowerPoint presentation) likely covers capital budgeting tools and project evaluation. Task 4 examines the company's performance over several years, using descriptive statistics to analyze sales and profit. The report concludes with overall findings and references.

BUSINESS DECISION MAKING
Paraphrase This Document
Need a fresh take? Get an instant paraphrase of this document with our AI Paraphraser
Table of Contents
INTRODUCTION 3
TASK 1 3
1.1 3
1.2 3
1.3 4
TASK 2 5
2.1&2.2 5
2.3 7
2.4 8
TASK 3 10
3.1 10
3.2 11
3.3 Enclosed in Power point presentation 12
3.4 18
TASK 4 19
4.1 19
4.2 20
4.3 22
CONCLUSIONS 24
REFERENCES 25
INTRODUCTION 3
TASK 1 3
1.1 3
1.2 3
1.3 4
TASK 2 5
2.1&2.2 5
2.3 7
2.4 8
TASK 3 10
3.1 10
3.2 11
3.3 Enclosed in Power point presentation 12
3.4 18
TASK 4 19
4.1 19
4.2 20
4.3 22
CONCLUSIONS 24
REFERENCES 25
INTRODUCTION
The role of statistics has increased with the increasing interfaces that clarify the data
related problems of an entity on a global level. Business analytics are using the traditional
statistical measure that helps an entity in order to predict the future. Thomas Cook has been
selected for this project report which has been used in order to develop their new product to lire
most of their customers. This is all about collecting primary data by conducting survey through
questionnaires. The data collected by an entity is summarized by using measures of central
tendency such as mean, median and mode majorly. The business projects are evaluated by using
capital budgeting tools in order to assess the feasibility and viability of the projects.
TASK 1
1.1
The complex job involves while opening a new business is to conduct market research
which helps in enhancing the business efficiency. The market research conducted by research
will be able gather facts and figures to support the research. Data that can be collected for
conducting a smooth research can be obtained by applying two major research approaches such
as primary and secondary sources of the data. Information can be in the form of different facts
and figures collected from first-hand and original source of data by individual person. Secondary
sources of data are also referring to as taking external and highly efficient data which saves the
time of an individual. It is the best suitable data which can be obtained without wasting time or
appointing any counsellor in gathering the data personally. The primary objective of this
particular research study is to gather facts and figures in order to launch their new product of
offering tour packages to lure their customers.
Primary data collection- The Thomas Cook can use Primary data collection methods in order
to gather evidences to support their research. The questionnaires can be used in order to develop
their overall products. The primary data will be collected by developing questionnaires in which
the questions are related with the overall consumer profile by seeking their taste and preferences
while designing new tour package. The questions are asked related to the consumer profile,
buying behaviour, competitive products and their attitude in buying new product.
Secondary data collection- The secondary research can be obtained by using books, journals,
articles and several records of the government. The data regarding the market can be collected by
accessing the internal materials and the government records.
1.2
Sampling is regarded one of the important element in conducting particular research
study which stresses on gathering data from various sources that can produce reliable
information. There are several forms of sampling methods which can be used by an entity in
order to produce accurate results to support an entity which are given as below:
Random sampling- The random samples are selected blindly by applying personal belief of an
individual and rely on the intuition to achieve their project aim. The samples size is selected in
the advance before conducting research in a particular area. The samples are randomly selected
from large base of population without specifically observed its efficiency and relevancy. For
⊘ This is a preview!⊘
Do you want full access?
Subscribe today to unlock all pages.
Trusted by 1+ million students worldwide
instance, The Thomas cook has designed a batch of 200 customers which are further segmented
into different areas to catch the interest of wide number of customers according to their tastes
and preferences.
Stratified sampling- This form of sampling method is recognised with another name of cluster
sampling technique which are gathered data in strata or a kind of group of same category.
Samples are designed which is basically a group of samples categorised as per different criteria
of the research. The products are designed by an entity which will segmented their overall
products into different demographic features such as age, gender.
The sampling techniques will be used by a researcher in order to conduct their survey in
order to obtain the right information to support the aim of the research study. The survey will be
conducted in two modes such as primary and secondary data modes. The researcher will
personally collect the data by asking respondents in form of questionnaires and interview
methods. On the contrary to it secondary research will be organised by observing the government
records and census data. The 50 respondents are asked in a set of 4 that is in total 200 customers
are asked personally by the researcher in order to take their positive or negative feedbacks in
order to add or improve the current development of products. The customer are asked by getting
their responses immediately on the spot to resolve the problems.
1.3
QUESTIONNAIRE FOR RESEARCH
Name:____________
Age: ______
Gender
Male () Female () Transgender ()
Do you visit Thomas Cook centre?
Yes []
No []
Frequency of visiting Thomas cook travel centres?
Once in month {}
Once in year {}
What factors beat competitors of Thomas Cook?
o Discount ()
o Quality ()
o Brand ()
o Locality ()
Which are the factors you considered before Booking for any tour packages at Thomas Cook?
Price []
Quality []
Store location []
Refund policy []
In terms of service quality what rank you want to give Thomas Cook as compare to their
competitors?
Excellent ()
Good ()
Average ()
Poor ()
Paraphrase This Document
Need a fresh take? Get an instant paraphrase of this document with our AI Paraphraser
Which rival firms store you often visit?
Cox& kings []
Make my trip []
Please give your valuable suggestions in relevant areas where Tesco must bring changes in its
services __________________________________________________________________
TASK 2
2.1&2.2
Customers Responses %
50 Product information 45.00%
60 Product Packaging 40.00%
50 Product performance 30.00%
50.0%
25.0%
15.0%
Outstanding
Satisfactory
Dissatisfactory
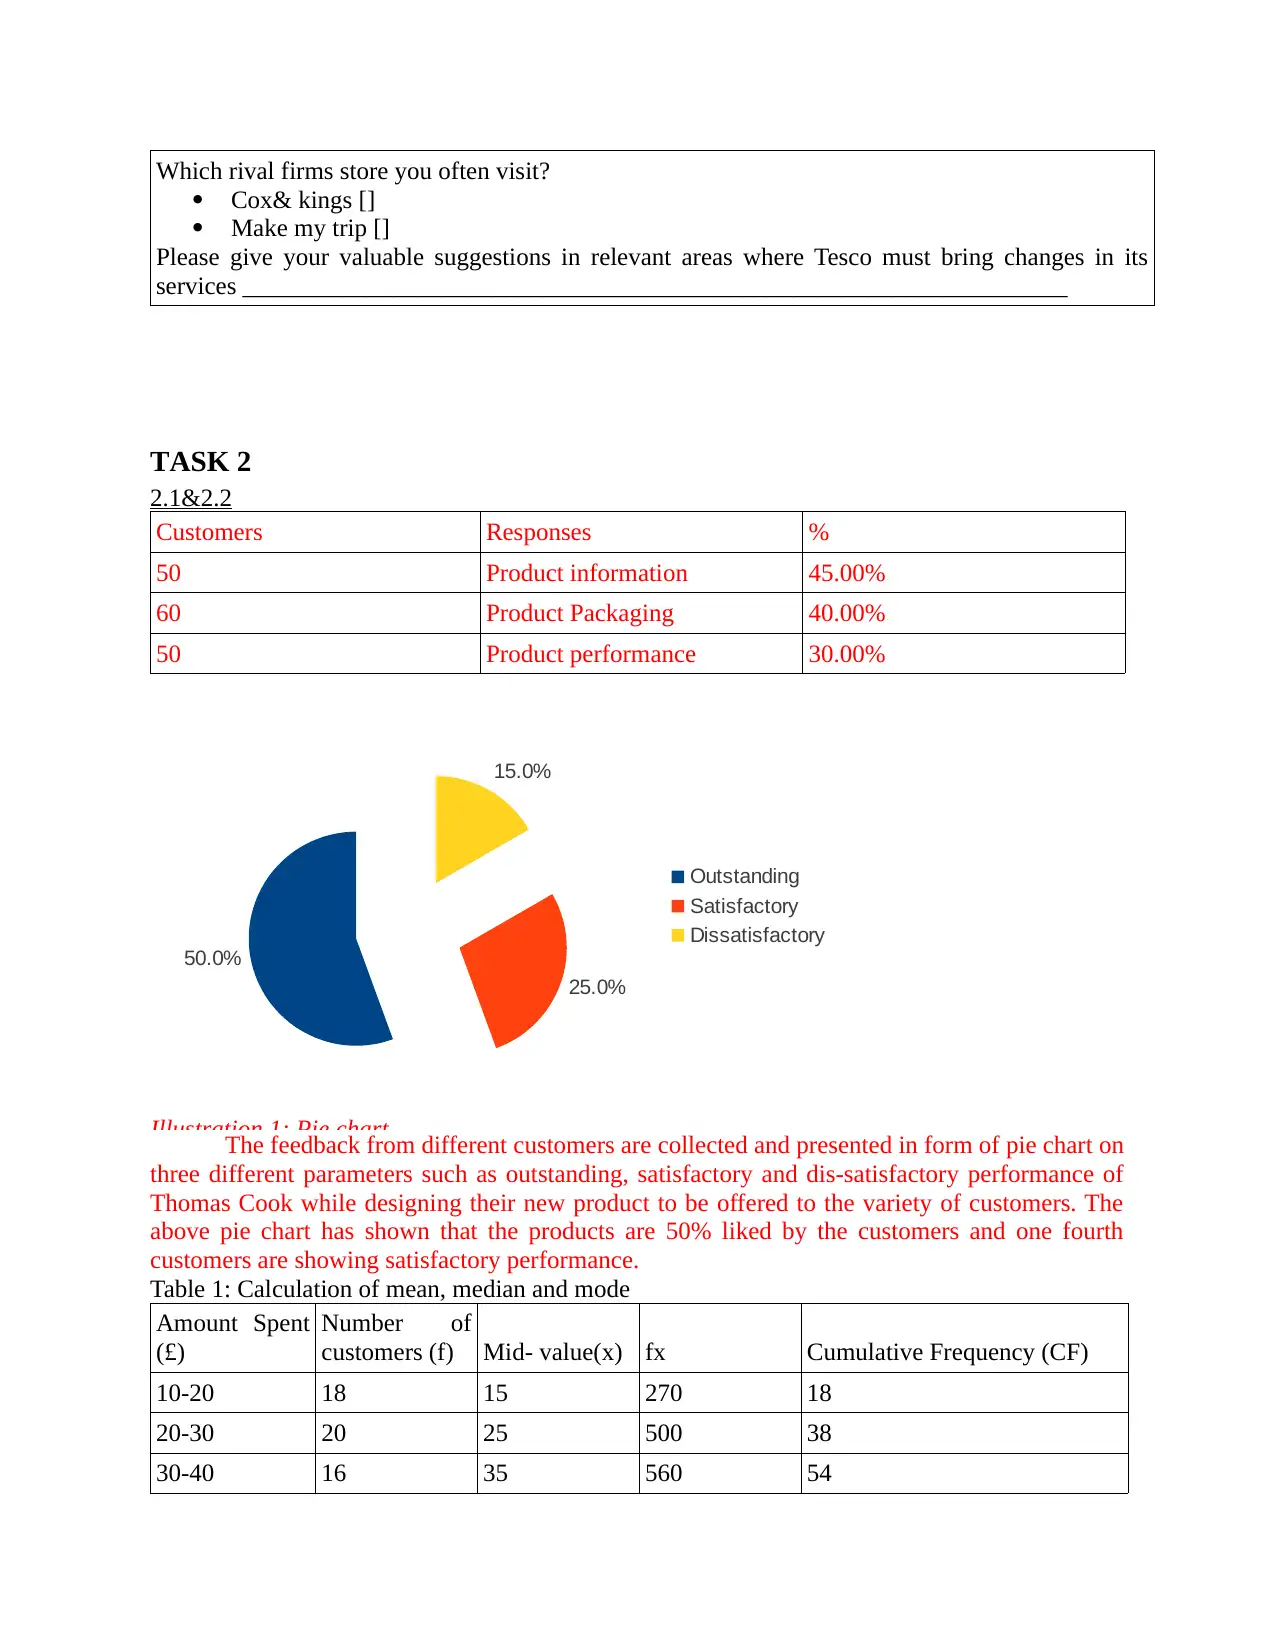
Illustration 1: Pie chart
The feedback from different customers are collected and presented in form of pie chart on
three different parameters such as outstanding, satisfactory and dis-satisfactory performance of
Thomas Cook while designing their new product to be offered to the variety of customers. The
above pie chart has shown that the products are 50% liked by the customers and one fourth
customers are showing satisfactory performance.
Table 1: Calculation of mean, median and mode
Amount Spent
(£)
Number of
customers (f) Mid- value(x) fx Cumulative Frequency (CF)
10-20 18 15 270 18
20-30 20 25 500 38
30-40 16 35 560 54
Cox& kings []
Make my trip []
Please give your valuable suggestions in relevant areas where Tesco must bring changes in its
services __________________________________________________________________
TASK 2
2.1&2.2
Customers Responses %
50 Product information 45.00%
60 Product Packaging 40.00%
50 Product performance 30.00%
50.0%
25.0%
15.0%
Outstanding
Satisfactory
Dissatisfactory
Illustration 1: Pie chart
The feedback from different customers are collected and presented in form of pie chart on
three different parameters such as outstanding, satisfactory and dis-satisfactory performance of
Thomas Cook while designing their new product to be offered to the variety of customers. The
above pie chart has shown that the products are 50% liked by the customers and one fourth
customers are showing satisfactory performance.
Table 1: Calculation of mean, median and mode
Amount Spent
(£)
Number of
customers (f) Mid- value(x) fx Cumulative Frequency (CF)
10-20 18 15 270 18
20-30 20 25 500 38
30-40 16 35 560 54
40-50 14 45 630 68
50-60 12 55 660 80
60-70 8 65 520 88
70-80 6 75 450 94
80-90 4 85 340 98
90-100 2 95 190 100
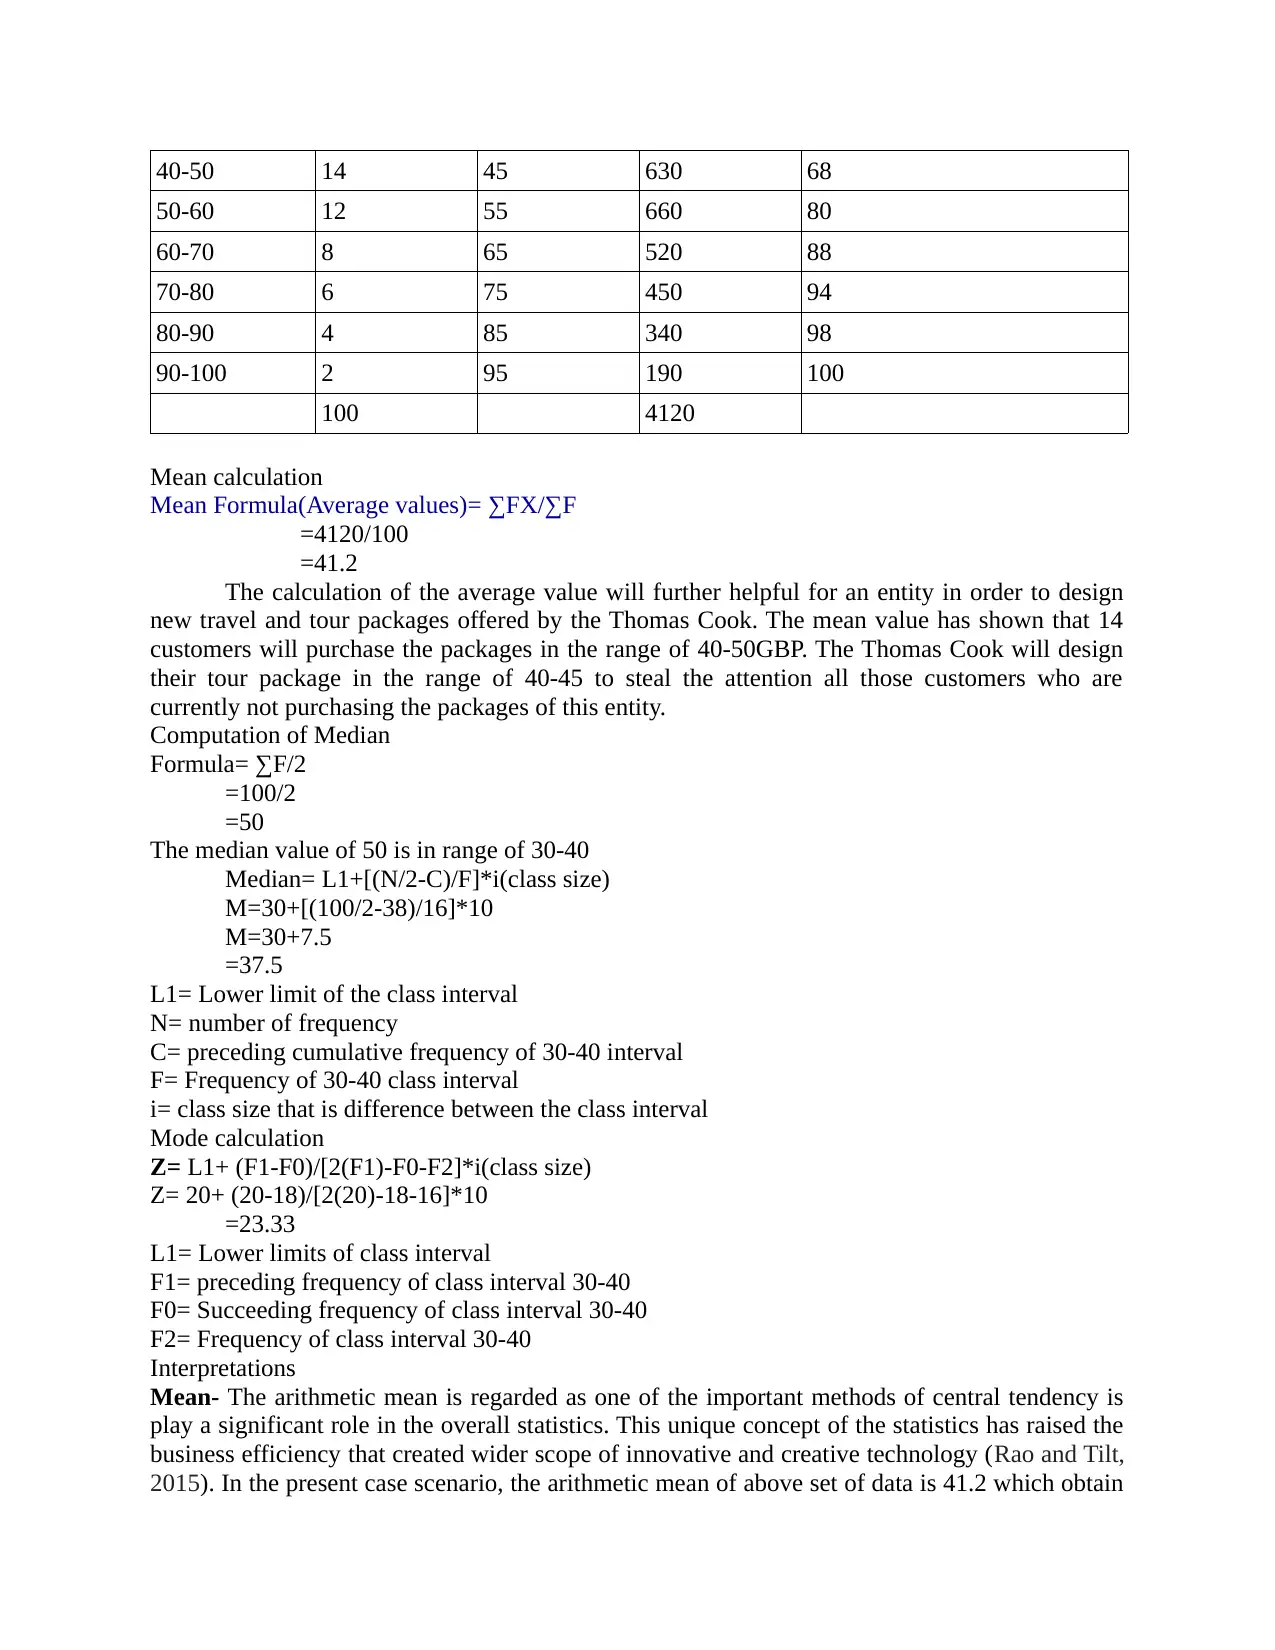
100 4120
Mean calculation
Mean Formula(Average values)= ∑FX/∑F
=4120/100
=41.2
The calculation of the average value will further helpful for an entity in order to design
new travel and tour packages offered by the Thomas Cook. The mean value has shown that 14
customers will purchase the packages in the range of 40-50GBP. The Thomas Cook will design
their tour package in the range of 40-45 to steal the attention all those customers who are
currently not purchasing the packages of this entity.
Computation of Median
Formula= ∑F/2
=100/2
=50
The median value of 50 is in range of 30-40
Median= L1+[(N/2-C)/F]*i(class size)
M=30+[(100/2-38)/16]*10
M=30+7.5
=37.5
L1= Lower limit of the class interval
N= number of frequency
C= preceding cumulative frequency of 30-40 interval
F= Frequency of 30-40 class interval
i= class size that is difference between the class interval
Mode calculation
Z= L1+ (F1-F0)/[2(F1)-F0-F2]*i(class size)
Z= 20+ (20-18)/[2(20)-18-16]*10
=23.33
L1= Lower limits of class interval
F1= preceding frequency of class interval 30-40
F0= Succeeding frequency of class interval 30-40
F2= Frequency of class interval 30-40
Interpretations
Mean- The arithmetic mean is regarded as one of the important methods of central tendency is
play a significant role in the overall statistics. This unique concept of the statistics has raised the
business efficiency that created wider scope of innovative and creative technology (Rao and Tilt,
2015). In the present case scenario, the arithmetic mean of above set of data is 41.2 which obtain
50-60 12 55 660 80
60-70 8 65 520 88
70-80 6 75 450 94
80-90 4 85 340 98
90-100 2 95 190 100
100 4120
Mean calculation
Mean Formula(Average values)= ∑FX/∑F
=4120/100
=41.2
The calculation of the average value will further helpful for an entity in order to design
new travel and tour packages offered by the Thomas Cook. The mean value has shown that 14
customers will purchase the packages in the range of 40-50GBP. The Thomas Cook will design
their tour package in the range of 40-45 to steal the attention all those customers who are
currently not purchasing the packages of this entity.
Computation of Median
Formula= ∑F/2
=100/2
=50
The median value of 50 is in range of 30-40
Median= L1+[(N/2-C)/F]*i(class size)
M=30+[(100/2-38)/16]*10
M=30+7.5
=37.5
L1= Lower limit of the class interval
N= number of frequency
C= preceding cumulative frequency of 30-40 interval
F= Frequency of 30-40 class interval
i= class size that is difference between the class interval
Mode calculation
Z= L1+ (F1-F0)/[2(F1)-F0-F2]*i(class size)
Z= 20+ (20-18)/[2(20)-18-16]*10
=23.33
L1= Lower limits of class interval
F1= preceding frequency of class interval 30-40
F0= Succeeding frequency of class interval 30-40
F2= Frequency of class interval 30-40
Interpretations
Mean- The arithmetic mean is regarded as one of the important methods of central tendency is
play a significant role in the overall statistics. This unique concept of the statistics has raised the
business efficiency that created wider scope of innovative and creative technology (Rao and Tilt,
2015). In the present case scenario, the arithmetic mean of above set of data is 41.2 which obtain
⊘ This is a preview!⊘
Do you want full access?
Subscribe today to unlock all pages.
Trusted by 1+ million students worldwide
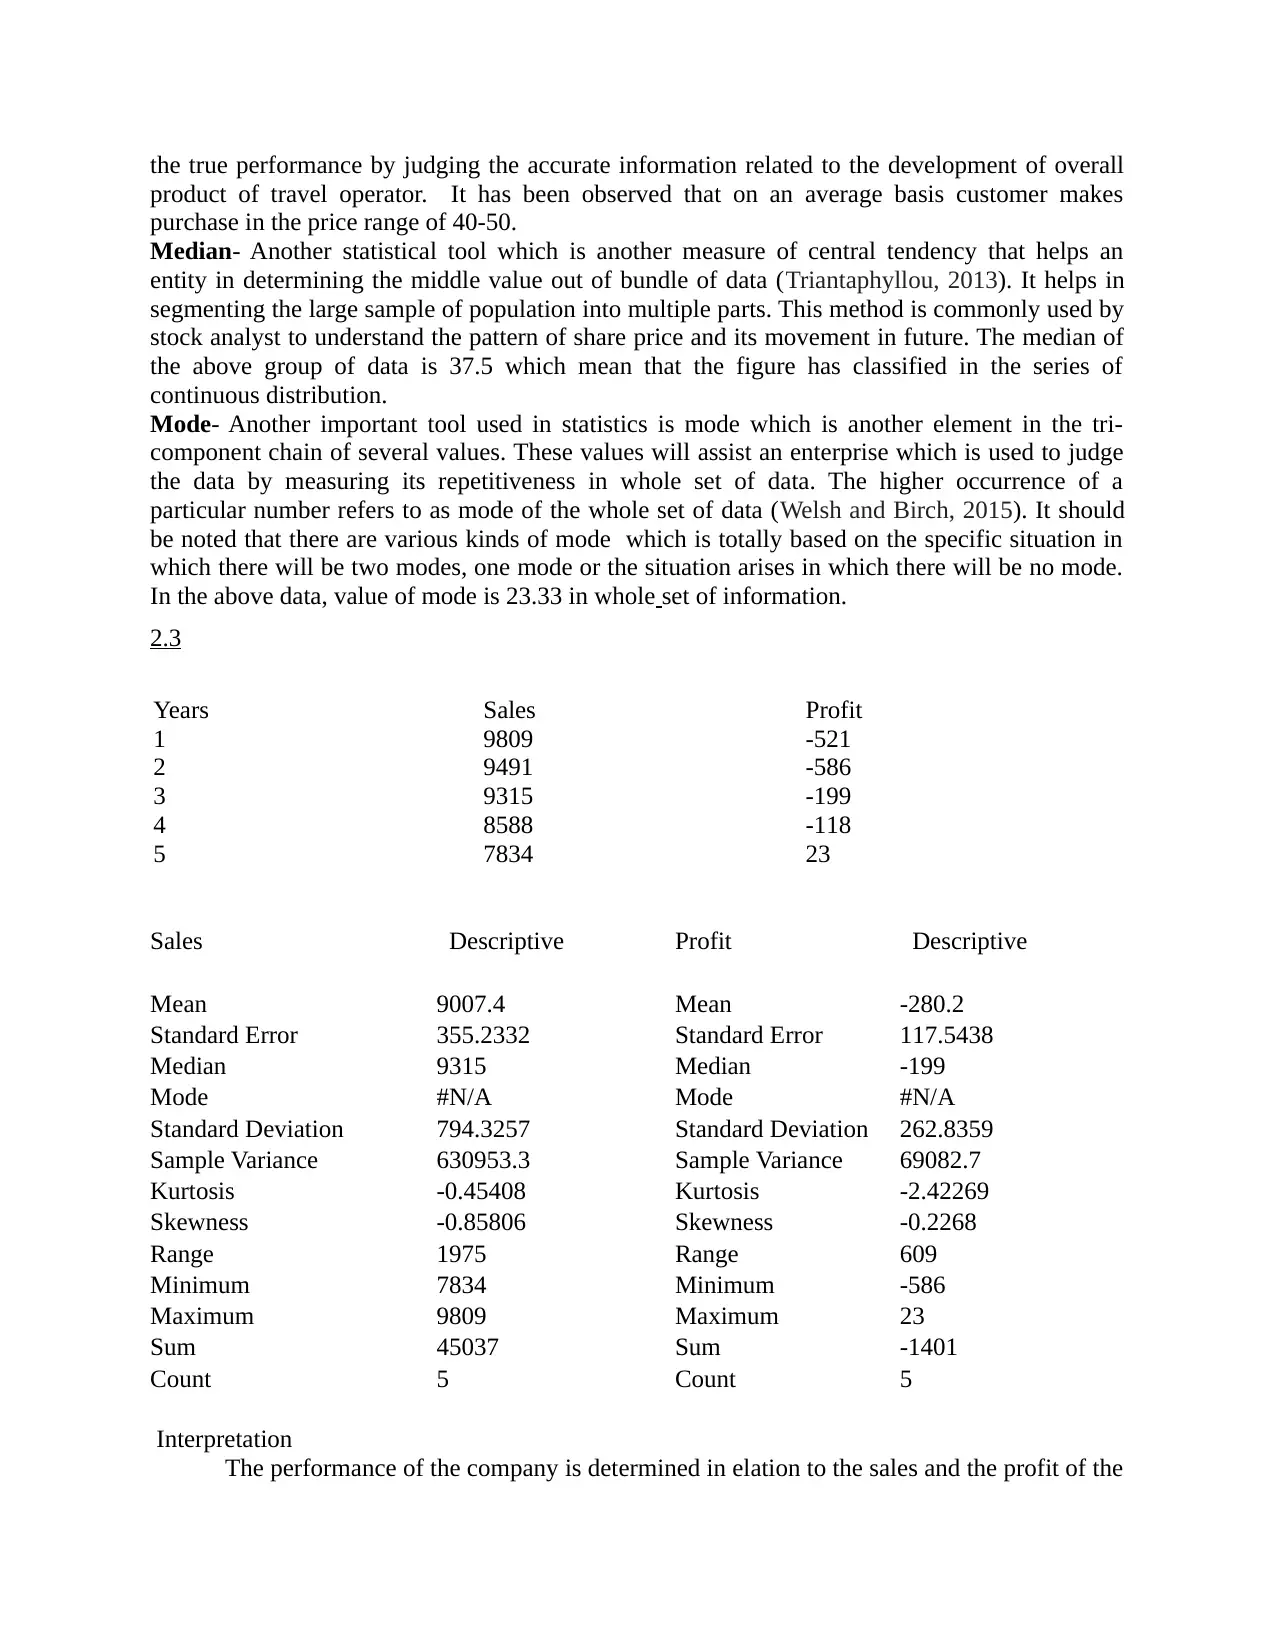
the true performance by judging the accurate information related to the development of overall
product of travel operator. It has been observed that on an average basis customer makes
purchase in the price range of 40-50.
Median- Another statistical tool which is another measure of central tendency that helps an
entity in determining the middle value out of bundle of data (Triantaphyllou, 2013). It helps in
segmenting the large sample of population into multiple parts. This method is commonly used by
stock analyst to understand the pattern of share price and its movement in future. The median of
the above group of data is 37.5 which mean that the figure has classified in the series of
continuous distribution.
Mode- Another important tool used in statistics is mode which is another element in the tri-
component chain of several values. These values will assist an enterprise which is used to judge
the data by measuring its repetitiveness in whole set of data. The higher occurrence of a
particular number refers to as mode of the whole set of data (Welsh and Birch, 2015). It should
be noted that there are various kinds of mode which is totally based on the specific situation in
which there will be two modes, one mode or the situation arises in which there will be no mode.
In the above data, value of mode is 23.33 in whole set of information.
2.3
Years Sales Profit
1 9809 -521
2 9491 -586
3 9315 -199
4 8588 -118
5 7834 23
Sales Descriptive Profit Descriptive
Mean 9007.4 Mean -280.2
Standard Error 355.2332 Standard Error 117.5438
Median 9315 Median -199
Mode #N/A Mode #N/A
Standard Deviation 794.3257 Standard Deviation 262.8359
Sample Variance 630953.3 Sample Variance 69082.7
Kurtosis -0.45408 Kurtosis -2.42269
Skewness -0.85806 Skewness -0.2268
Range 1975 Range 609
Minimum 7834 Minimum -586
Maximum 9809 Maximum 23
Sum 45037 Sum -1401
Count 5 Count 5
Interpretation
The performance of the company is determined in elation to the sales and the profit of the
Paraphrase This Document
Need a fresh take? Get an instant paraphrase of this document with our AI Paraphraser
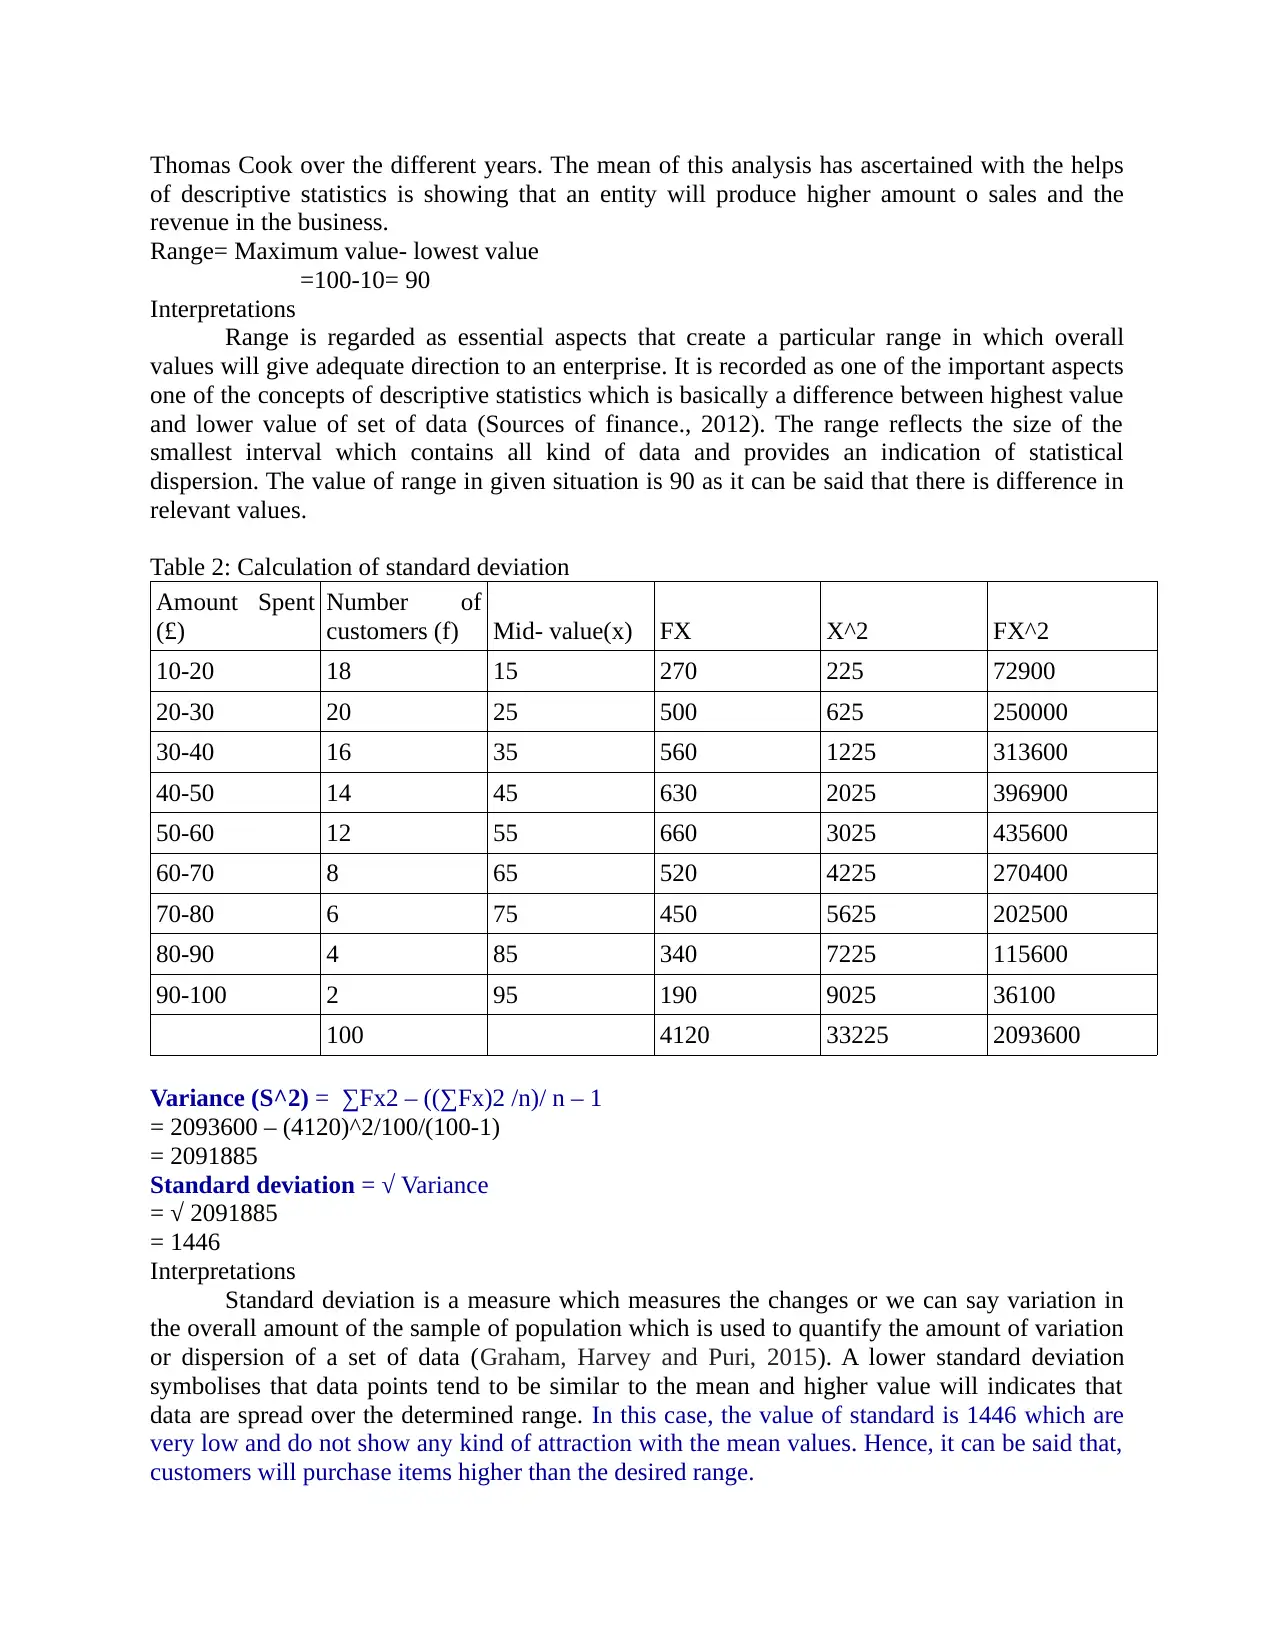
Thomas Cook over the different years. The mean of this analysis has ascertained with the helps
of descriptive statistics is showing that an entity will produce higher amount o sales and the
revenue in the business.
Range= Maximum value- lowest value
=100-10= 90
Interpretations
Range is regarded as essential aspects that create a particular range in which overall
values will give adequate direction to an enterprise. It is recorded as one of the important aspects
one of the concepts of descriptive statistics which is basically a difference between highest value
and lower value of set of data (Sources of finance., 2012). The range reflects the size of the
smallest interval which contains all kind of data and provides an indication of statistical
dispersion. The value of range in given situation is 90 as it can be said that there is difference in
relevant values.
Table 2: Calculation of standard deviation
Amount Spent
(£)
Number of
customers (f) Mid- value(x) FX X^2 FX^2
10-20 18 15 270 225 72900
20-30 20 25 500 625 250000
30-40 16 35 560 1225 313600
40-50 14 45 630 2025 396900
50-60 12 55 660 3025 435600
60-70 8 65 520 4225 270400
70-80 6 75 450 5625 202500
80-90 4 85 340 7225 115600
90-100 2 95 190 9025 36100
100 4120 33225 2093600
Variance (S^2) = ∑Fx2 – ((∑Fx)2 /n)/ n – 1
= 2093600 – (4120)^2/100/(100-1)
= 2091885
Standard deviation = √ Variance
= √ 2091885
= 1446
Interpretations
Standard deviation is a measure which measures the changes or we can say variation in
the overall amount of the sample of population which is used to quantify the amount of variation
or dispersion of a set of data (Graham, Harvey and Puri, 2015). A lower standard deviation
symbolises that data points tend to be similar to the mean and higher value will indicates that
data are spread over the determined range. In this case, the value of standard is 1446 which are
very low and do not show any kind of attraction with the mean values. Hence, it can be said that,
customers will purchase items higher than the desired range.
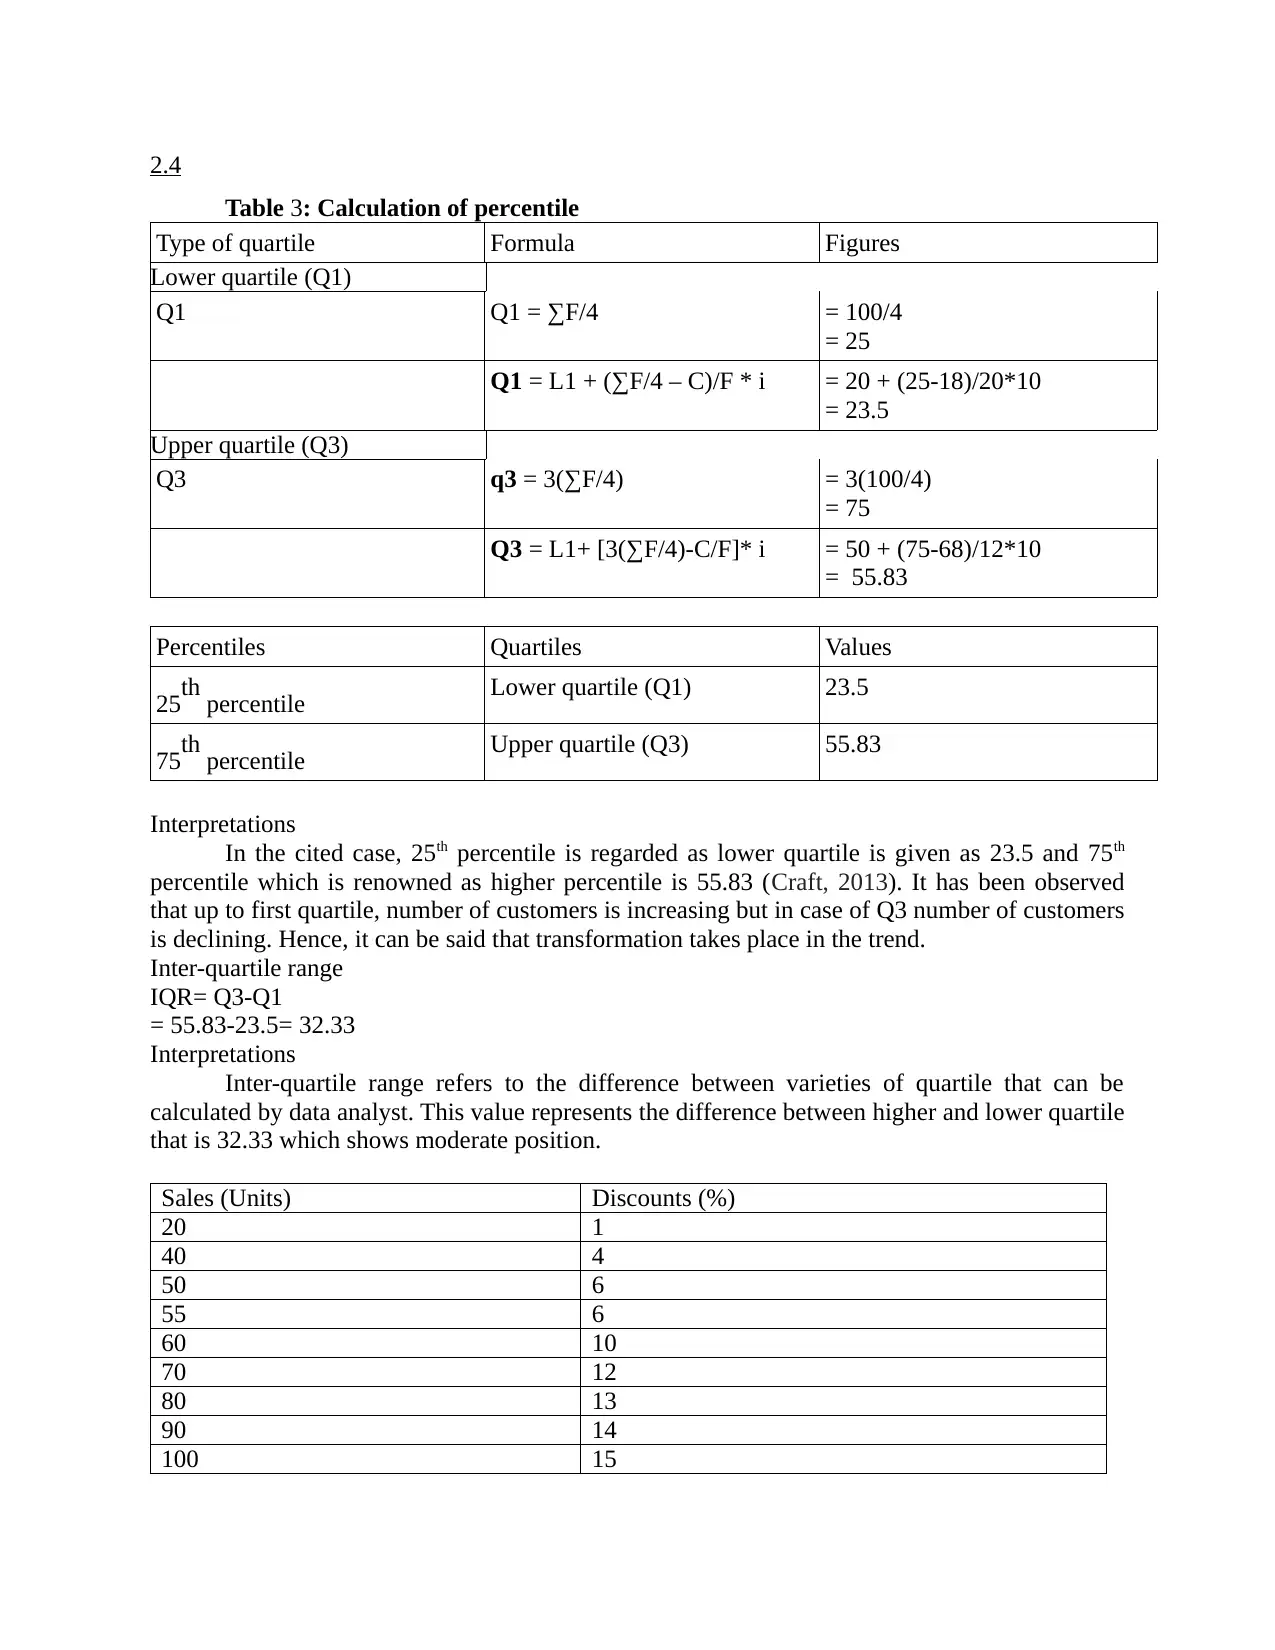
2.4
Table 3: Calculation of percentile
Type of quartile Formula Figures
Lower quartile (Q1)
Q1 Q1 = ∑F/4 = 100/4
= 25
Q1 = L1 + (∑F/4 – C)/F * i = 20 + (25-18)/20*10
= 23.5
Upper quartile (Q3)
Q3 q3 = 3(∑F/4) = 3(100/4)
= 75
Q3 = L1+ [3(∑F/4)-C/F]* i = 50 + (75-68)/12*10
= 55.83
Percentiles Quartiles Values
25th percentile Lower quartile (Q1) 23.5
75th percentile Upper quartile (Q3) 55.83
Interpretations
In the cited case, 25th percentile is regarded as lower quartile is given as 23.5 and 75th
percentile which is renowned as higher percentile is 55.83 (Craft, 2013). It has been observed
that up to first quartile, number of customers is increasing but in case of Q3 number of customers
is declining. Hence, it can be said that transformation takes place in the trend.
Inter-quartile range
IQR= Q3-Q1
= 55.83-23.5= 32.33
Interpretations
Inter-quartile range refers to the difference between varieties of quartile that can be
calculated by data analyst. This value represents the difference between higher and lower quartile
that is 32.33 which shows moderate position.
Sales (Units) Discounts (%)
20 1
40 4
50 6
55 6
60 10
70 12
80 13
90 14
100 15
⊘ This is a preview!⊘
Do you want full access?
Subscribe today to unlock all pages.
Trusted by 1+ million students worldwide
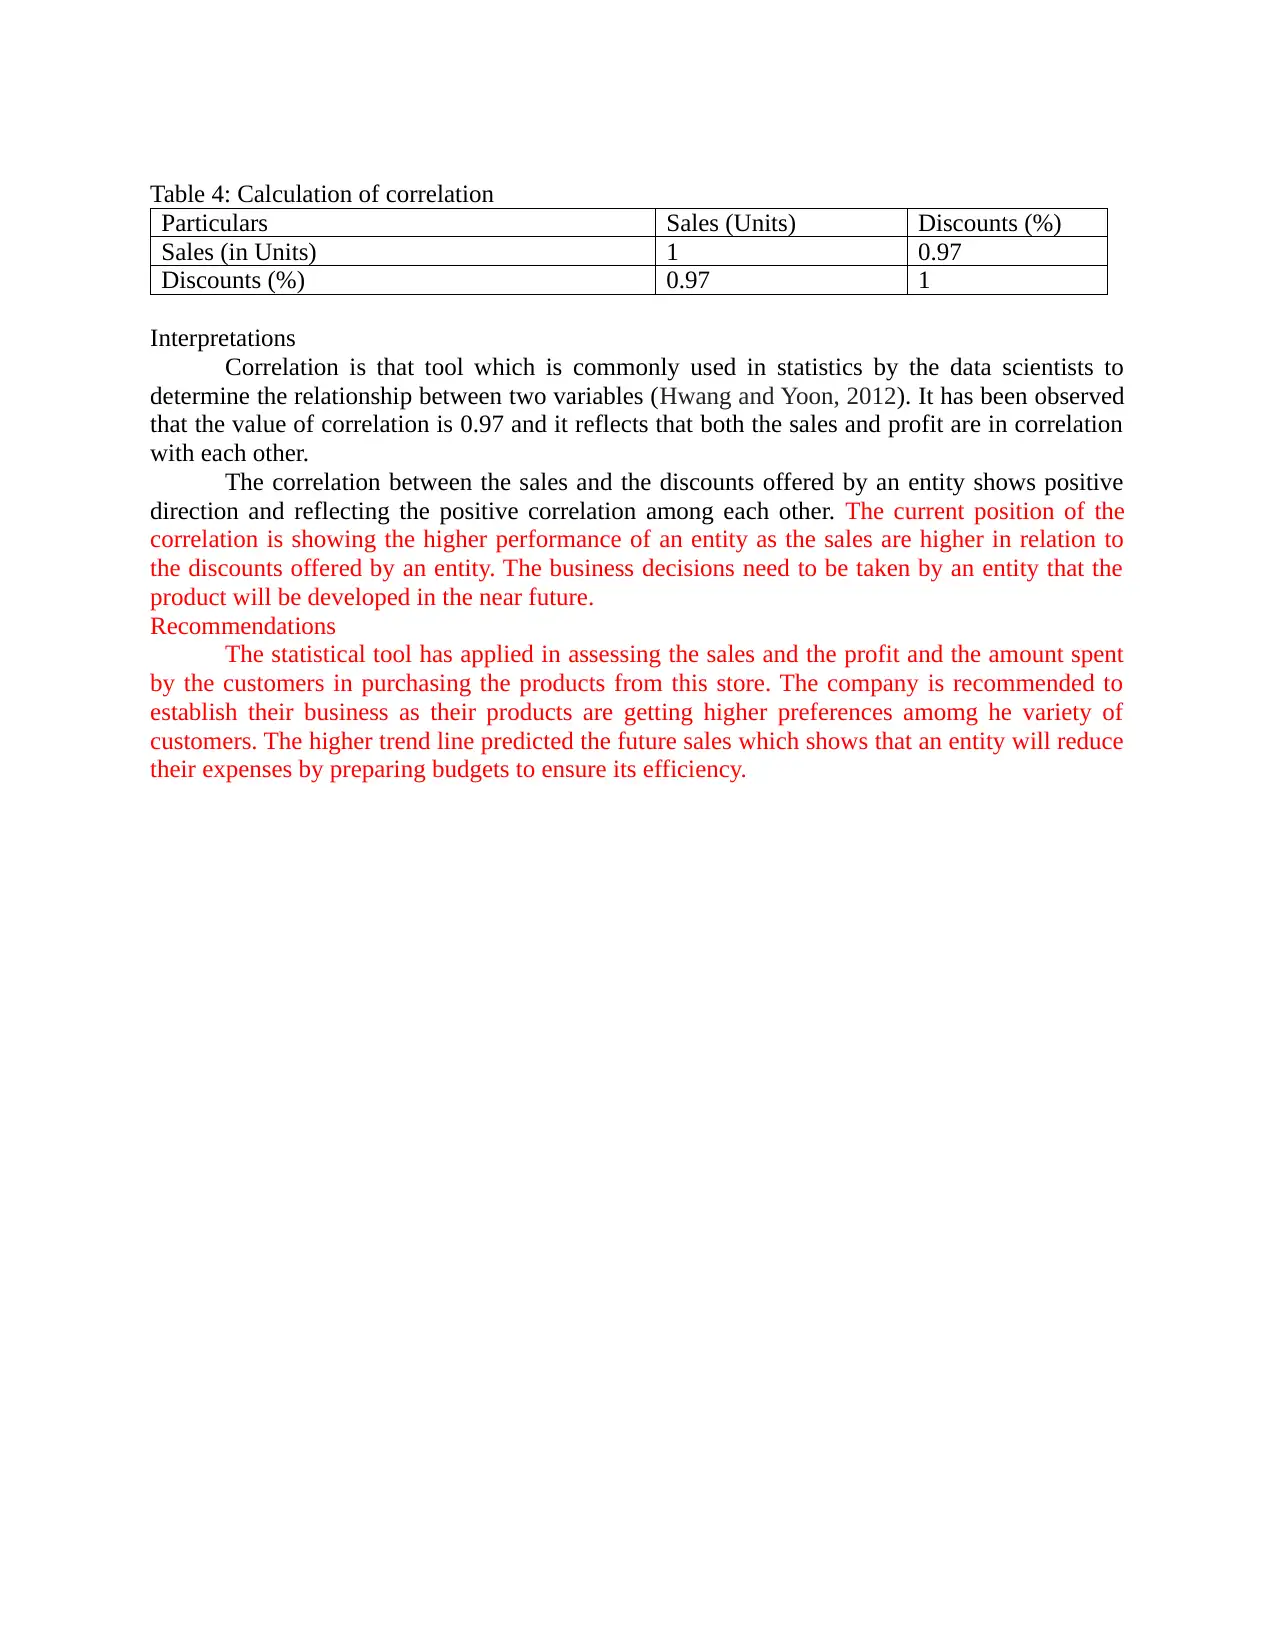
Table 4: Calculation of correlation
Particulars Sales (Units) Discounts (%)
Sales (in Units) 1 0.97
Discounts (%) 0.97 1
Interpretations
Correlation is that tool which is commonly used in statistics by the data scientists to
determine the relationship between two variables (Hwang and Yoon, 2012). It has been observed
that the value of correlation is 0.97 and it reflects that both the sales and profit are in correlation
with each other.
The correlation between the sales and the discounts offered by an entity shows positive
direction and reflecting the positive correlation among each other. The current position of the
correlation is showing the higher performance of an entity as the sales are higher in relation to
the discounts offered by an entity. The business decisions need to be taken by an entity that the
product will be developed in the near future.
Recommendations
The statistical tool has applied in assessing the sales and the profit and the amount spent
by the customers in purchasing the products from this store. The company is recommended to
establish their business as their products are getting higher preferences amomg he variety of
customers. The higher trend line predicted the future sales which shows that an entity will reduce
their expenses by preparing budgets to ensure its efficiency.
Paraphrase This Document
Need a fresh take? Get an instant paraphrase of this document with our AI Paraphraser
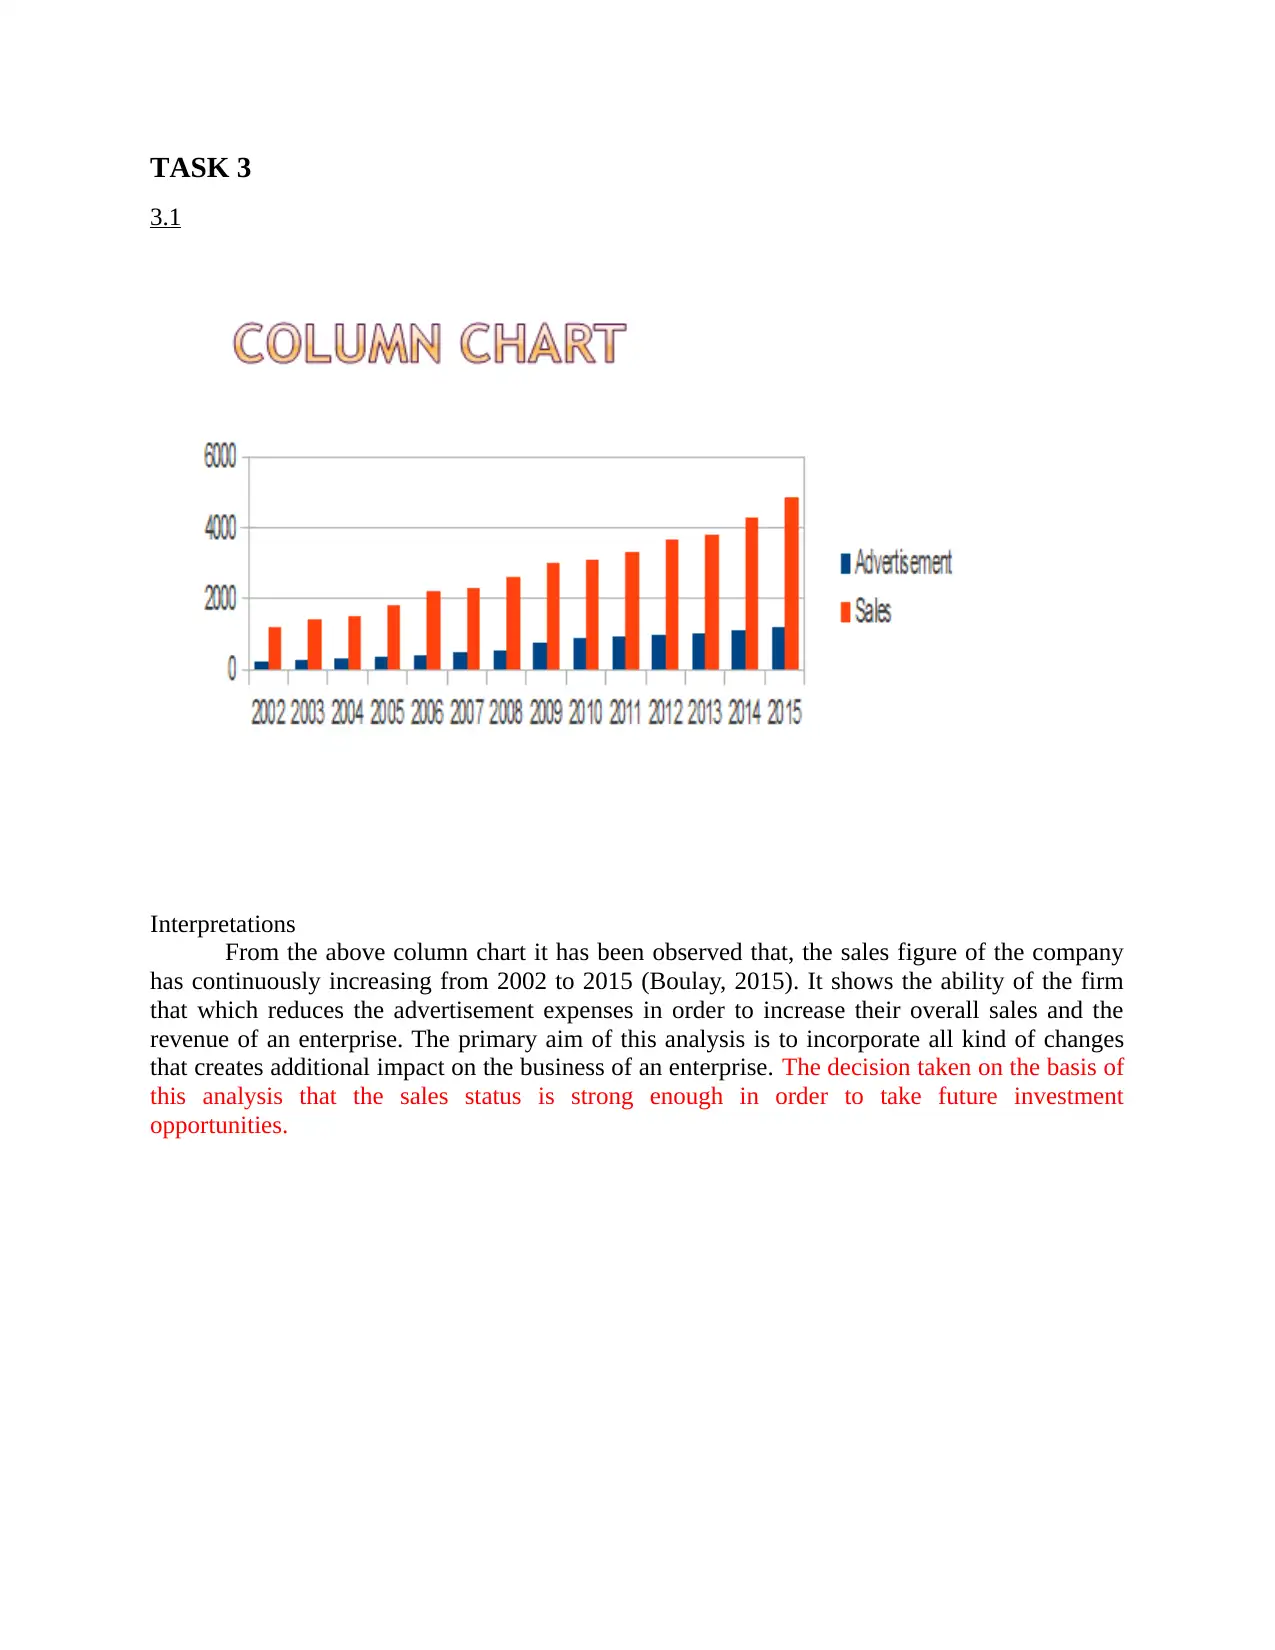
TASK 3
3.1
Interpretations
From the above column chart it has been observed that, the sales figure of the company
has continuously increasing from 2002 to 2015 (Boulay, 2015). It shows the ability of the firm
that which reduces the advertisement expenses in order to increase their overall sales and the
revenue of an enterprise. The primary aim of this analysis is to incorporate all kind of changes
that creates additional impact on the business of an enterprise. The decision taken on the basis of
this analysis that the sales status is strong enough in order to take future investment
opportunities.
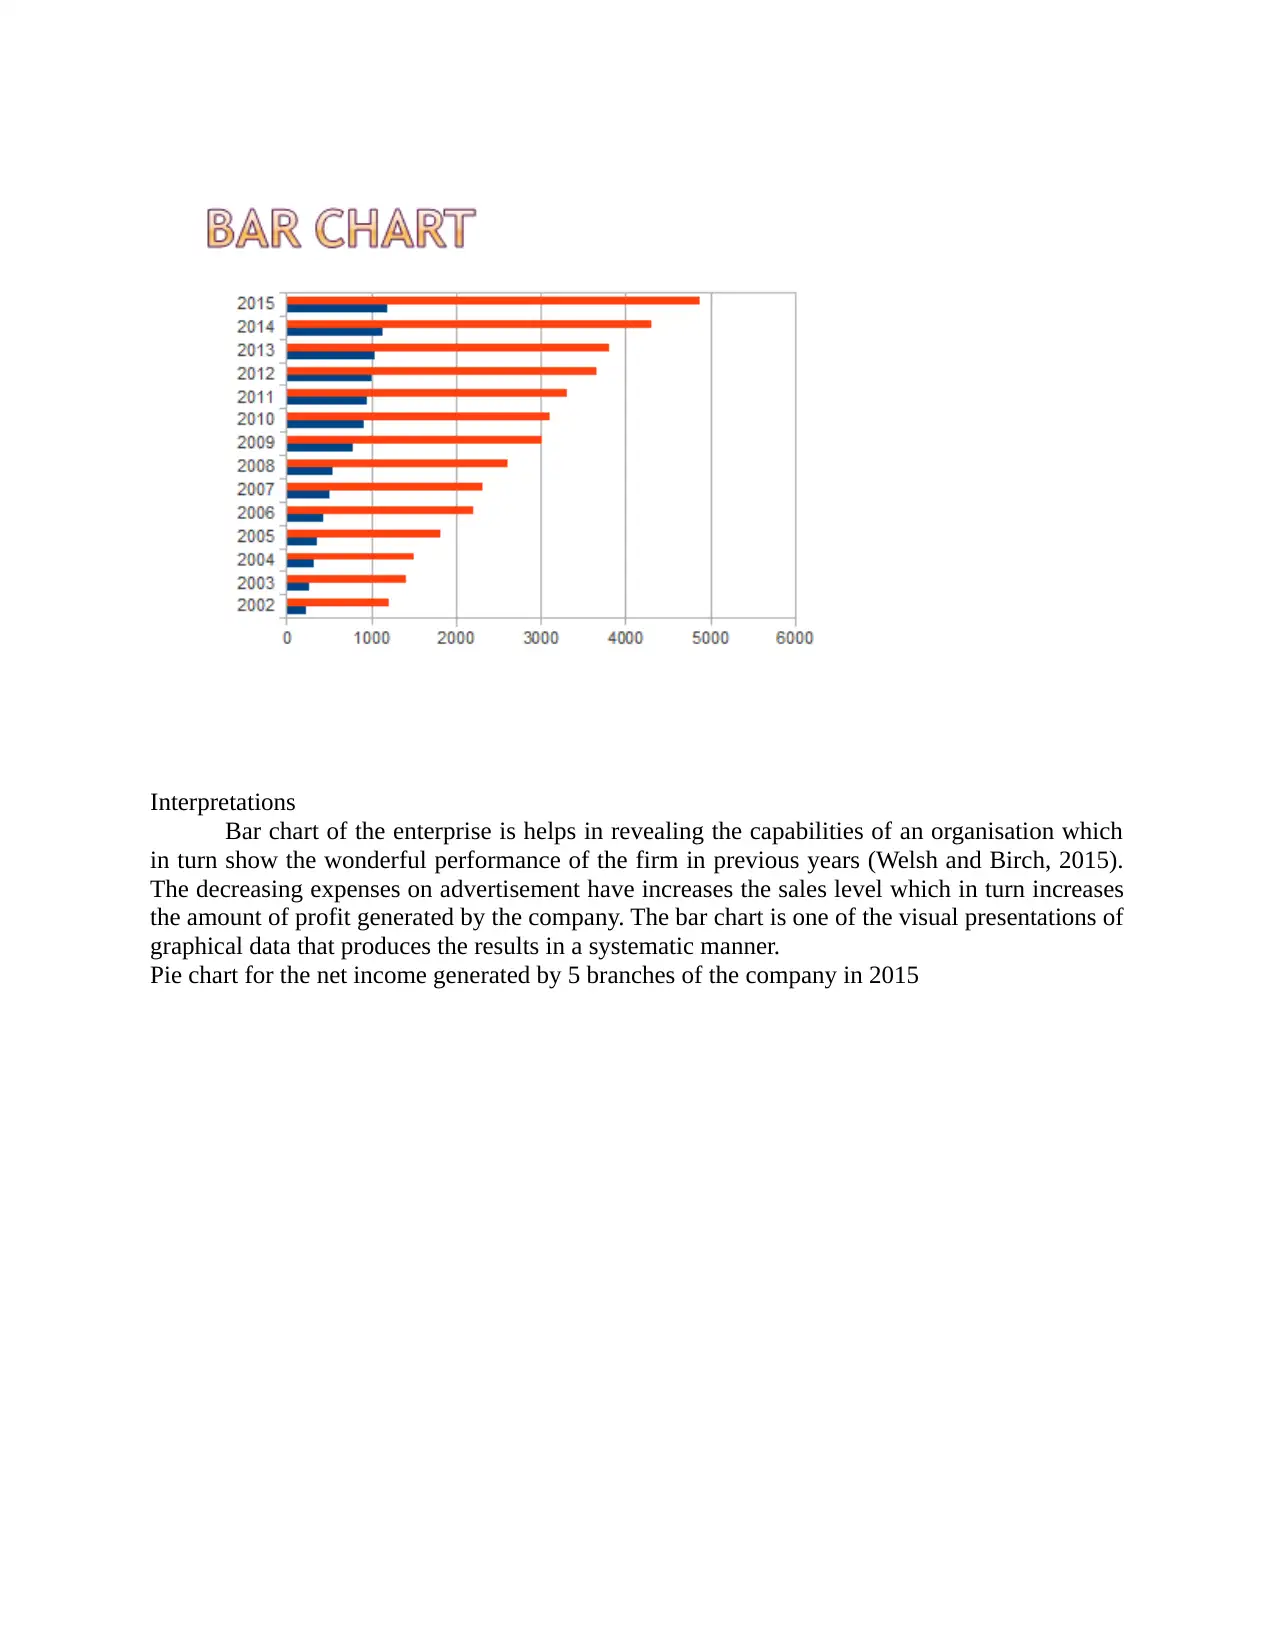
Interpretations
Bar chart of the enterprise is helps in revealing the capabilities of an organisation which
in turn show the wonderful performance of the firm in previous years (Welsh and Birch, 2015).
The decreasing expenses on advertisement have increases the sales level which in turn increases
the amount of profit generated by the company. The bar chart is one of the visual presentations of
graphical data that produces the results in a systematic manner.
Pie chart for the net income generated by 5 branches of the company in 2015
⊘ This is a preview!⊘
Do you want full access?
Subscribe today to unlock all pages.
Trusted by 1+ million students worldwide
1 out of 26
Related Documents


Your All-in-One AI-Powered Toolkit for Academic Success.
+13062052269
info@desklib.com
Available 24*7 on WhatsApp / Email
![[object Object]](/_next/static/media/star-bottom.7253800d.svg)
Unlock your academic potential
Copyright © 2020–2026 A2Z Services. All Rights Reserved. Developed and managed by ZUCOL.