Business Decision Making: Data Analysis and Report for Tour Packages
VerifiedAdded on 2020/02/03
|19
|3458
|34
Report
AI Summary
This report details a business decision-making process for a tour operator launching new tour packages. It outlines a data collection plan, differentiating between primary and secondary sources, and presents a survey methodology using questionnaires with both open-ended and closed-ended questions. Statistical measures like mean, median, mode, interquartile range, and standard deviation are applied to analyze collected data. The report visualizes the business information using pie charts, bar charts, and line charts to predict future performance. The analysis focuses on customer preferences for various destinations like Morocco, Turkey, Cuba, and Dubai. The report aims to provide insights into customer satisfaction levels and preferences for tour packages, aiding in informed business decisions.

BUSINESS DECISION
MAKING
1
MAKING
1
Paraphrase This Document
Need a fresh take? Get an instant paraphrase of this document with our AI Paraphraser
2
INTRODUCTION
Decisions are imporrant aspects involved in an entity in which business actions are taken by
an individual for the sake of their entity. Tour operator has been selected by an entity who intends to
launch its new products in form of new tour packages in front of all the customers located in the
external business environment. The owner has evaluated four destinations as one of the prospective
tour packages developed by an entity in order to satisfy all the needs and the expectations of variety
of customers. This project report is all about creating data collection plan in order to collect facts
and information in order to support the overall aim of the research report. This report also stressed
on applying various statistical measures in order to test the overall accuracy of the data. This report
highlights that this report visualises the business information using bar charts, line charts, pie charts
and creation of trend line in order to predict the future performance of an enterprise after analysing
present resources kept in an entity for long time period. Different information processing tools are
used by an entity in order to convey important information about the business to all the external
market users. Project management tools are used to determine the total time required by an entity in
order to facilitate its variety of users. Financial tools are used by an entity owner in order to assess
the financial performance of an entity in order to grab higher market performance.
TASK 1
1.1 Identify sources of primary and secondary sources of data
Primary collection- Primary research is conducted by an entity in which personnel is specially
appointed in order to conduct a research to benefit its variety of users. In this kind of research study,
data is collected from its original source in order to provide ultimate advantage to its variety of
visitors which helps in designing customised tour packages to retain all the customers towards the
business of an entity. This particular research includes circulating questionnaires in order to taken
the consent of all the customers. Questionnaires will include both open end and closed end
questions included in the questionnaires in order to take the consent of all individuals in the external
market.
Secondary collection- This is another most important technique of data collection which is external
source of collection of facts and figures for supporting the desired aim of overall research study.
This kind of external data collection technique will help in knowing about the external market
trends about the travel and hospitality industry in order to consider all features and attributes. In this
particular source, data about customer’s income, tastes and preferences are determined by an
individual in order to generate higher business outcomes in the near future for securing the business
of an enterprise.
1.2 Present survey methodology
Research methodologies used by an entity will give right direction to the business as it
clarifies the path of an entity in collecting all important evidences in completing the overall research
report by identifying hidden areas of the research study (Baum and Crosby, 2014). The desired aim
of the business will get fulfilled in order to accomplish all the goals and the objectives within a
3
⊘ This is a preview!⊘
Do you want full access?
Subscribe today to unlock all pages.
Trusted by 1+ million students worldwide
given time span. The research study conducted by an individual is to provide all solutions to the
research problem as every research is based on some problem or issue currently faced by a society
as without problem there is no existence of research study.
Cluster sampling technique used by an entity owner in order to select various facts and
figures by classifying all the data into various categories in facilitating an enterprise owner in order
to utilise all the information for the beneficial for the business in accomplishing all the goal and the
objectives develop by an entity owner. The total sample size for this particular research study is 90
customers for which all members of the society, businesses, local residents and students are
approached by an entity in order to seek their consent about the designing of various tour packages
for the beneficial of an enterprise.
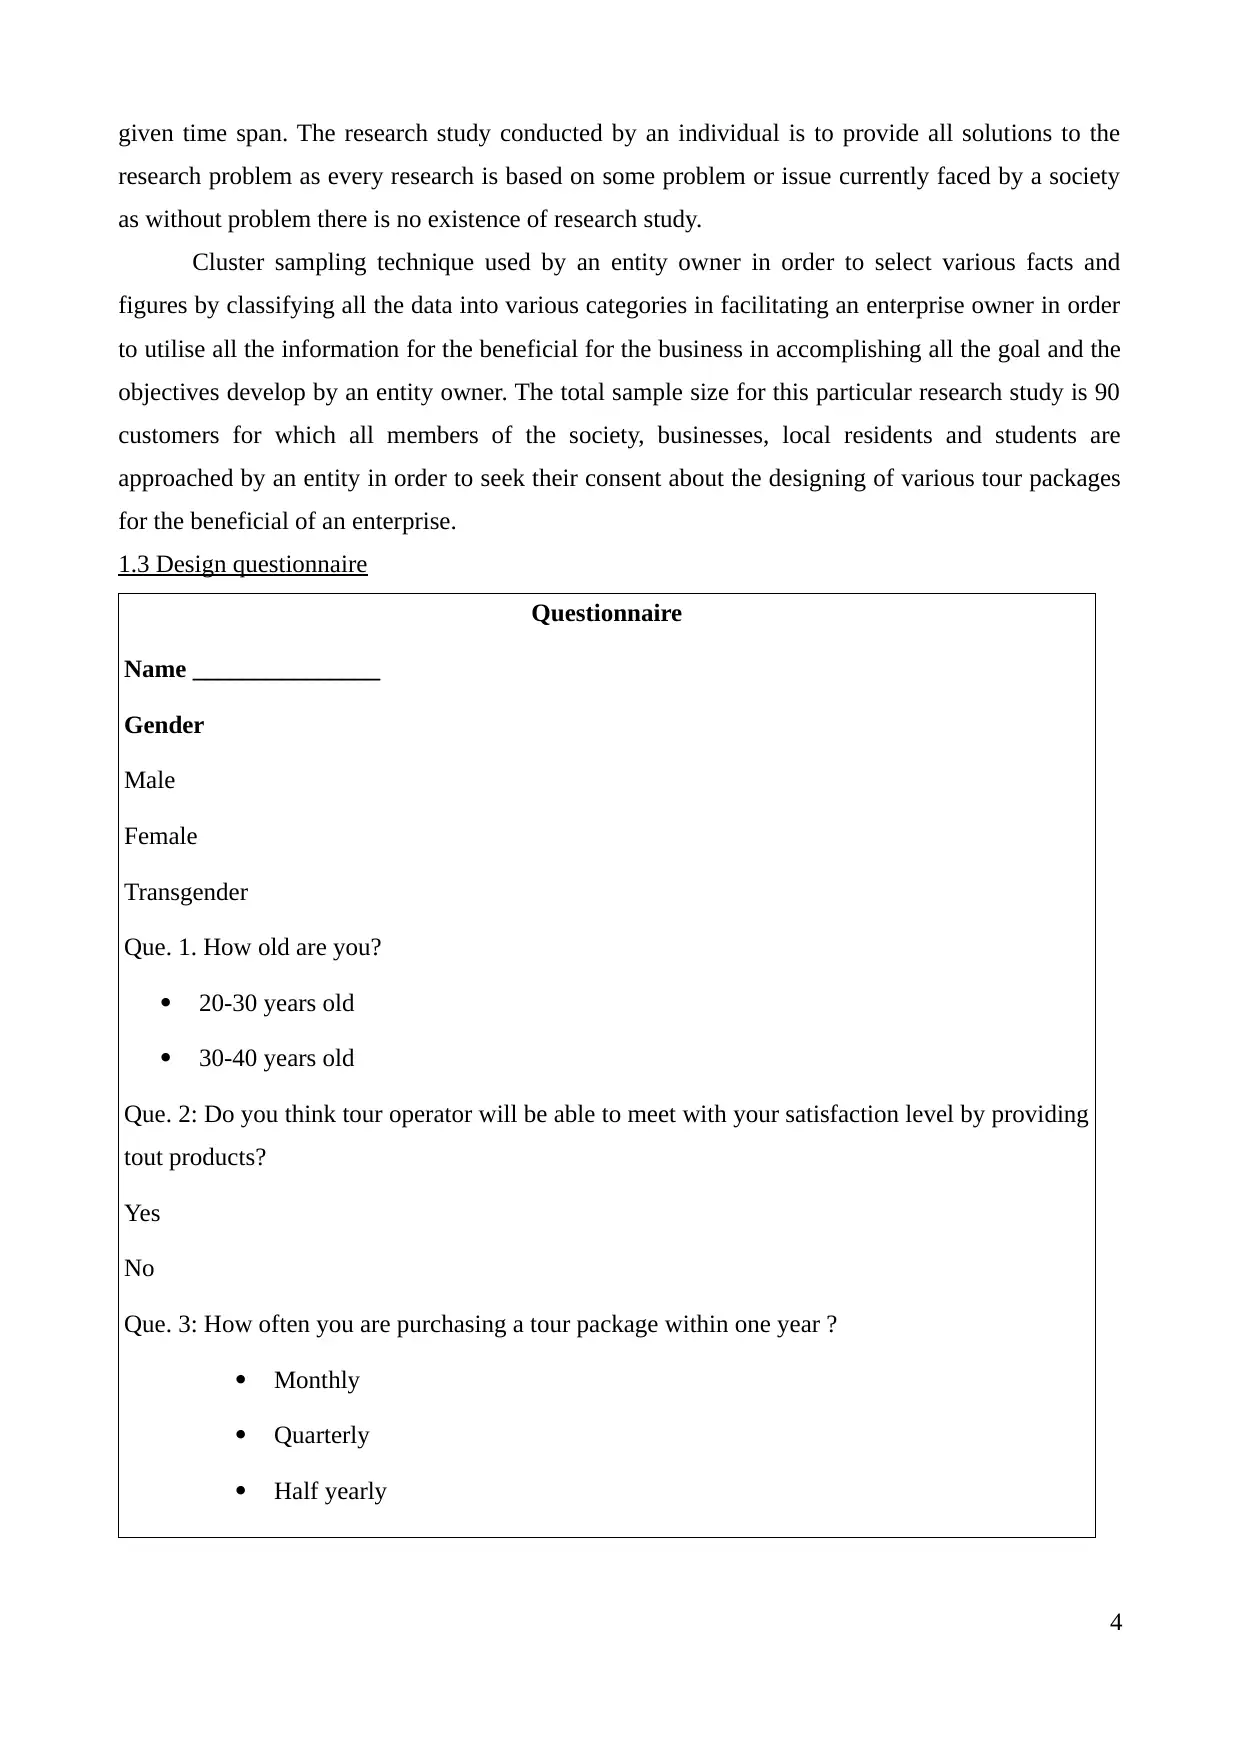
1.3 Design questionnaire
Questionnaire
Name _______________
Gender
Male
Female
Transgender
Que. 1. How old are you?
20-30 years old
30-40 years old
Que. 2: Do you think tour operator will be able to meet with your satisfaction level by providing
tout products?
Yes
No
Que. 3: How often you are purchasing a tour package within one year ?
Monthly
Quarterly
Half yearly
4
research problem as every research is based on some problem or issue currently faced by a society
as without problem there is no existence of research study.
Cluster sampling technique used by an entity owner in order to select various facts and
figures by classifying all the data into various categories in facilitating an enterprise owner in order
to utilise all the information for the beneficial for the business in accomplishing all the goal and the
objectives develop by an entity owner. The total sample size for this particular research study is 90
customers for which all members of the society, businesses, local residents and students are
approached by an entity in order to seek their consent about the designing of various tour packages
for the beneficial of an enterprise.
1.3 Design questionnaire
Questionnaire
Name _______________
Gender
Male
Female
Transgender
Que. 1. How old are you?
20-30 years old
30-40 years old
Que. 2: Do you think tour operator will be able to meet with your satisfaction level by providing
tout products?
Yes
No
Que. 3: How often you are purchasing a tour package within one year ?
Monthly
Quarterly
Half yearly
4
Paraphrase This Document
Need a fresh take? Get an instant paraphrase of this document with our AI Paraphraser
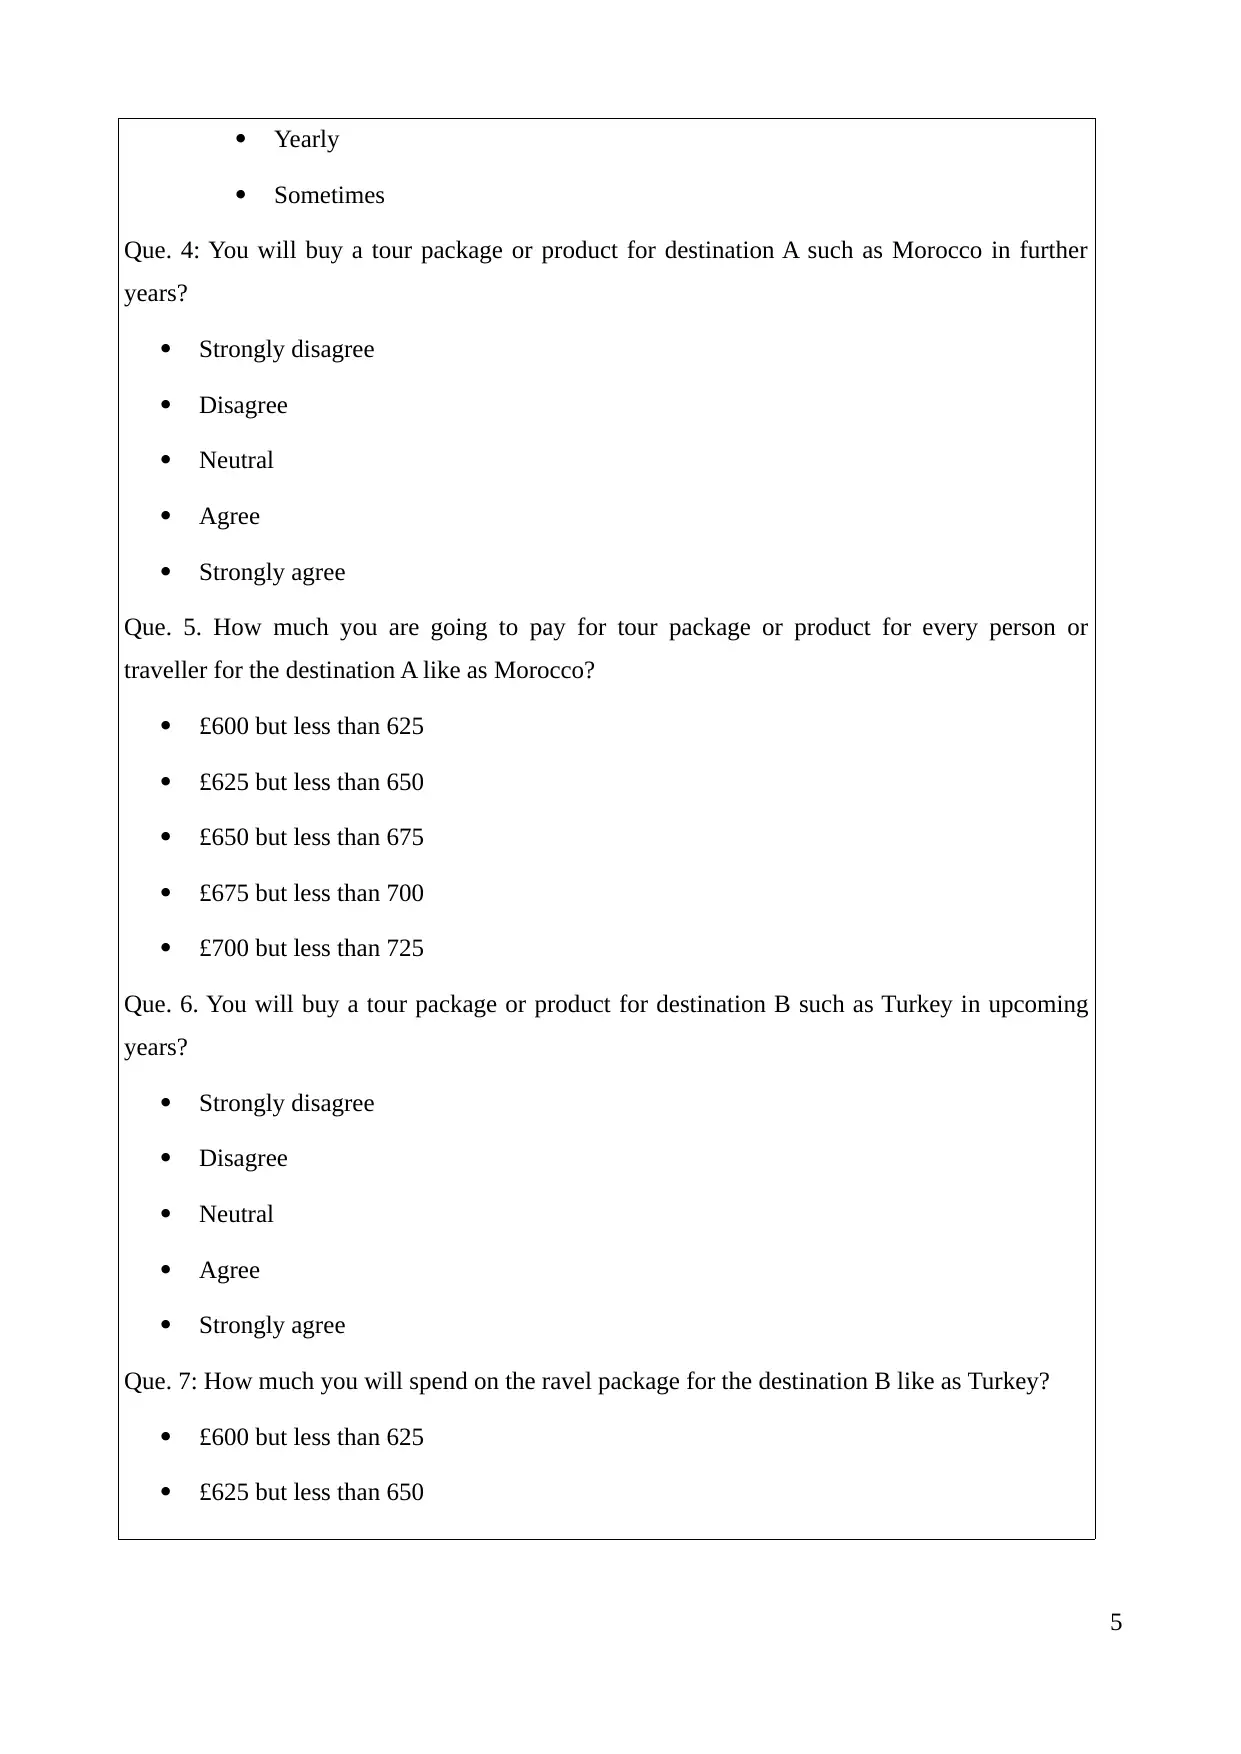
Yearly
Sometimes
Que. 4: You will buy a tour package or product for destination A such as Morocco in further
years?
Strongly disagree
Disagree
Neutral
Agree
Strongly agree
Que. 5. How much you are going to pay for tour package or product for every person or
traveller for the destination A like as Morocco?
£600 but less than 625
£625 but less than 650
£650 but less than 675
£675 but less than 700
£700 but less than 725
Que. 6. You will buy a tour package or product for destination B such as Turkey in upcoming
years?
Strongly disagree
Disagree
Neutral
Agree
Strongly agree
Que. 7: How much you will spend on the ravel package for the destination B like as Turkey?
£600 but less than 625
£625 but less than 650
5
£650 but less than 675
£675 but less than 700
£700 but less than 725
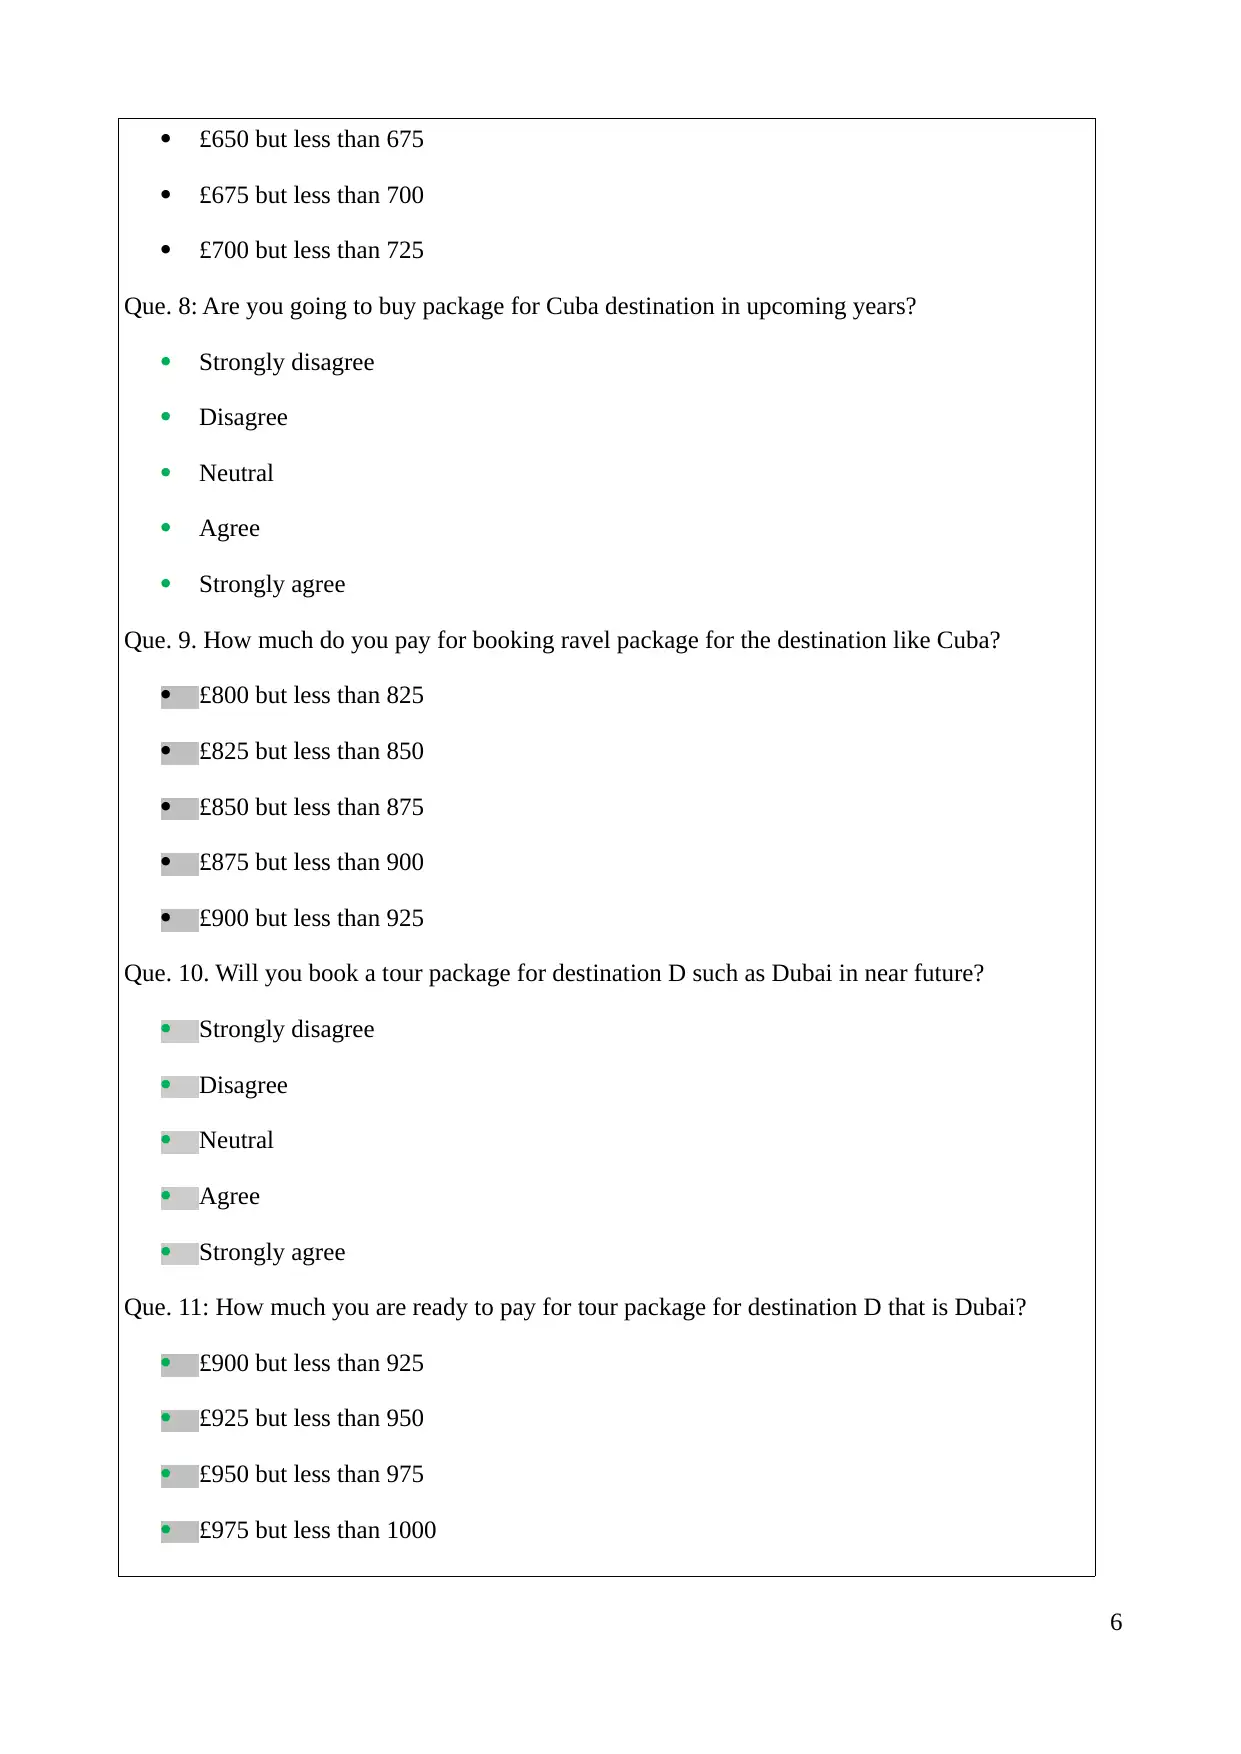
Que. 8: Are you going to buy package for Cuba destination in upcoming years?
Strongly disagree
Disagree
Neutral
Agree
Strongly agree
Que. 9. How much do you pay for booking ravel package for the destination like Cuba?
£800 but less than 825
£825 but less than 850
£850 but less than 875
£875 but less than 900
£900 but less than 925
Que. 10. Will you book a tour package for destination D such as Dubai in near future?
Strongly disagree
Disagree
Neutral
Agree
Strongly agree
Que. 11: How much you are ready to pay for tour package for destination D that is Dubai?
£900 but less than 925
£925 but less than 950
£950 but less than 975
£975 but less than 1000
6
£675 but less than 700
£700 but less than 725
Que. 8: Are you going to buy package for Cuba destination in upcoming years?
Strongly disagree
Disagree
Neutral
Agree
Strongly agree
Que. 9. How much do you pay for booking ravel package for the destination like Cuba?
£800 but less than 825
£825 but less than 850
£850 but less than 875
£875 but less than 900
£900 but less than 925
Que. 10. Will you book a tour package for destination D such as Dubai in near future?
Strongly disagree
Disagree
Neutral
Agree
Strongly agree
Que. 11: How much you are ready to pay for tour package for destination D that is Dubai?
£900 but less than 925
£925 but less than 950
£950 but less than 975
£975 but less than 1000
6
⊘ This is a preview!⊘
Do you want full access?
Subscribe today to unlock all pages.
Trusted by 1+ million students worldwide
TASK 2
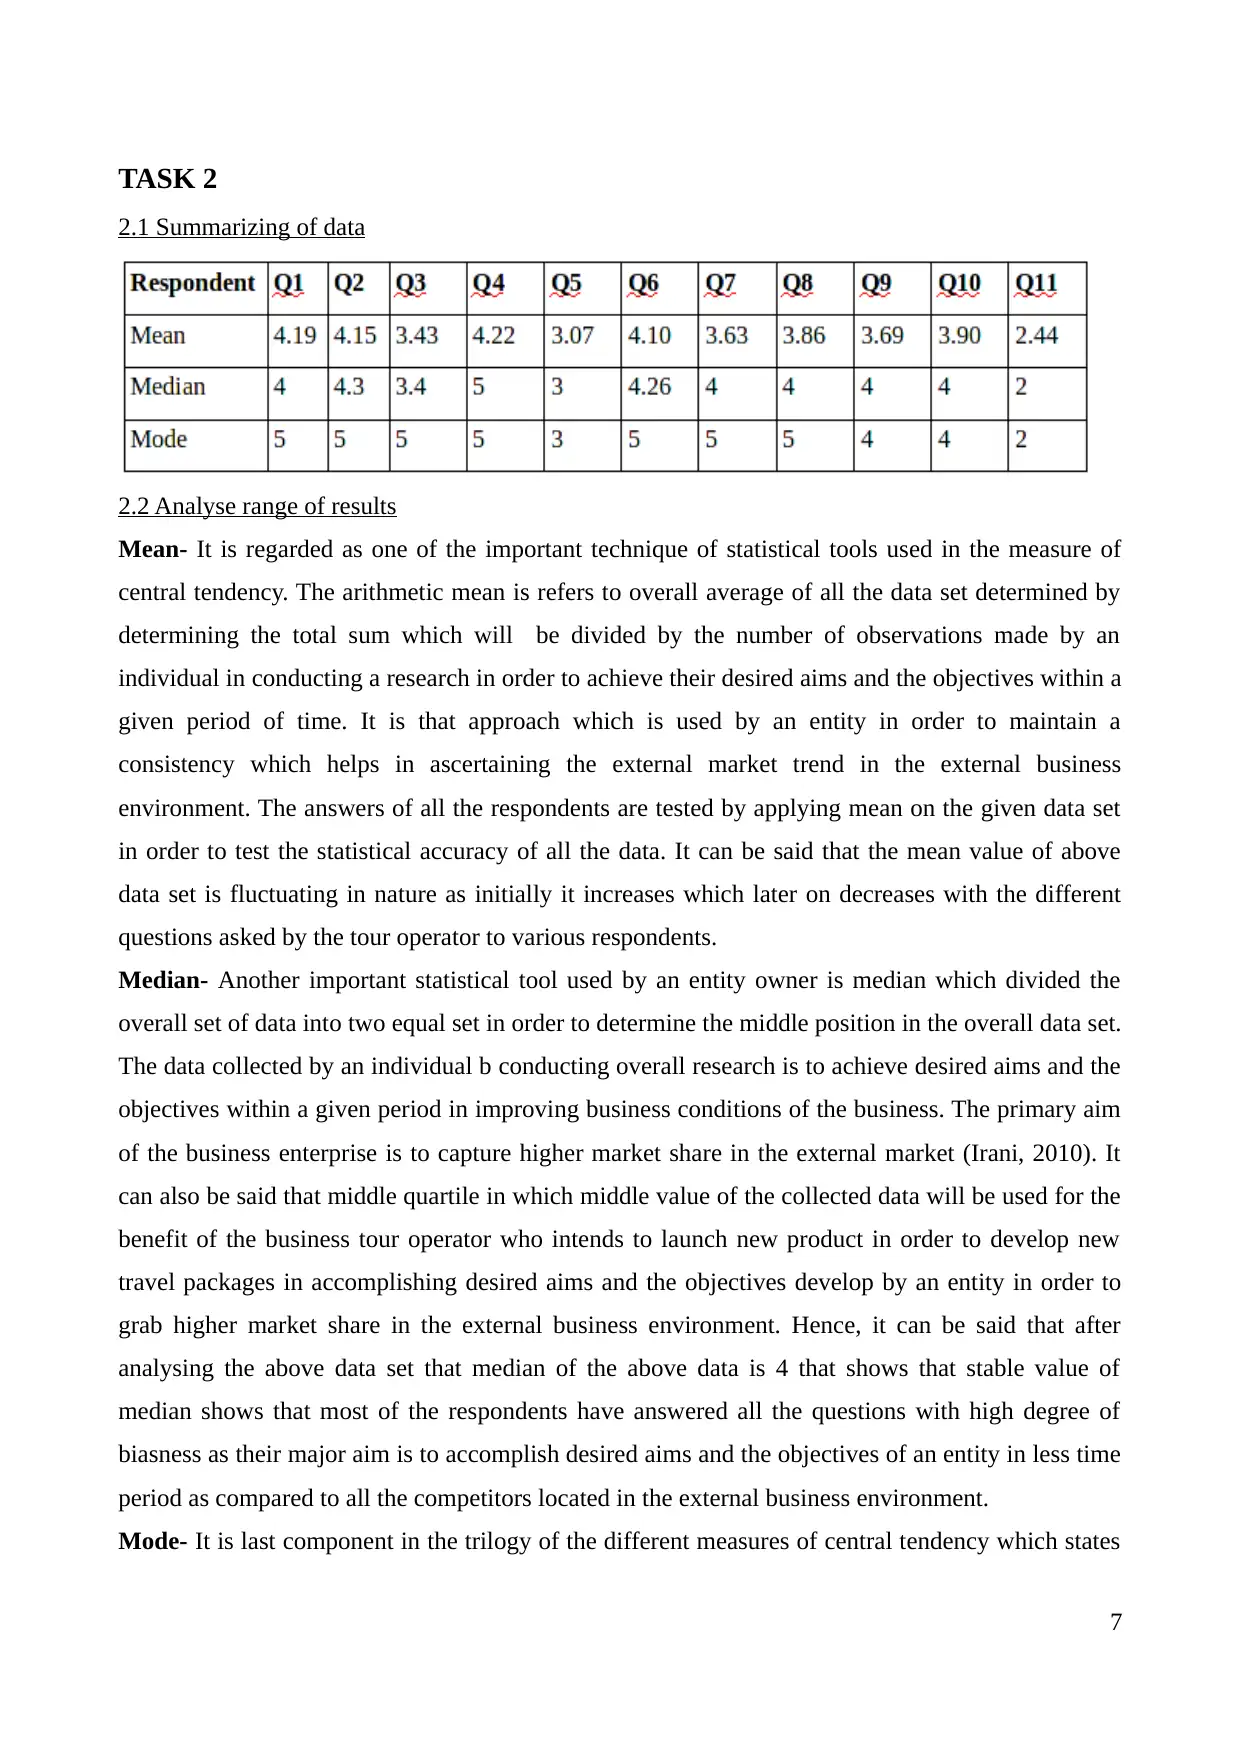
2.1 Summarizing of data
2.2 Analyse range of results
Mean- It is regarded as one of the important technique of statistical tools used in the measure of
central tendency. The arithmetic mean is refers to overall average of all the data set determined by
determining the total sum which will be divided by the number of observations made by an
individual in conducting a research in order to achieve their desired aims and the objectives within a
given period of time. It is that approach which is used by an entity in order to maintain a
consistency which helps in ascertaining the external market trend in the external business
environment. The answers of all the respondents are tested by applying mean on the given data set
in order to test the statistical accuracy of all the data. It can be said that the mean value of above
data set is fluctuating in nature as initially it increases which later on decreases with the different
questions asked by the tour operator to various respondents.
Median- Another important statistical tool used by an entity owner is median which divided the
overall set of data into two equal set in order to determine the middle position in the overall data set.
The data collected by an individual b conducting overall research is to achieve desired aims and the
objectives within a given period in improving business conditions of the business. The primary aim
of the business enterprise is to capture higher market share in the external market (Irani, 2010). It
can also be said that middle quartile in which middle value of the collected data will be used for the
benefit of the business tour operator who intends to launch new product in order to develop new
travel packages in accomplishing desired aims and the objectives develop by an entity in order to
grab higher market share in the external business environment. Hence, it can be said that after
analysing the above data set that median of the above data is 4 that shows that stable value of
median shows that most of the respondents have answered all the questions with high degree of
biasness as their major aim is to accomplish desired aims and the objectives of an entity in less time
period as compared to all the competitors located in the external business environment.
Mode- It is last component in the trilogy of the different measures of central tendency which states
7
Paraphrase This Document
Need a fresh take? Get an instant paraphrase of this document with our AI Paraphraser
that an entity which shows the repetitive values occurred in the overall data set as their major aim os
to show the consistency in the given data set. This particular approach reflects the frequently
occurred values in the overall data set as this helps an entity owner. This will help tour operator in
order to design all the tour packages in order to satisfy variety of users of the business by retaining
all of them with an entity for long period.
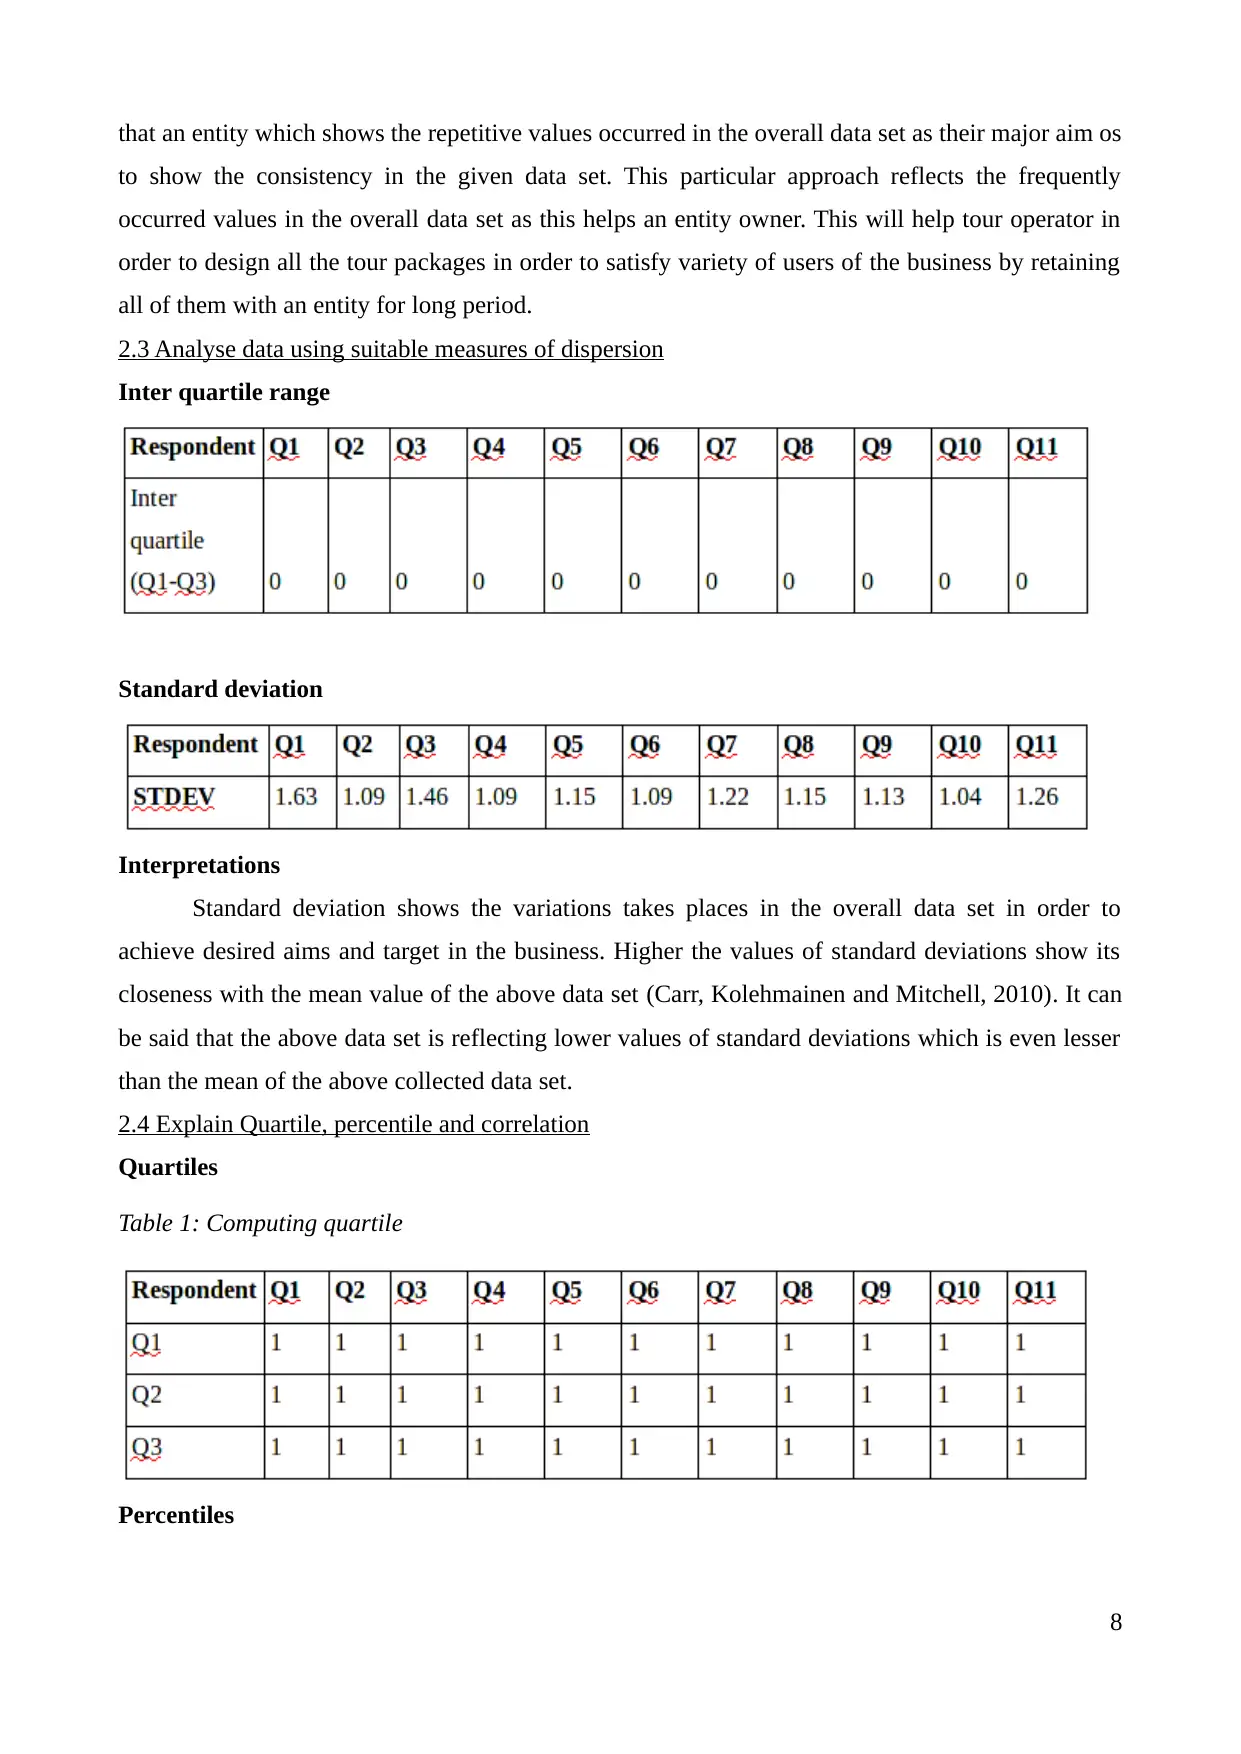
2.3 Analyse data using suitable measures of dispersion
Inter quartile range
Standard deviation
Interpretations
Standard deviation shows the variations takes places in the overall data set in order to
achieve desired aims and target in the business. Higher the values of standard deviations show its
closeness with the mean value of the above data set (Carr, Kolehmainen and Mitchell, 2010). It can
be said that the above data set is reflecting lower values of standard deviations which is even lesser
than the mean of the above collected data set.
2.4 Explain Quartile, percentile and correlation
Quartiles
Table 1: Computing quartile
Percentiles
8
to show the consistency in the given data set. This particular approach reflects the frequently
occurred values in the overall data set as this helps an entity owner. This will help tour operator in
order to design all the tour packages in order to satisfy variety of users of the business by retaining
all of them with an entity for long period.
2.3 Analyse data using suitable measures of dispersion
Inter quartile range
Standard deviation
Interpretations
Standard deviation shows the variations takes places in the overall data set in order to
achieve desired aims and target in the business. Higher the values of standard deviations show its
closeness with the mean value of the above data set (Carr, Kolehmainen and Mitchell, 2010). It can
be said that the above data set is reflecting lower values of standard deviations which is even lesser
than the mean of the above collected data set.
2.4 Explain Quartile, percentile and correlation
Quartiles
Table 1: Computing quartile
Percentiles
8
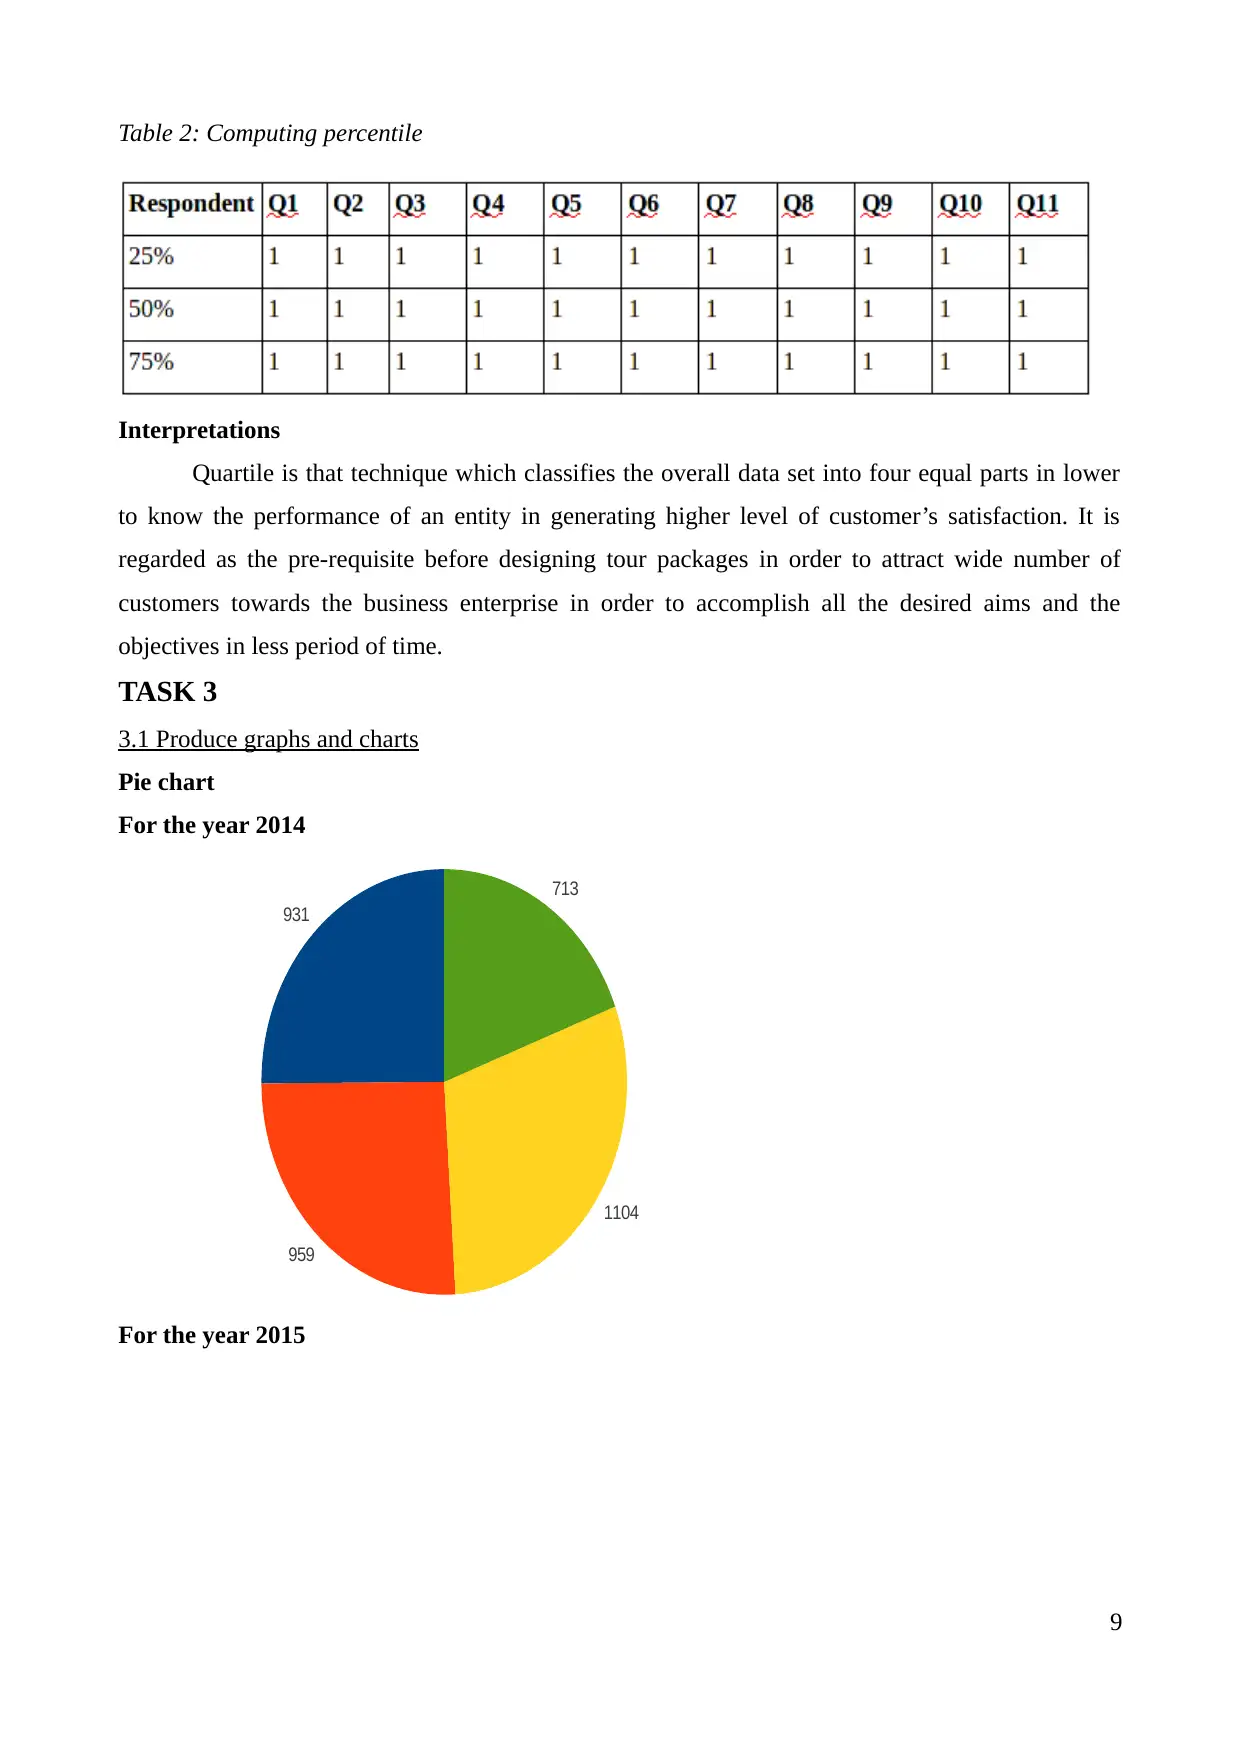
Table 2: Computing percentile
Interpretations
Quartile is that technique which classifies the overall data set into four equal parts in lower
to know the performance of an entity in generating higher level of customer’s satisfaction. It is
regarded as the pre-requisite before designing tour packages in order to attract wide number of
customers towards the business enterprise in order to accomplish all the desired aims and the
objectives in less period of time.
TASK 3
3.1 Produce graphs and charts
Pie chart
For the year 2014
931
959
1104
713
For the year 2015
9
⊘ This is a preview!⊘
Do you want full access?
Subscribe today to unlock all pages.
Trusted by 1+ million students worldwide
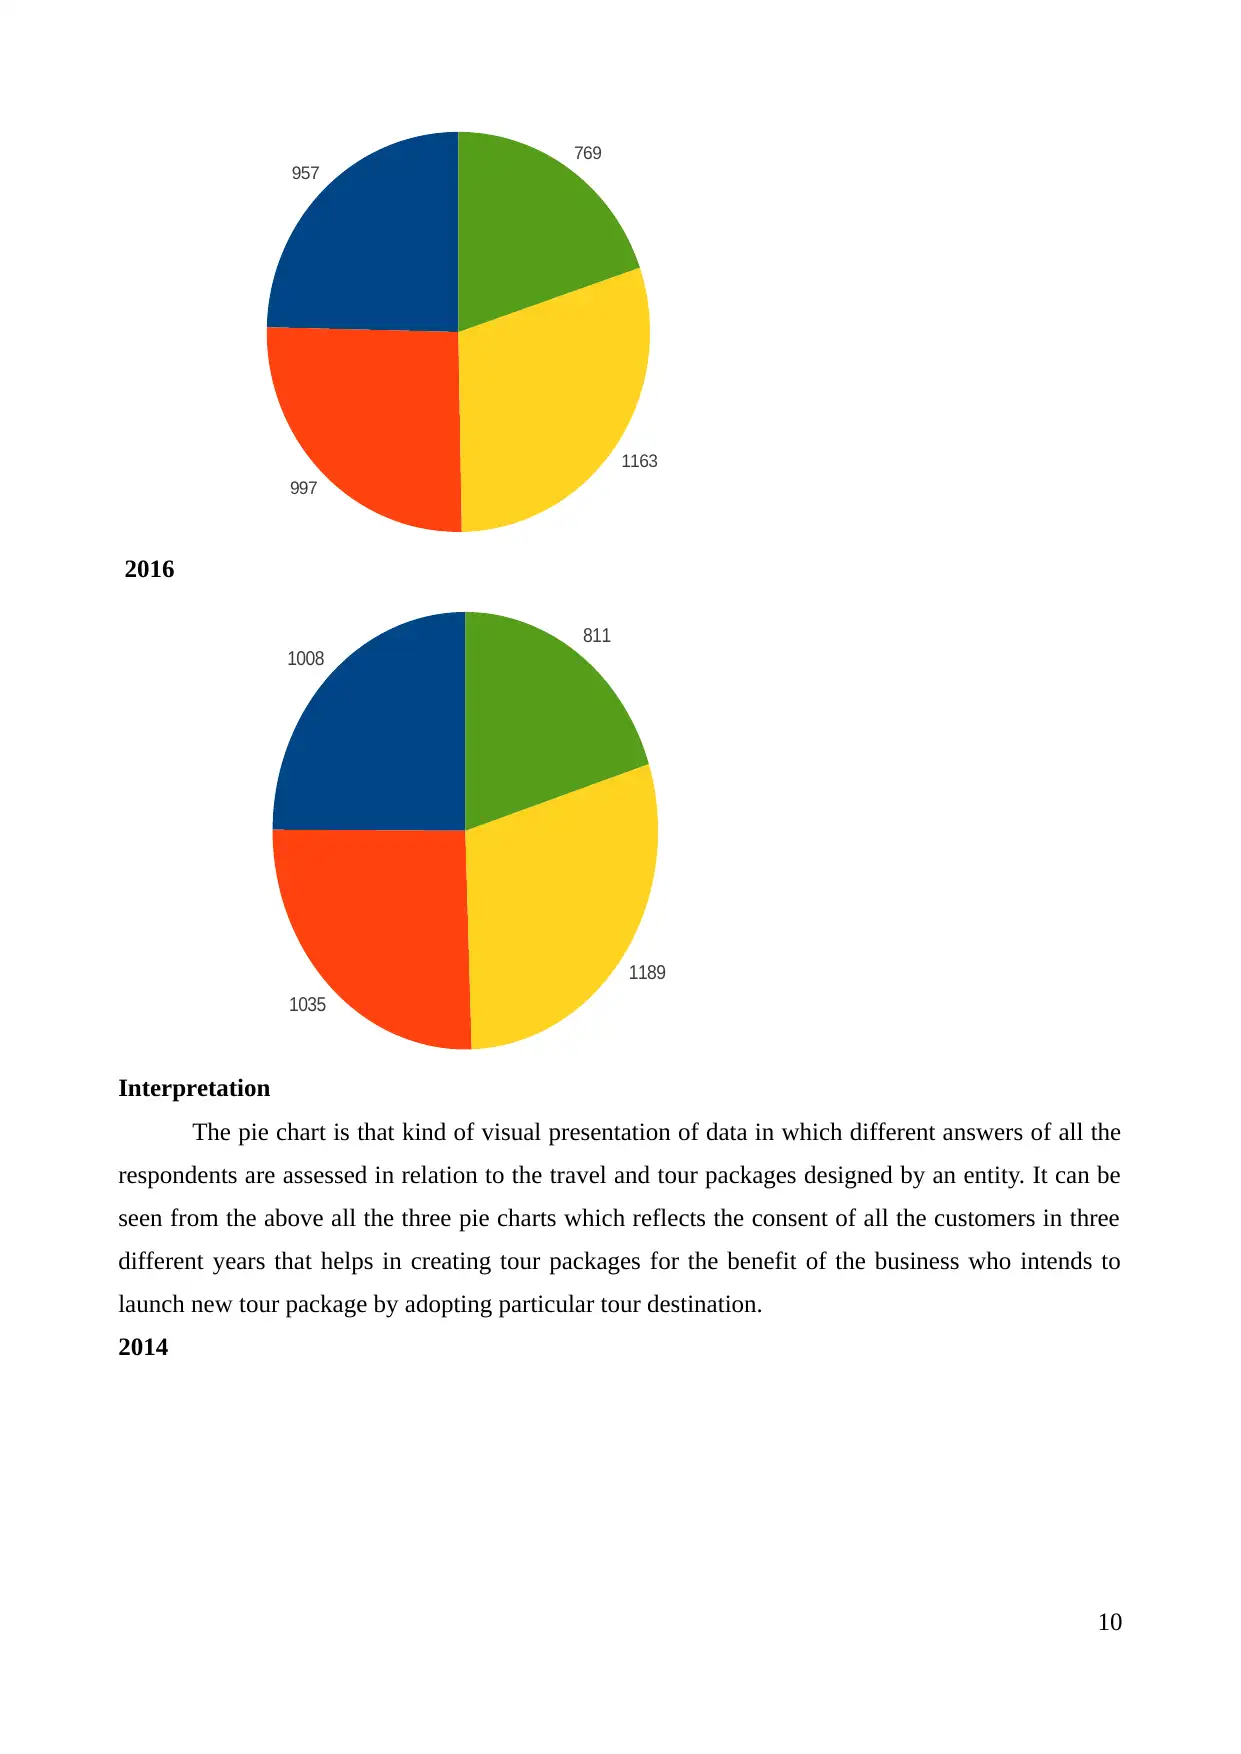
957
997
1163
769
2016
1008
1035
1189
811
Interpretation
The pie chart is that kind of visual presentation of data in which different answers of all the
respondents are assessed in relation to the travel and tour packages designed by an entity. It can be
seen from the above all the three pie charts which reflects the consent of all the customers in three
different years that helps in creating tour packages for the benefit of the business who intends to
launch new tour package by adopting particular tour destination.
2014
10
Paraphrase This Document
Need a fresh take? Get an instant paraphrase of this document with our AI Paraphraser
Q1
Q2
Q3
Q4
0 200 400 600 800 1000 1200
931
959
1104
713
2015
Q1
Q2
Q3
Q4
0 200 400 600 800 1000 1200 1400
957
997
1163
769
2016
Q1
Q2
Q3
Q4
0 200 400 600 800 1000 1200 1400
1008
1035
1189
811
11
Q2
Q3
Q4
0 200 400 600 800 1000 1200
931
959
1104
713
2015
Q1
Q2
Q3
Q4
0 200 400 600 800 1000 1200 1400
957
997
1163
769
2016
Q1
Q2
Q3
Q4
0 200 400 600 800 1000 1200 1400
1008
1035
1189
811
11
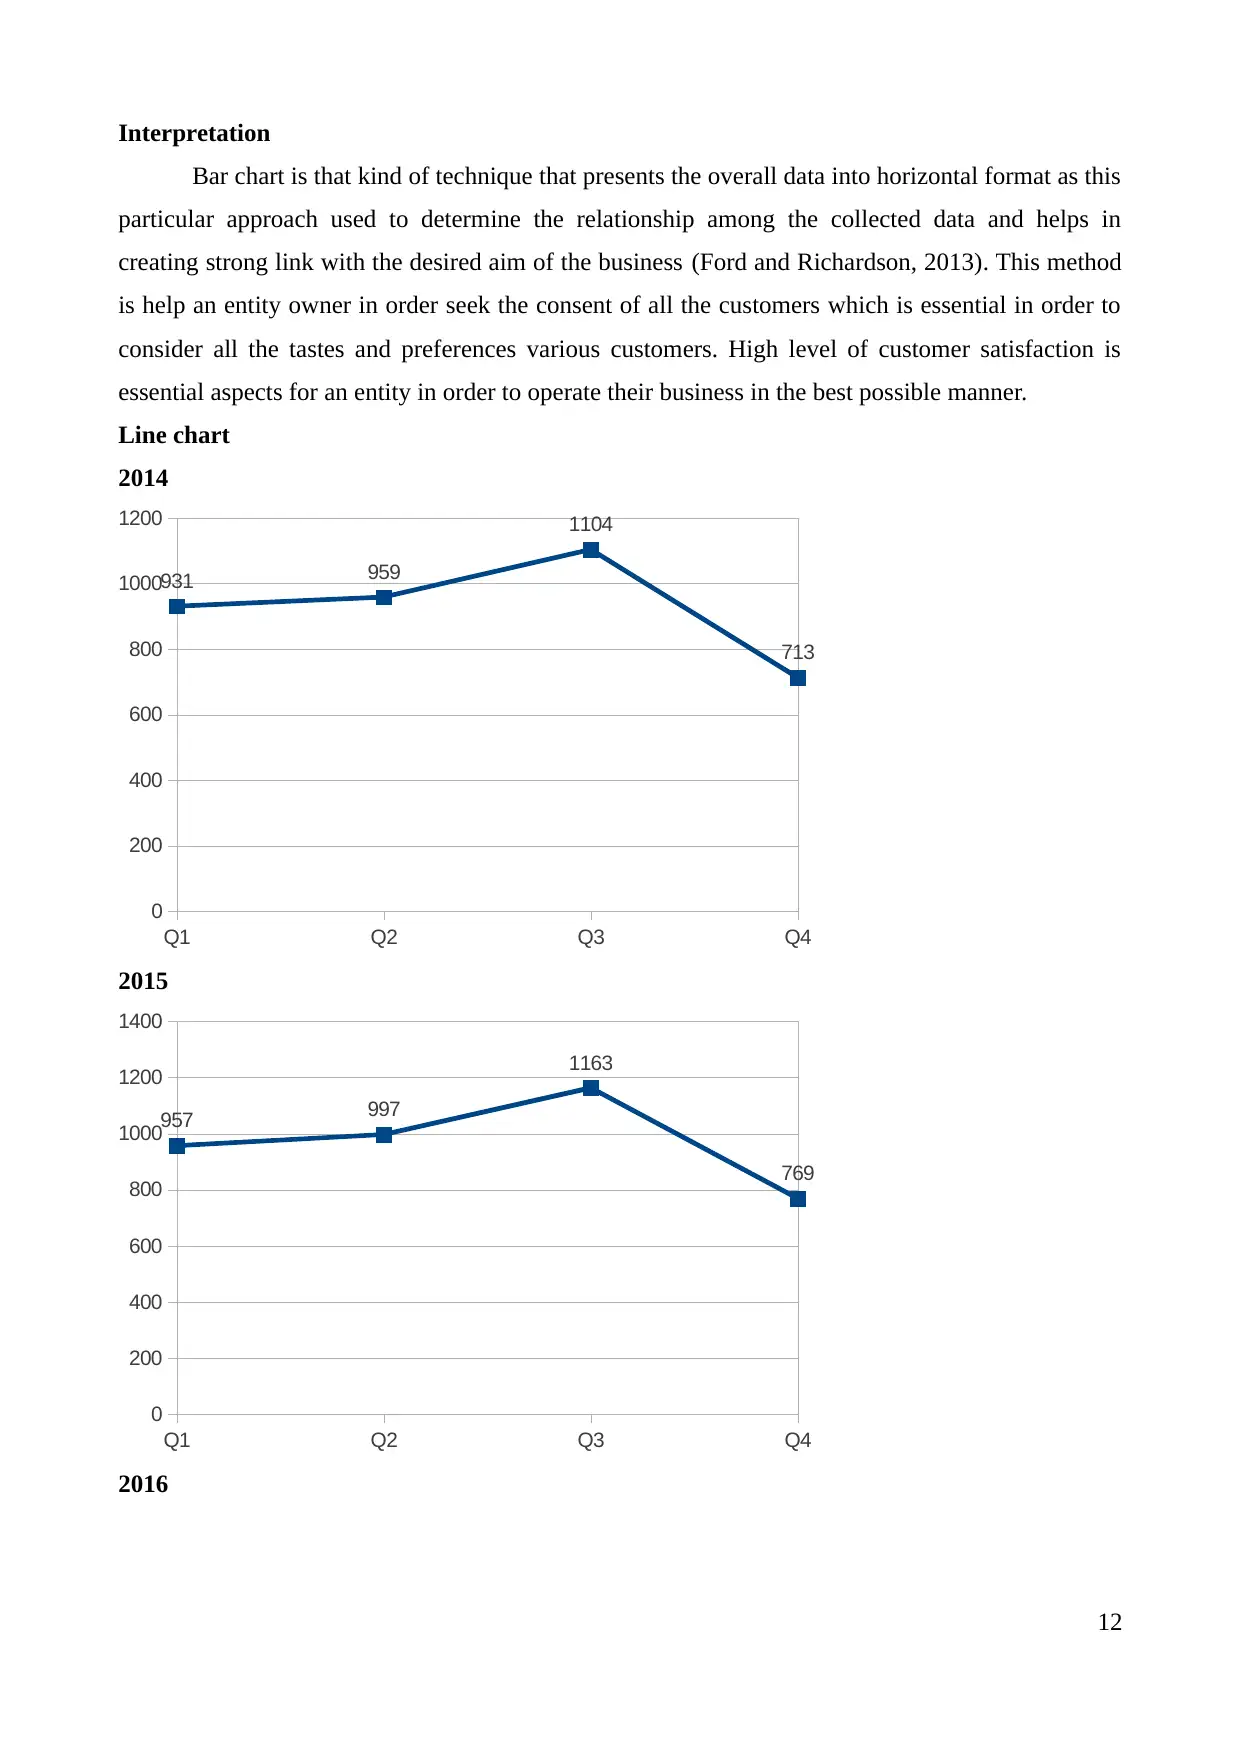
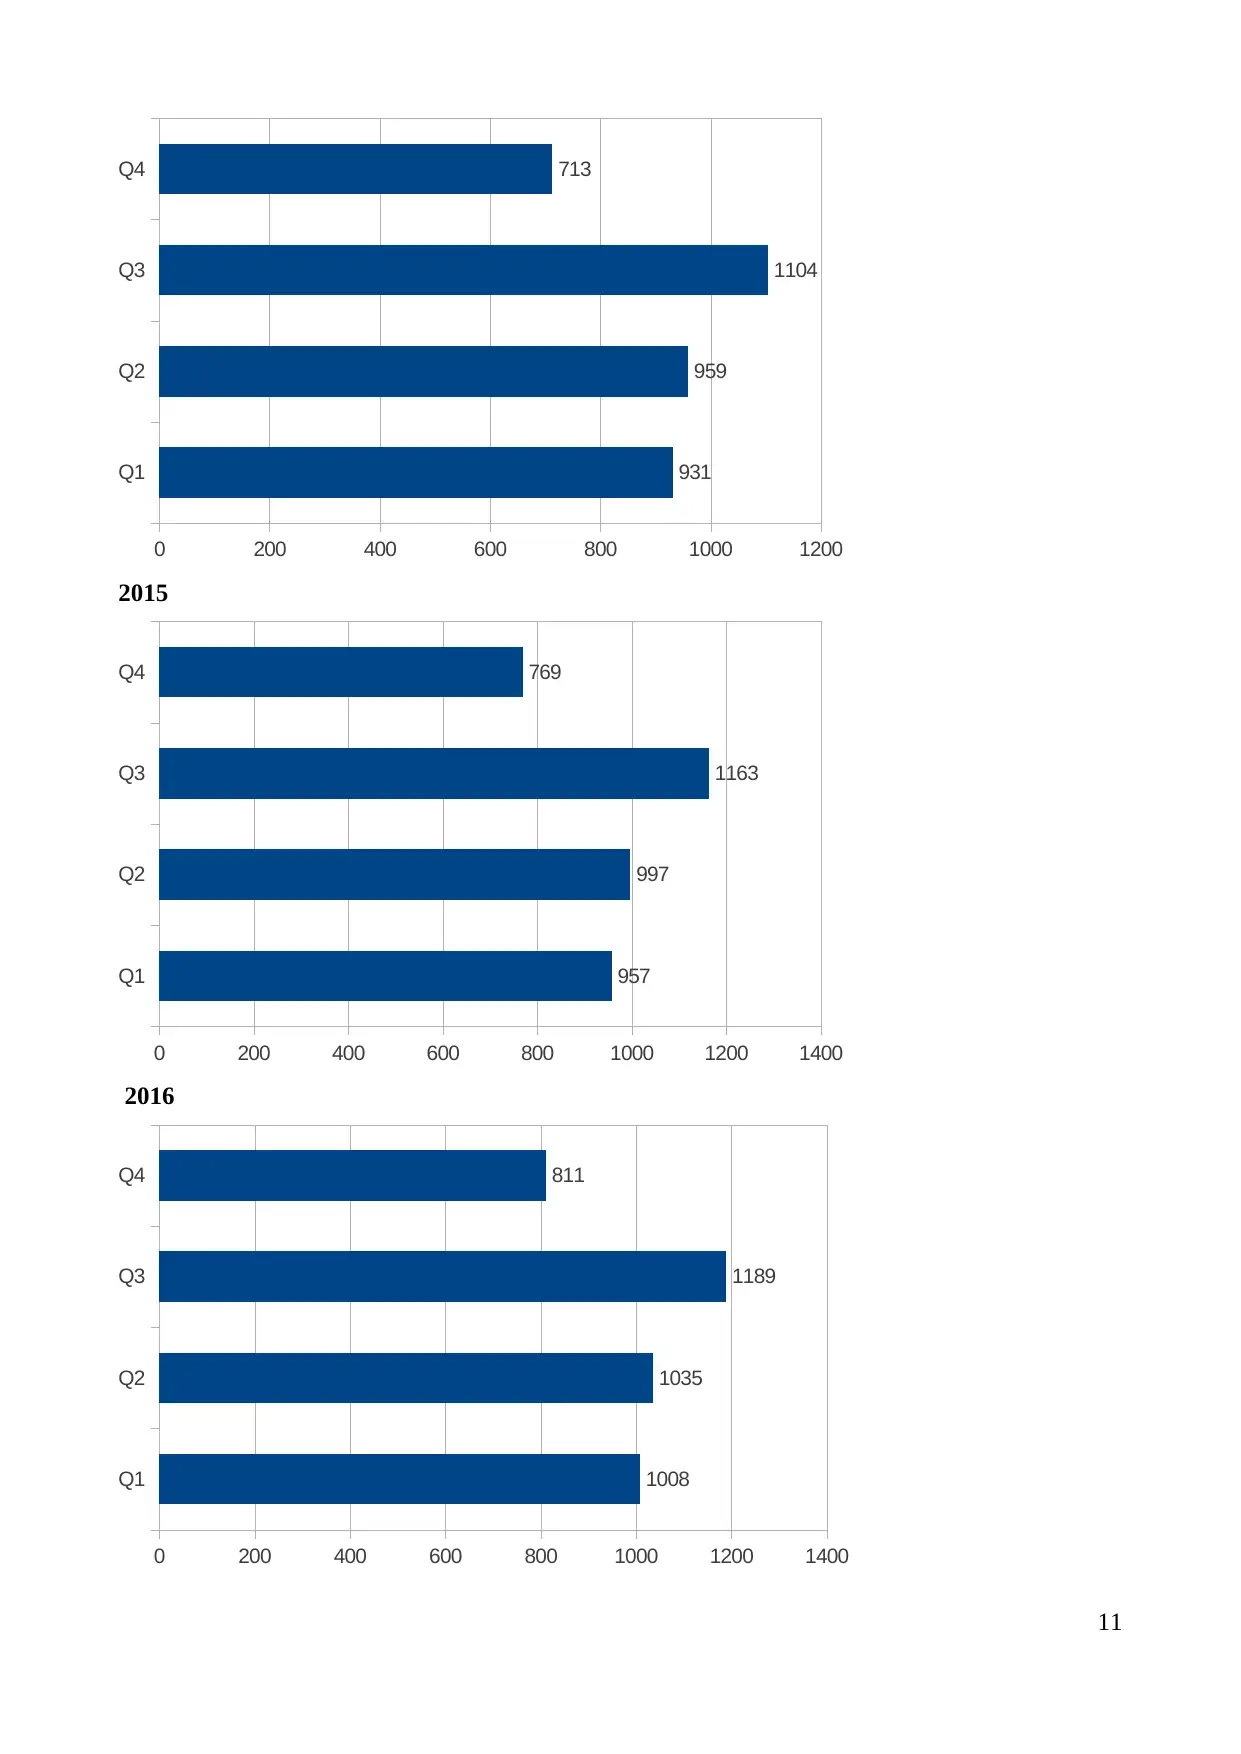
Interpretation
Bar chart is that kind of technique that presents the overall data into horizontal format as this
particular approach used to determine the relationship among the collected data and helps in
creating strong link with the desired aim of the business (Ford and Richardson, 2013). This method
is help an entity owner in order seek the consent of all the customers which is essential in order to
consider all the tastes and preferences various customers. High level of customer satisfaction is
essential aspects for an entity in order to operate their business in the best possible manner.
Line chart
2014
Q1 Q2 Q3 Q4
0
200
400
600
800
1000
1200
931 959
1104
713
2015
Q1 Q2 Q3 Q4
0
200
400
600
800
1000
1200
1400
957 997
1163
769
2016
12
⊘ This is a preview!⊘
Do you want full access?
Subscribe today to unlock all pages.
Trusted by 1+ million students worldwide
1 out of 19
Related Documents


Your All-in-One AI-Powered Toolkit for Academic Success.
+13062052269
info@desklib.com
Available 24*7 on WhatsApp / Email
![[object Object]](/_next/static/media/star-bottom.7253800d.svg)
Unlock your academic potential
Copyright © 2020–2026 A2Z Services. All Rights Reserved. Developed and managed by ZUCOL.