Business Decision Making Report: Data Analysis and Findings
VerifiedAdded on 2020/06/05
|19
|3993
|361
Report
AI Summary
This report provides a comprehensive analysis of business decision-making, focusing on a case study of UKCBC. The report begins by outlining data collection methods, including primary and secondary sources, with a specific emphasis on the use of surveys and questionnaires to gather student feedback. It details the survey methodology, sampling frame, and the development of the questionnaire. The subsequent sections delve into data summarization and analysis, employing descriptive statistics to draw valid conclusions about student satisfaction levels. Measures of dispersion, including standard deviation and range, are calculated and interpreted. Furthermore, the report explores quartile, quantile, and correlation coefficient calculations. The findings are visually represented through graphs, and trend lines are created for forecasting. The report culminates in the preparation of a formal business report and PowerPoint presentation, showcasing the use of information processing tools, project planning, and financial tools in decision-making processes, with a focus on the practical application of these tools within the UKCBC context.
Business Decision
Making
Making
Paraphrase This Document
Need a fresh take? Get an instant paraphrase of this document with our AI Paraphraser
TABLE OF CONTENTS
INTRODUCTION...........................................................................................................................1
TASK 1............................................................................................................................................1
1. Stating the ways to collect data for the research purpose..................................................1
2. Stating the survey methodology and sampling frame for the current study.......................2
3. Developing questionnaire for survey..................................................................................2
TASK 22.1 and 2.2 Summarizing data gathered through survey and Analysing the results of
survey to draw valid conclusion ....................................................................................................5
2.3 Measures of dispersion.....................................................................................................6
Interpretation and analysis: ....................................................................................................7
2.4 Calculating quartile, quantile and correlation coefficient ...............................................7
TASK 3............................................................................................................................................8
3.1 Producing graphs on the basis of the survey’s results......................................................8
3.2 Creating trend line for forecasting future ........................................................................9
3.3 Preparation of power point presentation of findings......................................................11
3.4 Producing a formal business report ...............................................................................11
TASK 4..........................................................................................................................................12
4.1 Presenting the use of information processing tools at different level............................12
4.2 Preparing project plan and determining critical path ....................................................12
4.3 Presenting the use of financial tools in decision making ..............................................13
CONCLUSION .............................................................................................................................15
REFERENCES .............................................................................................................................16
INTRODUCTION
In the present era, business decision making has become highly complex due to rise in
level of competition. Further, there are several factors such as changes in the expectation of
target market; technological advancements etc which in turn has direct impact on the growth and
success of organization. The present report is based on UKCBC which is one of the well-known
and leading institutions of UK. It offers highly advanced educational facilities to the students that
aid in their career growth. In this, report will provide deeper insight about the manner through
which scholar can gather primary and secondary data for meeting the research purpose. Besides
this, study will also shed light on the research tools like survey methodology and sampling
frame. Further, report will depict the manner in which large data can be simplified for the
purpose of decision making. Hence, it will exhibit the use of statistical techniques in getting
information about the extent to which students are satisfied from the services offered by
UKCBC. This report will also highlight the significance and use of investment appraisal tools in
decision making.
TASK 1
1. Stating the ways to collect data for the research purpose
In the field of research, data gathered by scholars have direct influence on the
appropriateness of outcome. Thus, there are mainly two types of sources that researcher
undertakes to gather data namely primary and secondary. Sources for primary data collection
include survey, focus group, observation etc. On contrary to this, through internet surfing one
can access books, journals and articles that are related to the research issue (Collier, 2015).
Hence, with the motive to get information about the satisfaction as well as experience of the
customers scholar will gather data from both primary as well as secondary sources. Ways and
sources to collect data for the concerned research are enumerated below:
Primary data collection: For the collection of primary data scholar will conduct survey via
questionnaire. The rationale behind the selection of such method is that it helps in collecting
highly appropriate information in line with the research issue. Thus, for the purpose of primary
data collection 20 students of UKCBC has been selected by the scholar. Moreover, it is not
possible for the researcher to conduct study on whole population. Once, sample has been
selected, thereafter scholar will frame questionnaire by including questions about the teaching
1
⊘ This is a preview!⊘
Do you want full access?
Subscribe today to unlock all pages.
Trusted by 1+ million students worldwide
practices, module and other academic arrangements. This in turn helps scholar in deriving highly
suitable information and meeting the research aims. In the third step, scholar will send
questionnaire to the students on their Email and thereby gathers primary data.
Secondary data collection: To collect secondary information researcher will evaluate books,
journals and scholarly articles that are related to academics as well as factors that affect student’s
satisfaction. This in turn develops theoretical understanding among the researcher about the
issues which are going to be investigated.
2. Stating the survey methodology and sampling frame for the current study
Sampling frame: Researcher is required to select sample, in survey, because of having
time limitations it is not possible to conduct investigation on whole population (Ibrahim, Dumas
and McGuire, 2015). By considering this, 20 students have been selected by the researcher
through applying simple random sampling. Hence, out of 20 respondents, 10 students will be
from Wentworth and remaining 10 selected from Lord House campus. Thus, for development of
highly strategic policy framework scholar will focus on both such campuses.
Survey methodology: In order to save time and provide concerned stakeholders of the
study with appropriate outcomes researcher will conduct online survey. On the basis of such
aspect, by sending questionnaire to the students on their email, survey will be conducted by the
researcher.
Types of investigation: In research, investigation types can be distinguished into two
forms which are qualitative and quantitative. Hence, in the current study, for evaluating the level
of UKCBC's student’s satisfaction and their experience level scholar will employ quantitative
investigation type. In accordance with research issue, by applying quantitative tools like
descriptive statistics researcher will present the extent to which students are satisfied from the
educational services offered by the Wentworth and Lord house campuses of UKCBC's.
3. Developing questionnaire for survey
In survey, questionnaire is highly significant which in turn helps in deriving suitable
information from the respondents. Moreover, questionnaire contains questions as per the
research aims and objectives. Thus, by including open and close ended questions questionnaire
has been designed by the scholar:
Demographic information
2
Paraphrase This Document
Need a fresh take? Get an instant paraphrase of this document with our AI Paraphraser
Name …
Age....
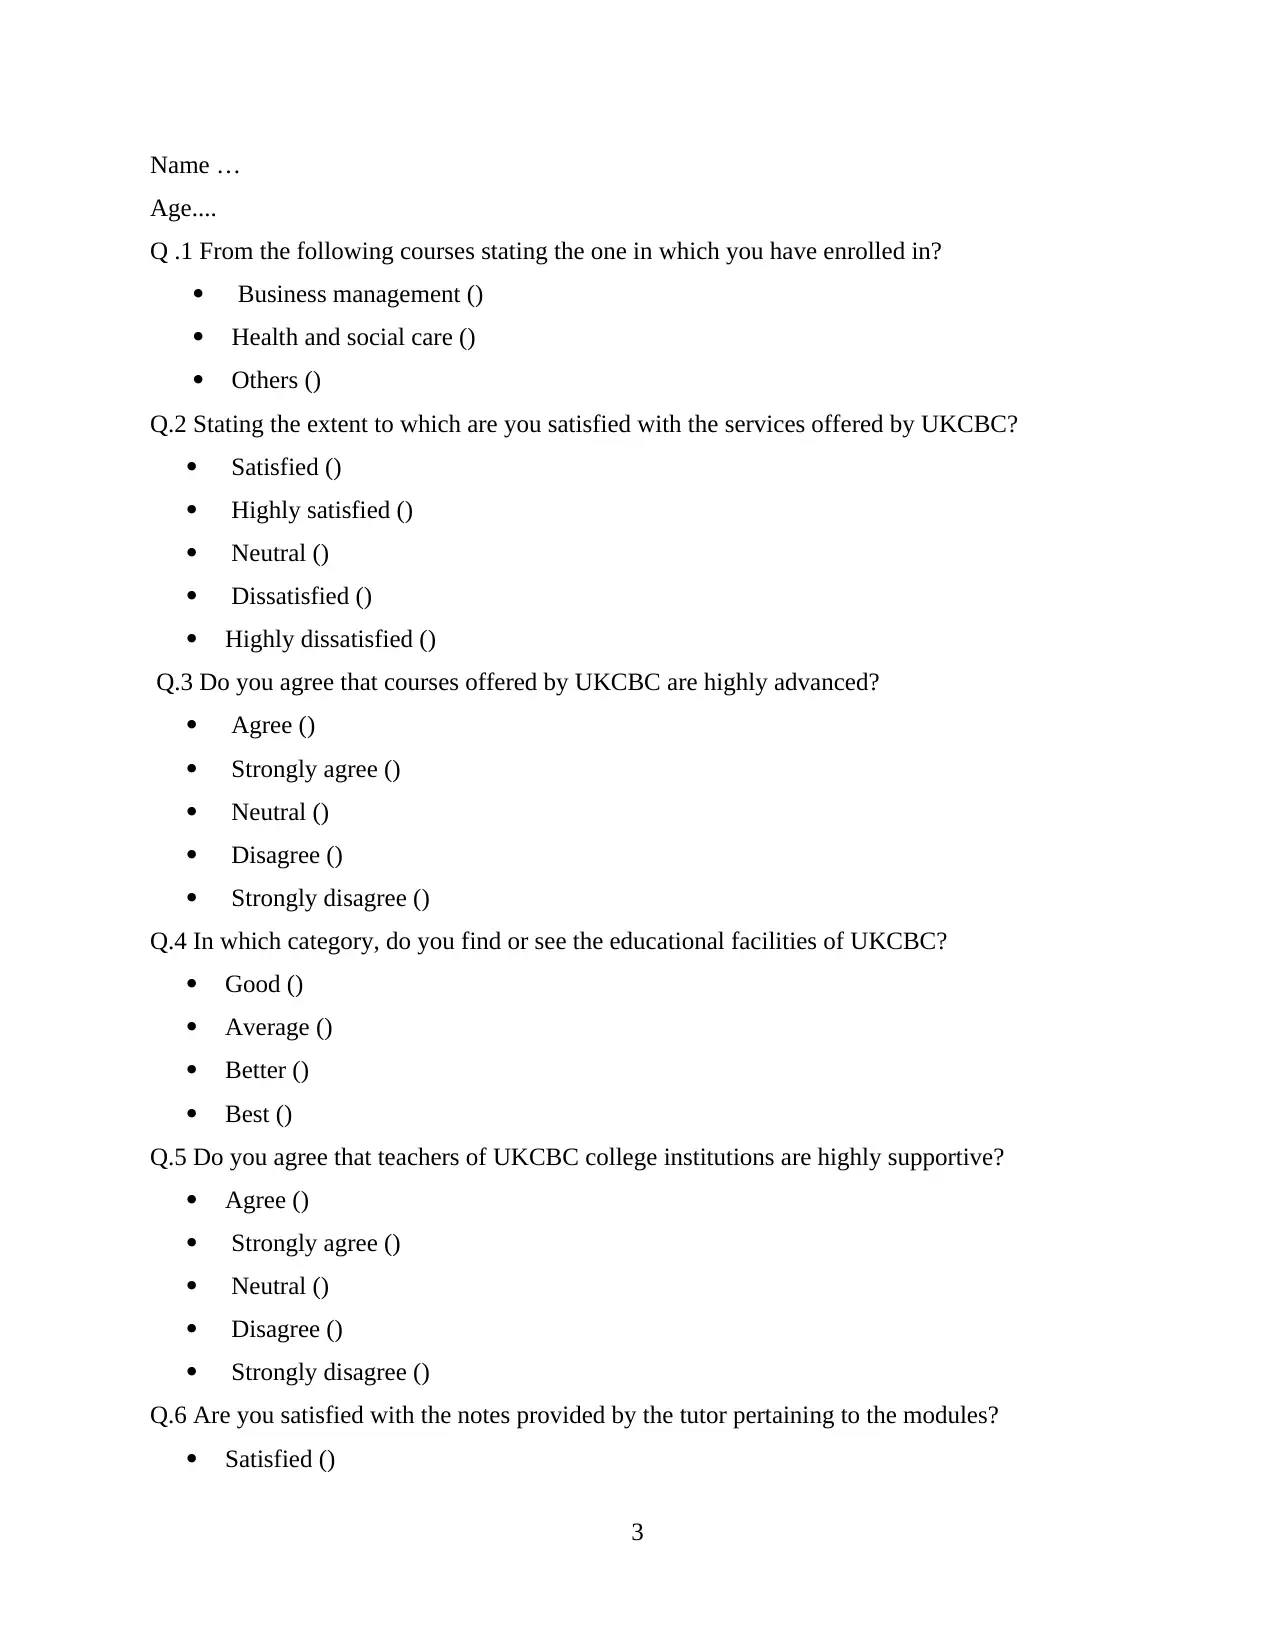
Q .1 From the following courses stating the one in which you have enrolled in?
Business management ()
Health and social care ()
Others ()
Q.2 Stating the extent to which are you satisfied with the services offered by UKCBC?
Satisfied ()
Highly satisfied ()
Neutral ()
Dissatisfied ()
Highly dissatisfied ()
Q.3 Do you agree that courses offered by UKCBC are highly advanced?
Agree ()
Strongly agree ()
Neutral ()
Disagree ()
Strongly disagree ()
Q.4 In which category, do you find or see the educational facilities of UKCBC?
Good ()
Average ()
Better ()
Best ()
Q.5 Do you agree that teachers of UKCBC college institutions are highly supportive?
Agree ()
Strongly agree ()
Neutral ()
Disagree ()
Strongly disagree ()
Q.6 Are you satisfied with the notes provided by the tutor pertaining to the modules?
Satisfied ()
3
Age....
Q .1 From the following courses stating the one in which you have enrolled in?
Business management ()
Health and social care ()
Others ()
Q.2 Stating the extent to which are you satisfied with the services offered by UKCBC?
Satisfied ()
Highly satisfied ()
Neutral ()
Dissatisfied ()
Highly dissatisfied ()
Q.3 Do you agree that courses offered by UKCBC are highly advanced?
Agree ()
Strongly agree ()
Neutral ()
Disagree ()
Strongly disagree ()
Q.4 In which category, do you find or see the educational facilities of UKCBC?
Good ()
Average ()
Better ()
Best ()
Q.5 Do you agree that teachers of UKCBC college institutions are highly supportive?
Agree ()
Strongly agree ()
Neutral ()
Disagree ()
Strongly disagree ()
Q.6 Are you satisfied with the notes provided by the tutor pertaining to the modules?
Satisfied ()
3
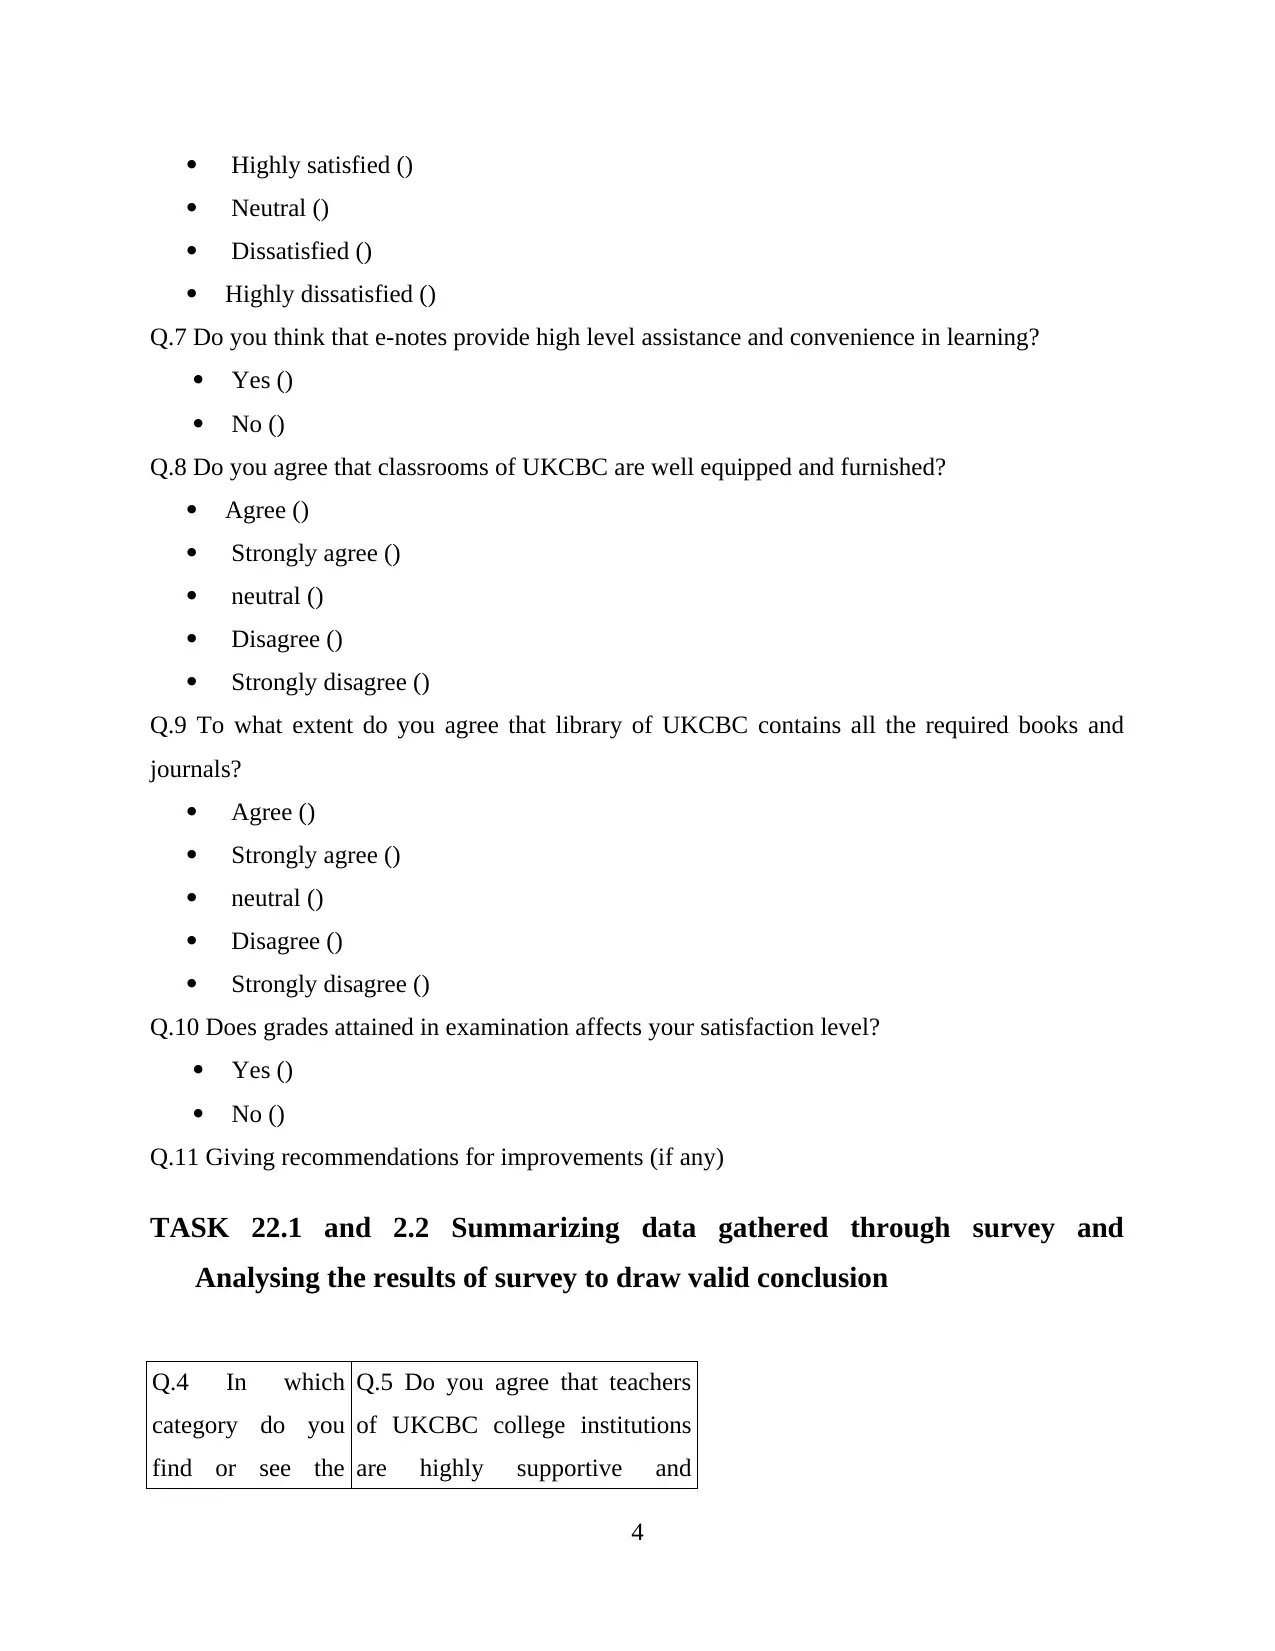
Highly satisfied ()
Neutral ()
Dissatisfied ()
Highly dissatisfied ()
Q.7 Do you think that e-notes provide high level assistance and convenience in learning?
Yes ()
No ()
Q.8 Do you agree that classrooms of UKCBC are well equipped and furnished?
Agree ()
Strongly agree ()
neutral ()
Disagree ()
Strongly disagree ()
Q.9 To what extent do you agree that library of UKCBC contains all the required books and
journals?
Agree ()
Strongly agree ()
neutral ()
Disagree ()
Strongly disagree ()
Q.10 Does grades attained in examination affects your satisfaction level?
Yes ()
No ()
Q.11 Giving recommendations for improvements (if any)
TASK 22.1 and 2.2 Summarizing data gathered through survey and
Analysing the results of survey to draw valid conclusion
Q.4 In which
category do you
find or see the
Q.5 Do you agree that teachers
of UKCBC college institutions
are highly supportive and
4
⊘ This is a preview!⊘
Do you want full access?
Subscribe today to unlock all pages.
Trusted by 1+ million students worldwide
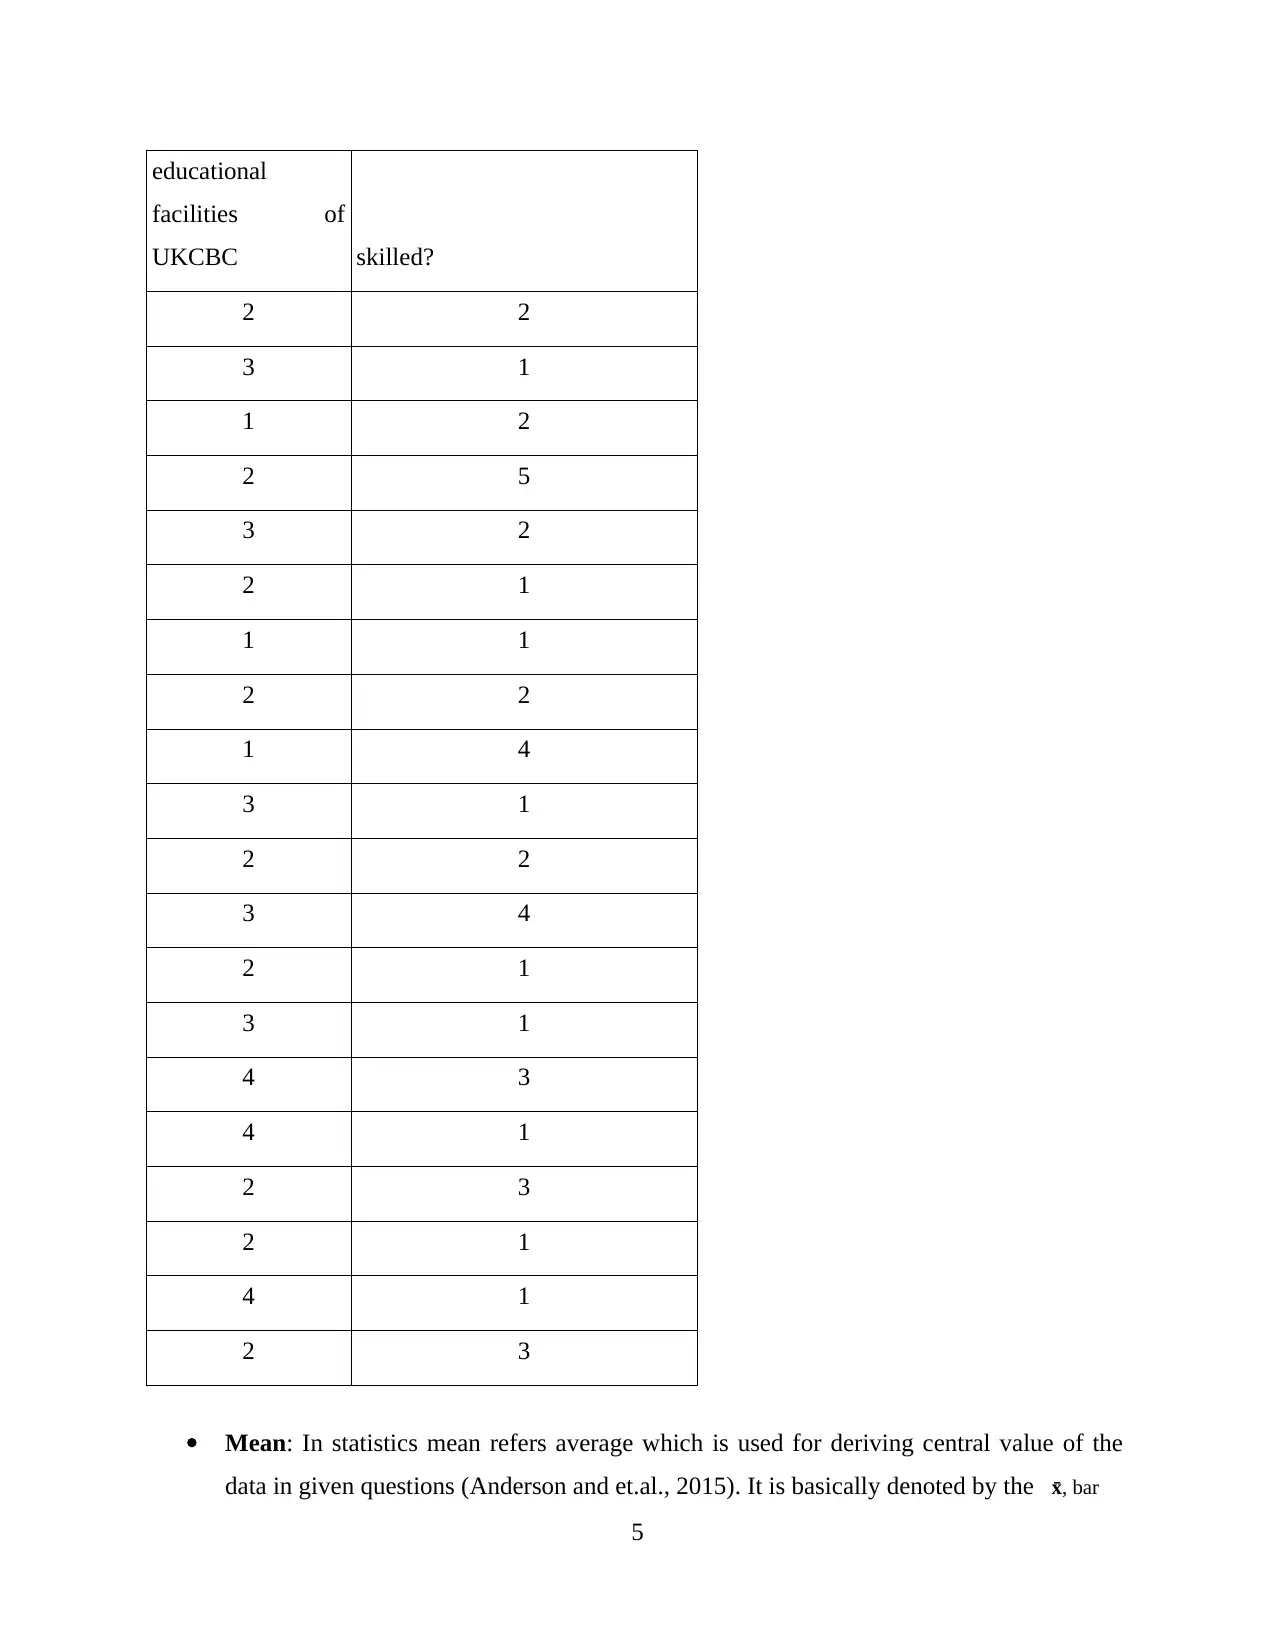
educational
facilities of
UKCBC skilled?
2 2
3 1
1 2
2 5
3 2
2 1
1 1
2 2
1 4
3 1
2 2
3 4
2 1
3 1
4 3
4 1
2 3
2 1
4 1
2 3
Mean: In statistics mean refers average which is used for deriving central value of the
data in given questions (Anderson and et.al., 2015). It is basically denoted by the x̄, bar
5
facilities of
UKCBC skilled?
2 2
3 1
1 2
2 5
3 2
2 1
1 1
2 2
1 4
3 1
2 2
3 4
2 1
3 1
4 3
4 1
2 3
2 1
4 1
2 3
Mean: In statistics mean refers average which is used for deriving central value of the
data in given questions (Anderson and et.al., 2015). It is basically denoted by the x̄, bar
5
Paraphrase This Document
Need a fresh take? Get an instant paraphrase of this document with our AI Paraphraser
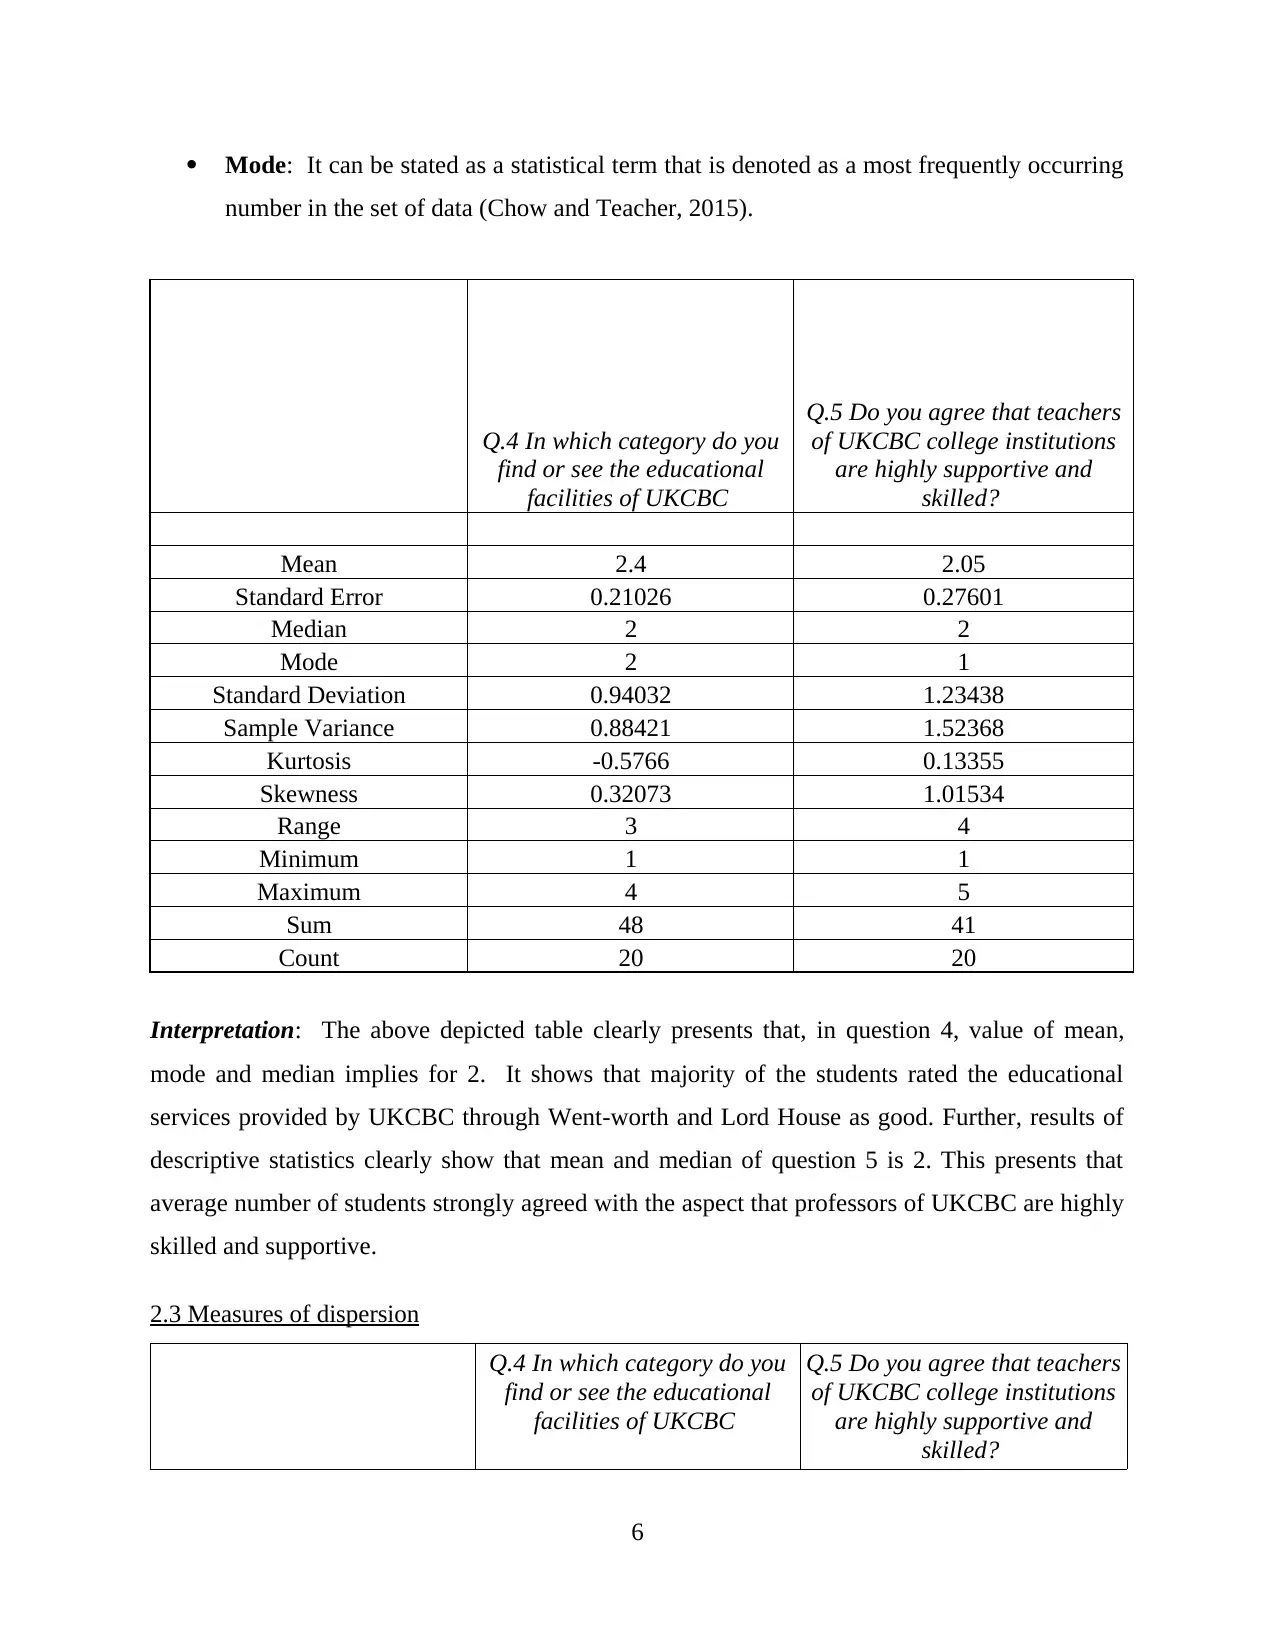
Mode: It can be stated as a statistical term that is denoted as a most frequently occurring
number in the set of data (Chow and Teacher, 2015).
Q.4 In which category do you
find or see the educational
facilities of UKCBC
Q.5 Do you agree that teachers
of UKCBC college institutions
are highly supportive and
skilled?
Mean 2.4 2.05
Standard Error 0.21026 0.27601
Median 2 2
Mode 2 1
Standard Deviation 0.94032 1.23438
Sample Variance 0.88421 1.52368
Kurtosis -0.5766 0.13355
Skewness 0.32073 1.01534
Range 3 4
Minimum 1 1
Maximum 4 5
Sum 48 41
Count 20 20
Interpretation: The above depicted table clearly presents that, in question 4, value of mean,
mode and median implies for 2. It shows that majority of the students rated the educational
services provided by UKCBC through Went-worth and Lord House as good. Further, results of
descriptive statistics clearly show that mean and median of question 5 is 2. This presents that
average number of students strongly agreed with the aspect that professors of UKCBC are highly
skilled and supportive.
2.3 Measures of dispersion
Q.4 In which category do you
find or see the educational
facilities of UKCBC
Q.5 Do you agree that teachers
of UKCBC college institutions
are highly supportive and
skilled?
6
Standard Deviation 0.94032 1.23438
Range 3 4
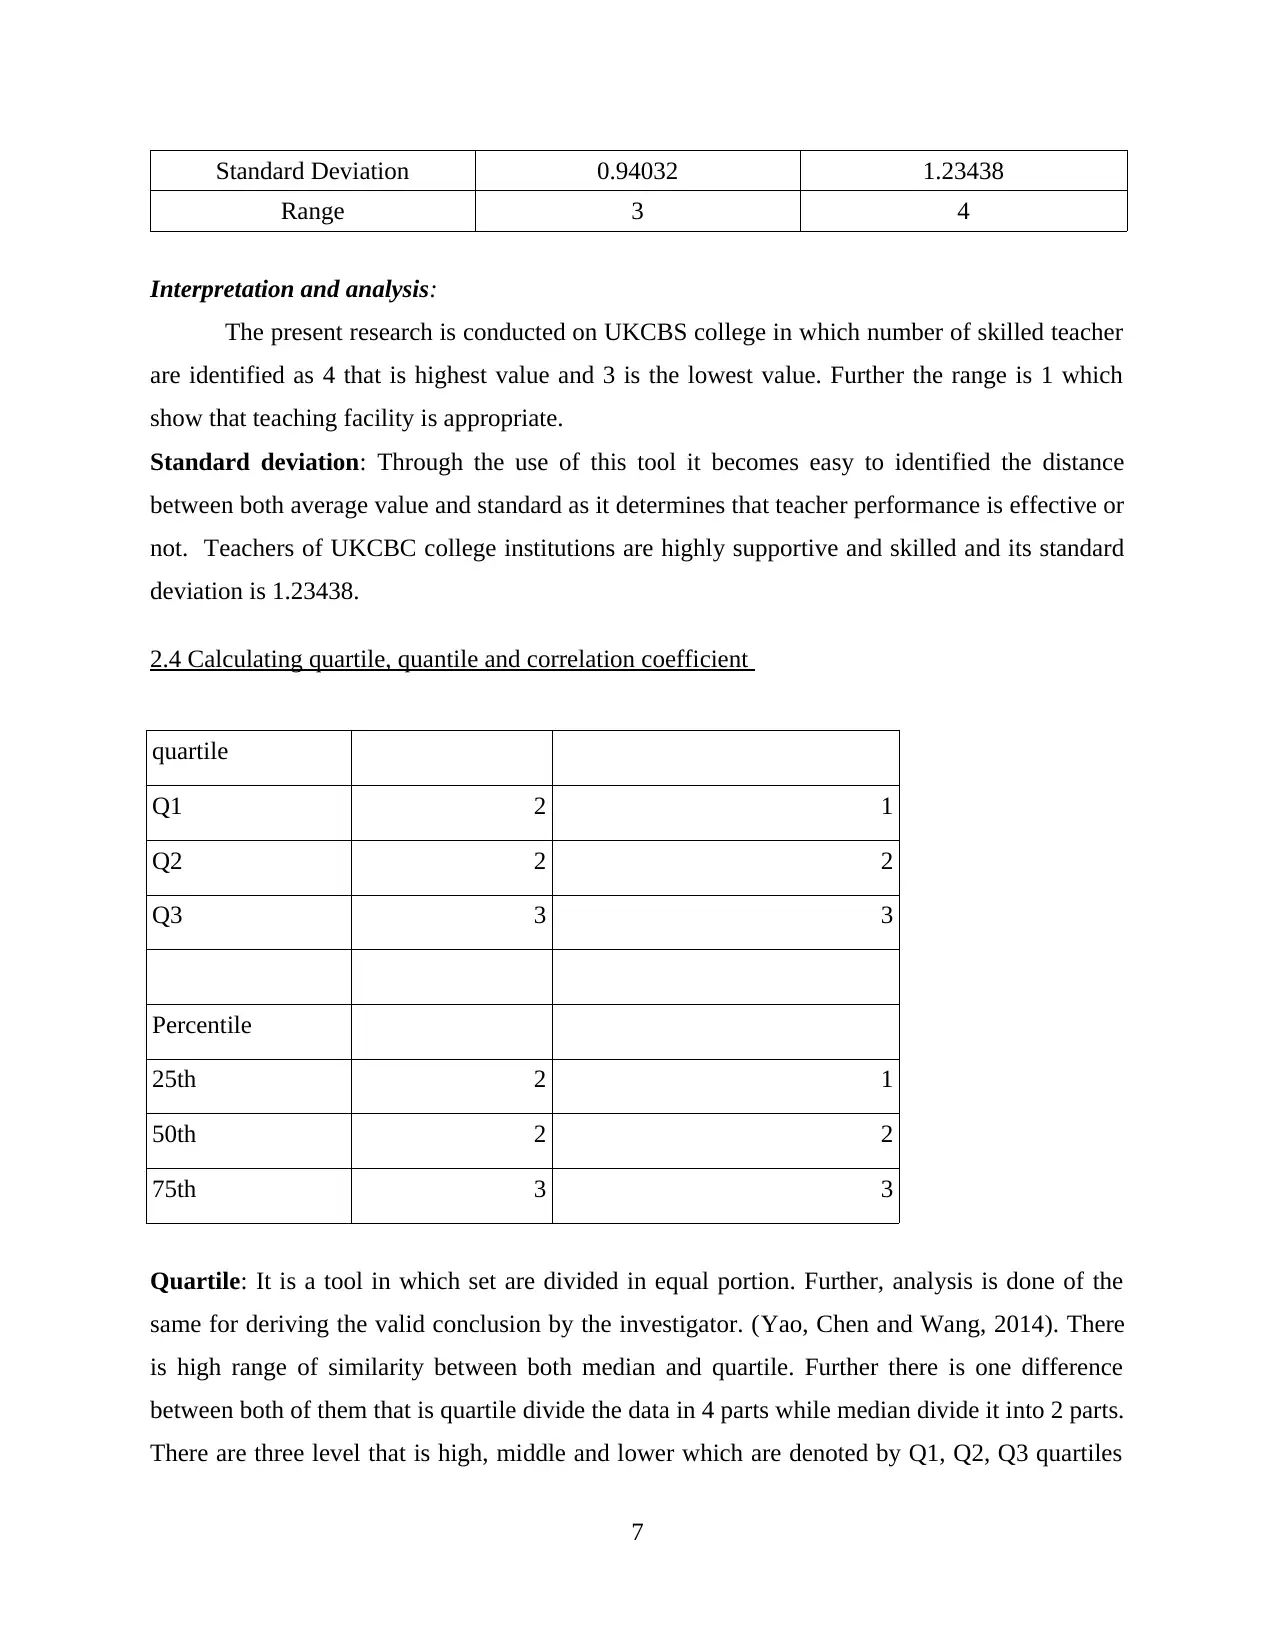
Interpretation and analysis:
The present research is conducted on UKCBS college in which number of skilled teacher
are identified as 4 that is highest value and 3 is the lowest value. Further the range is 1 which
show that teaching facility is appropriate.
Standard deviation: Through the use of this tool it becomes easy to identified the distance
between both average value and standard as it determines that teacher performance is effective or
not. Teachers of UKCBC college institutions are highly supportive and skilled and its standard
deviation is 1.23438.
2.4 Calculating quartile, quantile and correlation coefficient
quartile
Q1 2 1
Q2 2 2
Q3 3 3
Percentile
25th 2 1
50th 2 2
75th 3 3
Quartile: It is a tool in which set are divided in equal portion. Further, analysis is done of the
same for deriving the valid conclusion by the investigator. (Yao, Chen and Wang, 2014). There
is high range of similarity between both median and quartile. Further there is one difference
between both of them that is quartile divide the data in 4 parts while median divide it into 2 parts.
There are three level that is high, middle and lower which are denoted by Q1, Q2, Q3 quartiles
7
Range 3 4
Interpretation and analysis:
The present research is conducted on UKCBS college in which number of skilled teacher
are identified as 4 that is highest value and 3 is the lowest value. Further the range is 1 which
show that teaching facility is appropriate.
Standard deviation: Through the use of this tool it becomes easy to identified the distance
between both average value and standard as it determines that teacher performance is effective or
not. Teachers of UKCBC college institutions are highly supportive and skilled and its standard
deviation is 1.23438.
2.4 Calculating quartile, quantile and correlation coefficient
quartile
Q1 2 1
Q2 2 2
Q3 3 3
Percentile
25th 2 1
50th 2 2
75th 3 3
Quartile: It is a tool in which set are divided in equal portion. Further, analysis is done of the
same for deriving the valid conclusion by the investigator. (Yao, Chen and Wang, 2014). There
is high range of similarity between both median and quartile. Further there is one difference
between both of them that is quartile divide the data in 4 parts while median divide it into 2 parts.
There are three level that is high, middle and lower which are denoted by Q1, Q2, Q3 quartiles
7
⊘ This is a preview!⊘
Do you want full access?
Subscribe today to unlock all pages.
Trusted by 1+ million students worldwide
and they are 2,2,3 Apart from this inter quartile range value from the data set is derived that is
19.25 which is different method of upper and lower quartile.
Percentile: Percentile provide the information at the time when it is divided into 4 parts.
However, all the tools levels are reflected in form of the percentile which is 2,2,3.
TASK 3
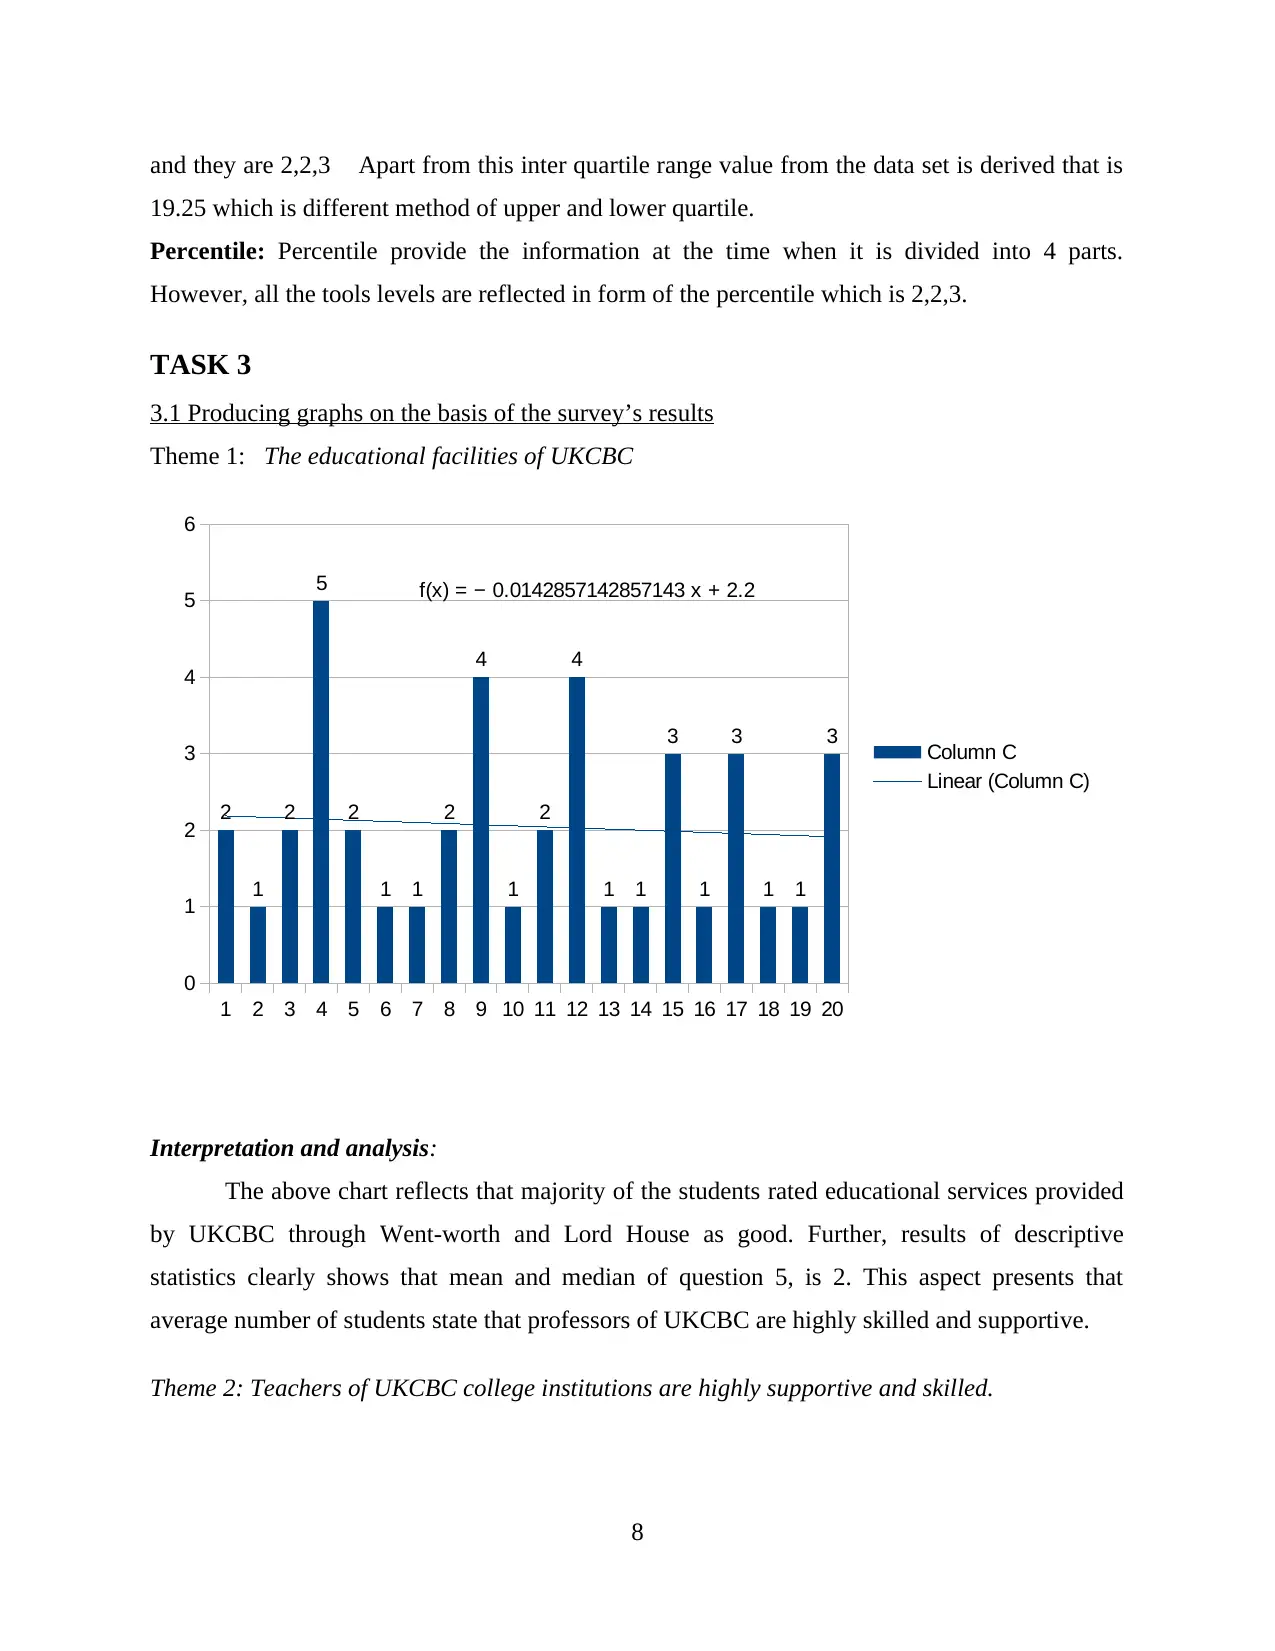
3.1 Producing graphs on the basis of the survey’s results
Theme 1: The educational facilities of UKCBC
Interpretation and analysis:
The above chart reflects that majority of the students rated educational services provided
by UKCBC through Went-worth and Lord House as good. Further, results of descriptive
statistics clearly shows that mean and median of question 5, is 2. This aspect presents that
average number of students state that professors of UKCBC are highly skilled and supportive.
Theme 2: Teachers of UKCBC college institutions are highly supportive and skilled.
8
1 2 3 4 5 6 7 8 9 10 11 12 13 14 15 16 17 18 19 20
0
1
2
3
4
5
6
2
1
2
5
2
1 1
2
4
1
2
4
1 1
3
1
3
1 1
3
f(x) = − 0.0142857142857143 x + 2.2
Column C
Linear (Column C)
19.25 which is different method of upper and lower quartile.
Percentile: Percentile provide the information at the time when it is divided into 4 parts.
However, all the tools levels are reflected in form of the percentile which is 2,2,3.
TASK 3
3.1 Producing graphs on the basis of the survey’s results
Theme 1: The educational facilities of UKCBC
Interpretation and analysis:
The above chart reflects that majority of the students rated educational services provided
by UKCBC through Went-worth and Lord House as good. Further, results of descriptive
statistics clearly shows that mean and median of question 5, is 2. This aspect presents that
average number of students state that professors of UKCBC are highly skilled and supportive.
Theme 2: Teachers of UKCBC college institutions are highly supportive and skilled.
8
1 2 3 4 5 6 7 8 9 10 11 12 13 14 15 16 17 18 19 20
0
1
2
3
4
5
6
2
1
2
5
2
1 1
2
4
1
2
4
1 1
3
1
3
1 1
3
f(x) = − 0.0142857142857143 x + 2.2
Column C
Linear (Column C)
Paraphrase This Document
Need a fresh take? Get an instant paraphrase of this document with our AI Paraphraser
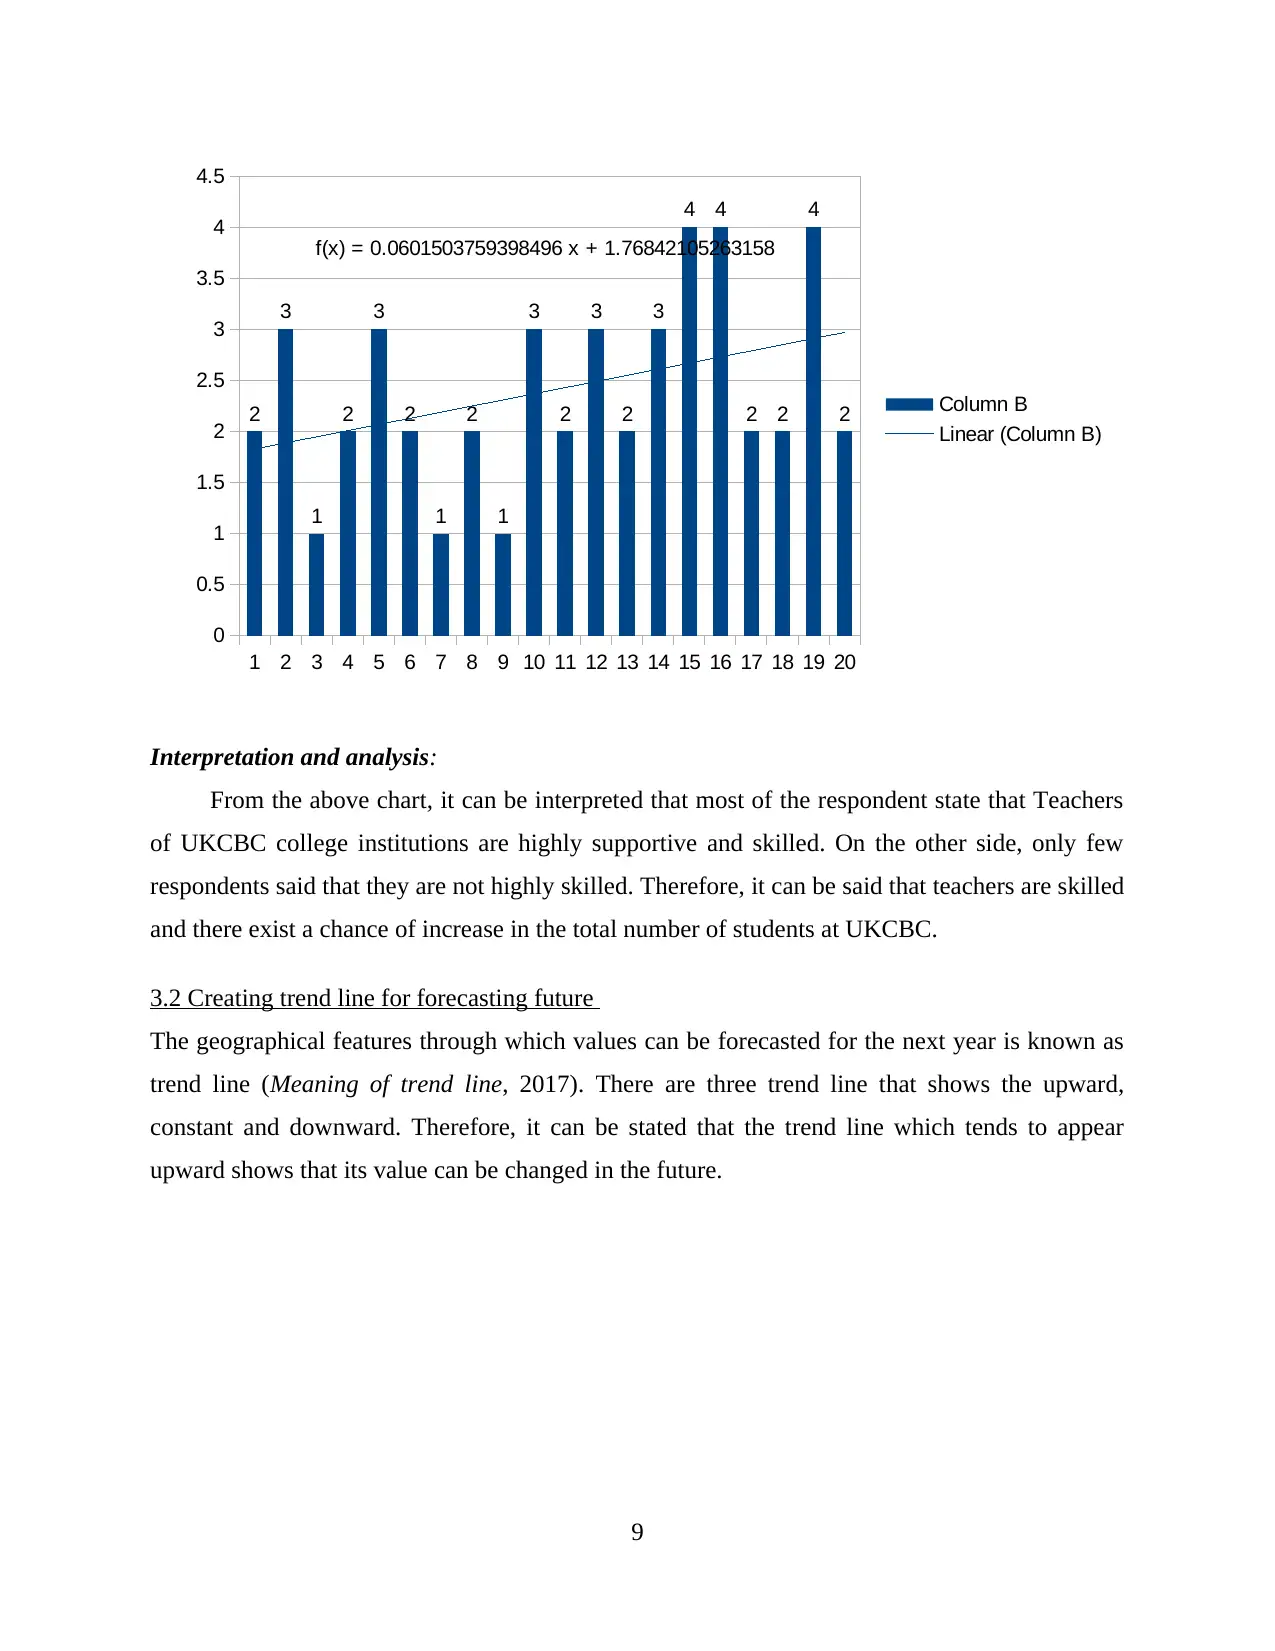
Interpretation and analysis:
From the above chart, it can be interpreted that most of the respondent state that Teachers
of UKCBC college institutions are highly supportive and skilled. On the other side, only few
respondents said that they are not highly skilled. Therefore, it can be said that teachers are skilled
and there exist a chance of increase in the total number of students at UKCBC.
3.2 Creating trend line for forecasting future
The geographical features through which values can be forecasted for the next year is known as
trend line (Meaning of trend line, 2017). There are three trend line that shows the upward,
constant and downward. Therefore, it can be stated that the trend line which tends to appear
upward shows that its value can be changed in the future.
9
1 2 3 4 5 6 7 8 9 10 11 12 13 14 15 16 17 18 19 20
0
0.5
1
1.5
2
2.5
3
3.5
4
4.5
2
3
1
2
3
2
1
2
1
3
2
3
2
3
4 4
2 2
4
2
f(x) = 0.0601503759398496 x + 1.76842105263158
Column B
Linear (Column B)
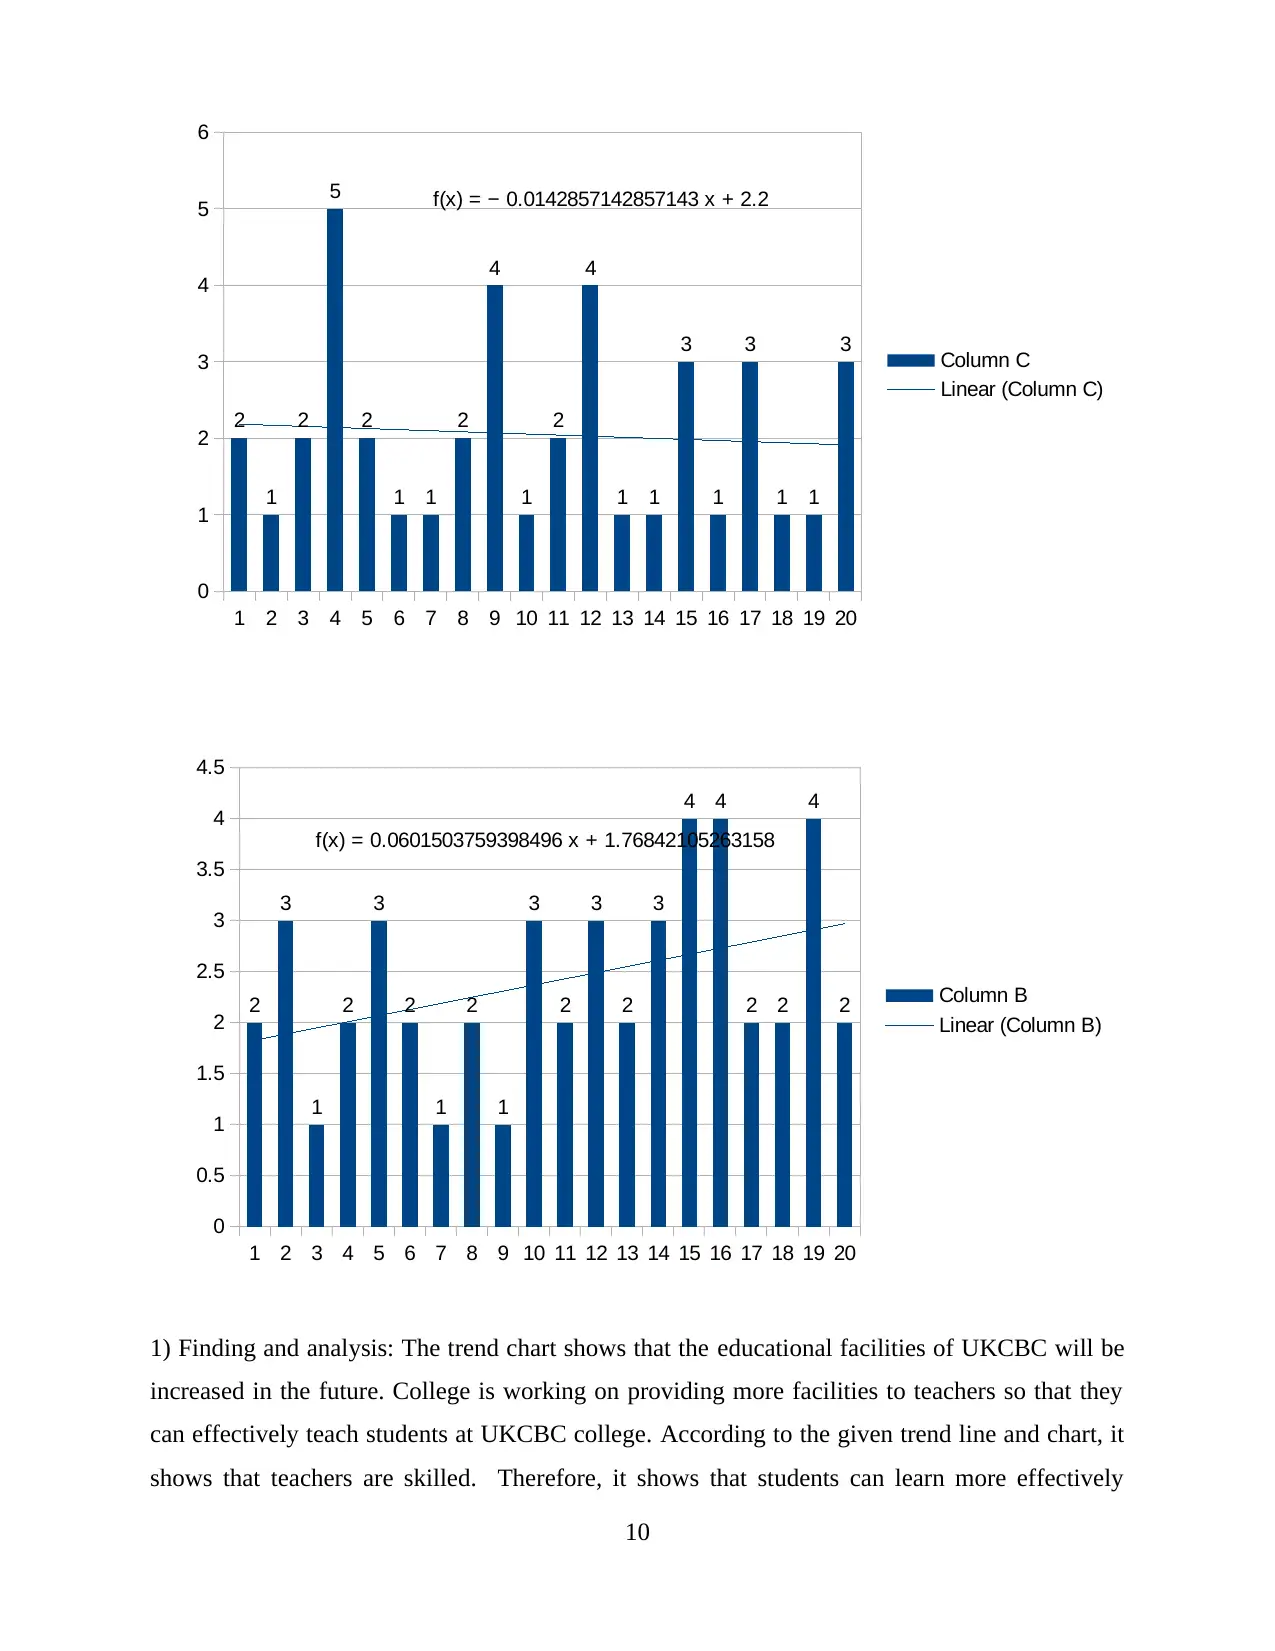
1) Finding and analysis: The trend chart shows that the educational facilities of UKCBC will be
increased in the future. College is working on providing more facilities to teachers so that they
can effectively teach students at UKCBC college. According to the given trend line and chart, it
shows that teachers are skilled. Therefore, it shows that students can learn more effectively
10
1 2 3 4 5 6 7 8 9 10 11 12 13 14 15 16 17 18 19 20
0
1
2
3
4
5
6
2
1
2
5
2
1 1
2
4
1
2
4
1 1
3
1
3
1 1
3
f(x) = − 0.0142857142857143 x + 2.2
Column C
Linear (Column C)
1 2 3 4 5 6 7 8 9 10 11 12 13 14 15 16 17 18 19 20
0
0.5
1
1.5
2
2.5
3
3.5
4
4.5
2
3
1
2
3
2
1
2
1
3
2
3
2
3
4 4
2 2
4
2
f(x) = 0.0601503759398496 x + 1.76842105263158
Column B
Linear (Column B)
⊘ This is a preview!⊘
Do you want full access?
Subscribe today to unlock all pages.
Trusted by 1+ million students worldwide
1 out of 19
Related Documents


Your All-in-One AI-Powered Toolkit for Academic Success.
+13062052269
info@desklib.com
Available 24*7 on WhatsApp / Email
![[object Object]](/_next/static/media/star-bottom.7253800d.svg)
Unlock your academic potential
Copyright © 2020–2026 A2Z Services. All Rights Reserved. Developed and managed by ZUCOL.