Business Decision Making Report: Murano Restaurant Expansion
VerifiedAdded on 2020/01/16
|18
|4466
|78
Report
AI Summary
This report examines the business decision-making process for Murano Restaurant, focusing on a potential expansion. It begins with the collection and analysis of primary and secondary data, including a survey to understand customer preferences. The report then delves into data analysis using measures of central tendency, dispersion, quartiles, percentiles, and correlation to assess sales and profit trends. Graphs and spreadsheets are used to visualize data and forecast future performance. The report also explores information processing tools relevant to the restaurant business and evaluates project duration using Gantt charts and critical path analysis. Finally, it applies financial tools like Net Present Value (NPV) and Internal Rate of Return (IRR) to assess the financial viability of the expansion. The report concludes with recommendations based on the findings.

BUSINESS DECISION MAKING
1
1
Paraphrase This Document
Need a fresh take? Get an instant paraphrase of this document with our AI Paraphraser
Table of Contents
INTRODUCTION ...............................................................................................................................4
TASK 1.................................................................................................................................................4
1.1Collection of Primary and Secondary Data................................................................................4
Primary Data ..............................................................................................................................4
Secondary Data ..........................................................................................................................4
1.2 Survey Methodology and Sampling frame ...............................................................................5
Survey Methodology...................................................................................................................5
Sampling Frame..........................................................................................................................5
1.3 Designing a Questionnaire.........................................................................................................5
2.1 Extracting valid conclusions......................................................................................................6
2.2 Summarisation of Information for decision making..................................................................9
2.3 Analysis of data using Measures of Dispersion.........................................................................9
2.4 Evaluation of Quartiles, Percentiles and coefficient correlation.............................................10
TASK 2...............................................................................................................................................11
3.1Preparation of Graphs and spreadsheets...................................................................................11
3.2 Trend Lines in Graph to forecast Profit and Sales...................................................................12
3.3 Business Presentation..............................................................................................................12
3.3 Formal Business Report...........................................................................................................12
TASK 3...............................................................................................................................................13
4.1 Application of Information Processing Tools..........................................................................13
Decision support System ..........................................................................................................13
Management Information system..............................................................................................13
Transaction Processing system..................................................................................................13
4.2 Evaluation of Project Duration................................................................................................13
Gantt Chat ................................................................................................................................14
Critical Path ..............................................................................................................................14
4.3 Financial Tools for Decision Making......................................................................................15
Net Present Value (NPV)..........................................................................................................15
Internal Rate Of Retrun (IRR) .................................................................................................16
CONCLUSION .................................................................................................................................16
REFERENCES...................................................................................................................................17
Index of Tables
Theme 1: Frequency of visiting the restaurants...................................................................................6
Theme 2: Spending Pattern of Individuals per meal............................................................................7
Theme 3: Opinion of individuals regarding prices charged by Murano...............................................8
Table 4: Sales and Profits figures for Murano Restaurant....................................................................9
Table 5: Calculation of Mean, Median and Standards error.................................................................9
Table 6: Calculation of various measures of dispersion.......................................................................9
Table 7: Calculation of Quartile.........................................................................................................10
Table 8: Calculation of Percentile......................................................................................................10
Table 9: Calculation of Coefficient correlation..................................................................................10
Table 10: Time duration for various activities....................................................................................13
2
Table 11: Calculation of Net Present Value........................................................................................15
Table 12: Calculation of Internal Rate of Return...............................................................................16
Illustration Index
Illustration 1: Bar graph depicting the customer choice of eating outside...........................................7
Illustration 2: Graph depicting spending Patterns................................................................................8
Illustration 3: Opinion about prices charged by Murano......................................................................8
Illustration 4: Graph showing Revenues and Profits for the Murano over 9 years............................11
Illustration 5: Trend Line Analysis of Revenues and Profits..............................................................12
Illustration 6: Evaluation of Project Duration....................................................................................14
Illustration 7: Calculation of Critical Path .........................................................................................14
3
⊘ This is a preview!⊘
Do you want full access?
Subscribe today to unlock all pages.
Trusted by 1+ million students worldwide
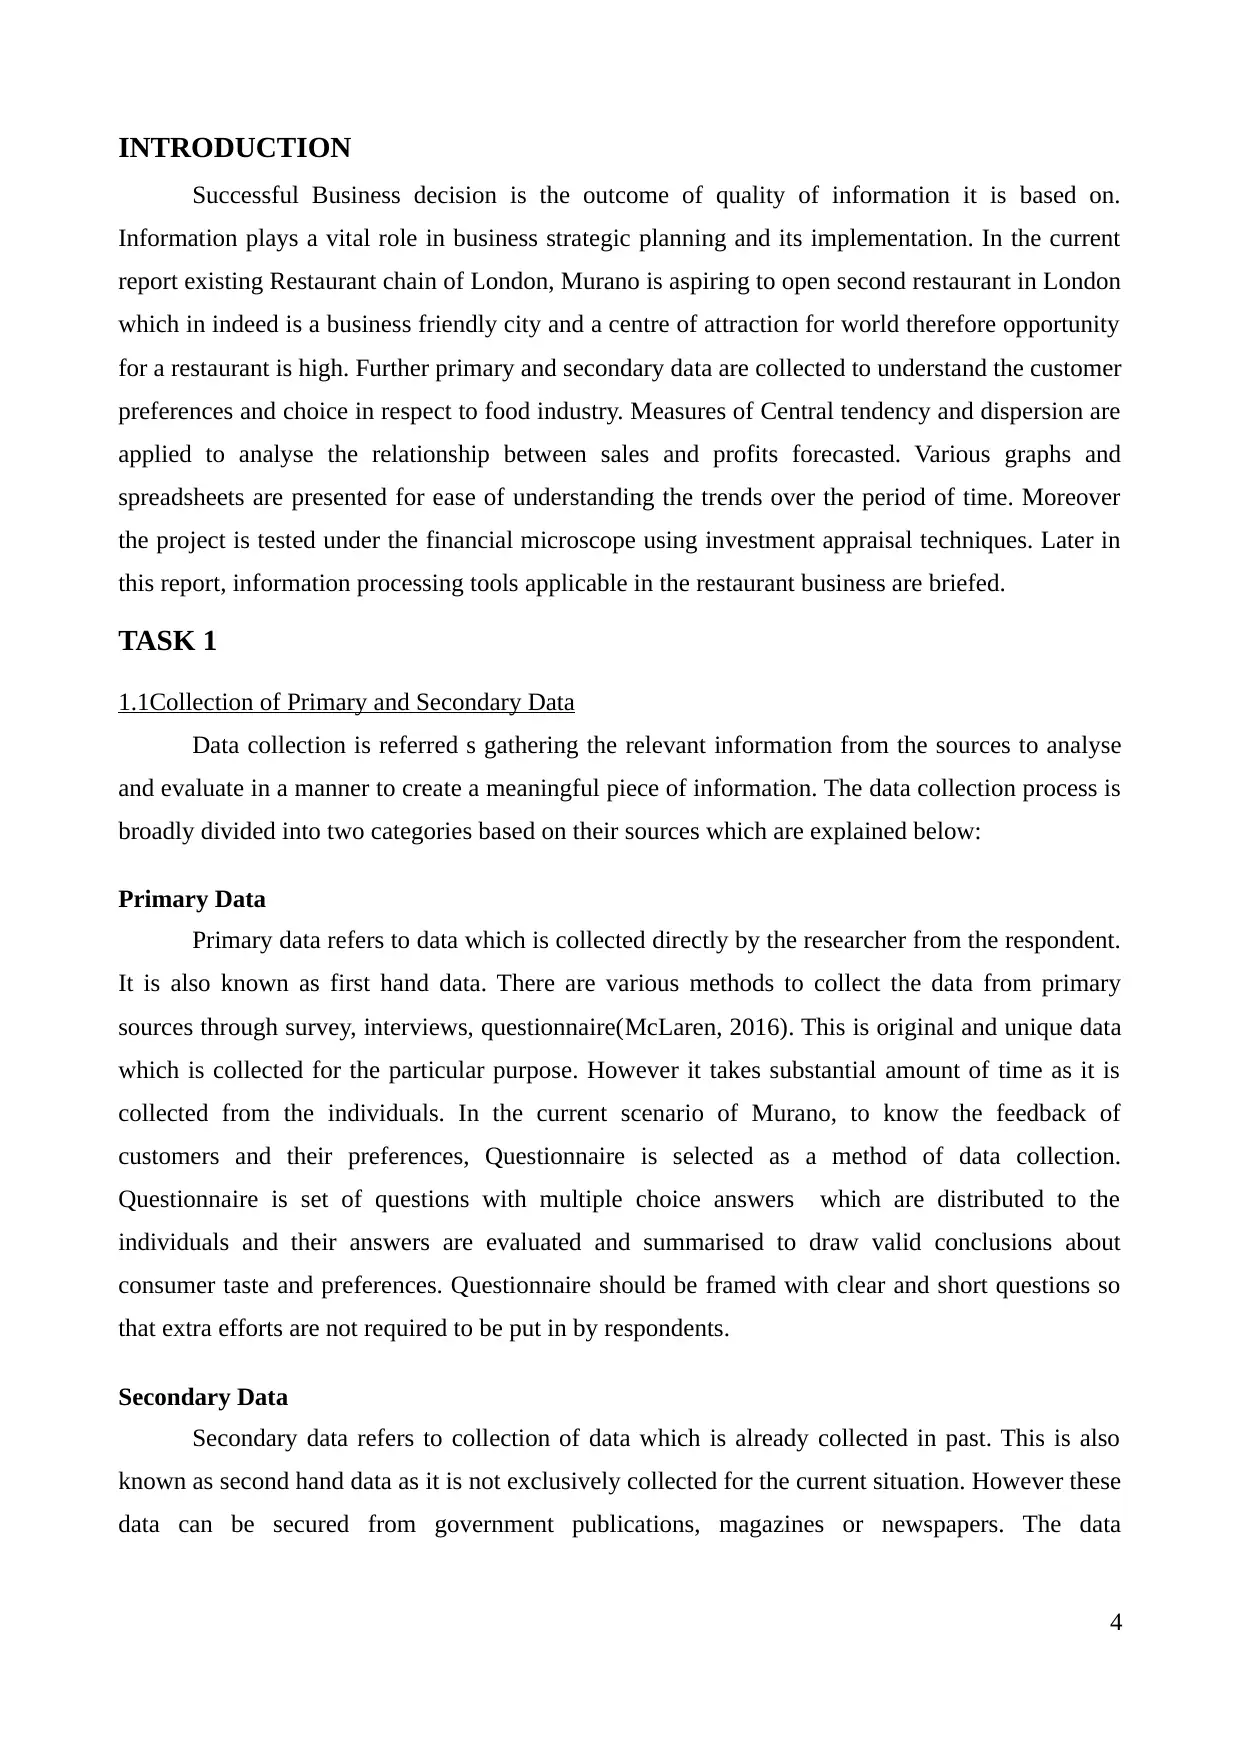
INTRODUCTION
Successful Business decision is the outcome of quality of information it is based on.
Information plays a vital role in business strategic planning and its implementation. In the current
report existing Restaurant chain of London, Murano is aspiring to open second restaurant in London
which in indeed is a business friendly city and a centre of attraction for world therefore opportunity
for a restaurant is high. Further primary and secondary data are collected to understand the customer
preferences and choice in respect to food industry. Measures of Central tendency and dispersion are
applied to analyse the relationship between sales and profits forecasted. Various graphs and
spreadsheets are presented for ease of understanding the trends over the period of time. Moreover
the project is tested under the financial microscope using investment appraisal techniques. Later in
this report, information processing tools applicable in the restaurant business are briefed.
TASK 1
1.1Collection of Primary and Secondary Data
Data collection is referred s gathering the relevant information from the sources to analyse
and evaluate in a manner to create a meaningful piece of information. The data collection process is
broadly divided into two categories based on their sources which are explained below:
Primary Data
Primary data refers to data which is collected directly by the researcher from the respondent.
It is also known as first hand data. There are various methods to collect the data from primary
sources through survey, interviews, questionnaire(McLaren, 2016). This is original and unique data
which is collected for the particular purpose. However it takes substantial amount of time as it is
collected from the individuals. In the current scenario of Murano, to know the feedback of
customers and their preferences, Questionnaire is selected as a method of data collection.
Questionnaire is set of questions with multiple choice answers which are distributed to the
individuals and their answers are evaluated and summarised to draw valid conclusions about
consumer taste and preferences. Questionnaire should be framed with clear and short questions so
that extra efforts are not required to be put in by respondents.
Secondary Data
Secondary data refers to collection of data which is already collected in past. This is also
known as second hand data as it is not exclusively collected for the current situation. However these
data can be secured from government publications, magazines or newspapers. The data
4
Paraphrase This Document
Need a fresh take? Get an instant paraphrase of this document with our AI Paraphraser
demonstrating statistics relating to number of customers preferring restaurants or frequency or
average income data would be helpful in analysing the eating habits and preferences of the citizens
in a particular locality and therefore targeting the customers for new restaurant(Ashraf and Khan,
2016).
1.2 Survey Methodology and Sampling frame
Survey Methodology
Survey methodology refers to procedures adopted for collection of information. Since it is
not a practical approach to collect information from each and every individual of the population
therefore simple random sampling is preferred(Rossi, Wright and Anderson, 2013). Although there
are several other methods for survey methodology such as stratified sampling or cluster sampling.
Simple random sampling refers to drawing a sample representing the whole population and study
and analysis is conducted on the same. Further, in random sampling every individual of the
population has chance of getting selected and therefore free from personal bias of the researcher.
Questionnaire will be sent to the individually selected randomly from the overall population.
Sampling Frame
Sampling frame refers to the individuals selected for the analysis and research to be
conducted(Levy and Lemeshow, 2013). In the present scenario of Murano, 20 individuals should be
selected on random basis. Questionnaire are to be sent online due to massive use of internet and to
save the postal cost. Moreover online sending is more quick and cheap and follow up is very easy
and fast. Customers and non customers of Murano can be selected randomly for the data collection
and various tools are to be applied on collected information to create a meaningful information and
perform the necessary modifications to the planned new restaurant.
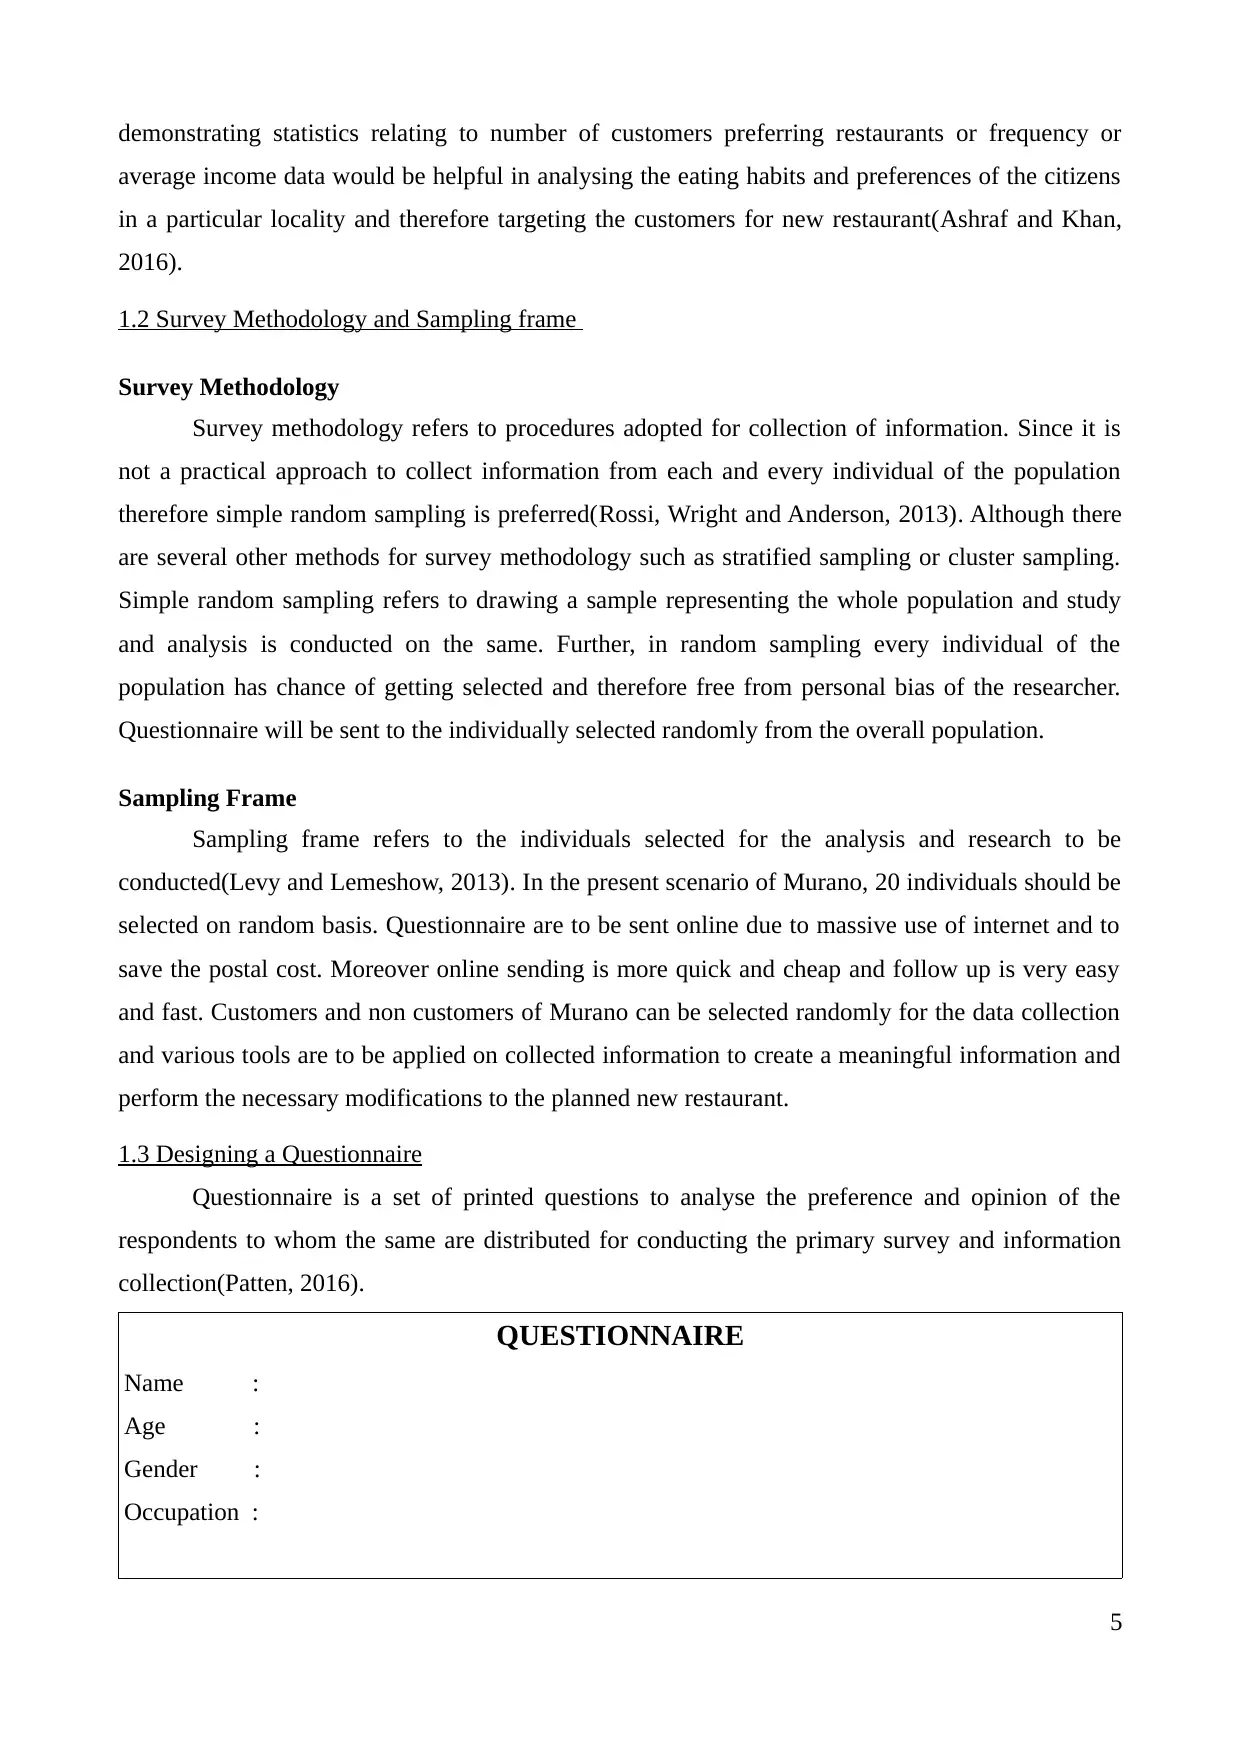
1.3 Designing a Questionnaire
Questionnaire is a set of printed questions to analyse the preference and opinion of the
respondents to whom the same are distributed for conducting the primary survey and information
collection(Patten, 2016).
QUESTIONNAIRE
Name :
Age :
Gender :
Occupation :
5
average income data would be helpful in analysing the eating habits and preferences of the citizens
in a particular locality and therefore targeting the customers for new restaurant(Ashraf and Khan,
2016).
1.2 Survey Methodology and Sampling frame
Survey Methodology
Survey methodology refers to procedures adopted for collection of information. Since it is
not a practical approach to collect information from each and every individual of the population
therefore simple random sampling is preferred(Rossi, Wright and Anderson, 2013). Although there
are several other methods for survey methodology such as stratified sampling or cluster sampling.
Simple random sampling refers to drawing a sample representing the whole population and study
and analysis is conducted on the same. Further, in random sampling every individual of the
population has chance of getting selected and therefore free from personal bias of the researcher.
Questionnaire will be sent to the individually selected randomly from the overall population.
Sampling Frame
Sampling frame refers to the individuals selected for the analysis and research to be
conducted(Levy and Lemeshow, 2013). In the present scenario of Murano, 20 individuals should be
selected on random basis. Questionnaire are to be sent online due to massive use of internet and to
save the postal cost. Moreover online sending is more quick and cheap and follow up is very easy
and fast. Customers and non customers of Murano can be selected randomly for the data collection
and various tools are to be applied on collected information to create a meaningful information and
perform the necessary modifications to the planned new restaurant.
1.3 Designing a Questionnaire
Questionnaire is a set of printed questions to analyse the preference and opinion of the
respondents to whom the same are distributed for conducting the primary survey and information
collection(Patten, 2016).
QUESTIONNAIRE
Name :
Age :
Gender :
Occupation :
5
Q1. How often do yo visit a restaurant for your meals?
a) Daily b) Weekly c) Monthly d) Quarterly
Q2. Have you visited Murano?
a) Yes b) No c) Regular Visitor
Q3. How do you like the services provided?
a) Satisfied b) Dissatisfied c) Needs improvement
Q4. How do you like to rate the quality of food?
a) Hygienic b) Different c) Tasty
Q5. What is your preference regarding location of food joints?
a) Near by b) Far c) Adjoining locality
Q6.How frequently do you prefer home delivery of your meals?
a) Rarely b) Often
Q7. How do you like the ambience and music of Murano?
a) Excellent b) Reasonable c) Poor
Q7. How much do you prefer spending on food joints per meal?
a) below £50 b) £70-£150 c) More than £150
Q8. How do you rate the prices of Murano?
a) Expensive b) Reasonable c) very cheap
Q9. Would you recommend Murano to your friends and relatives?
a) Yes b) No
Q10. What annual income range do you fall ?
a) less than £20,000 b) £20000-£50,000 c) more than £ 50,000
Q11. Please provide suggestions for improvement in Murano-
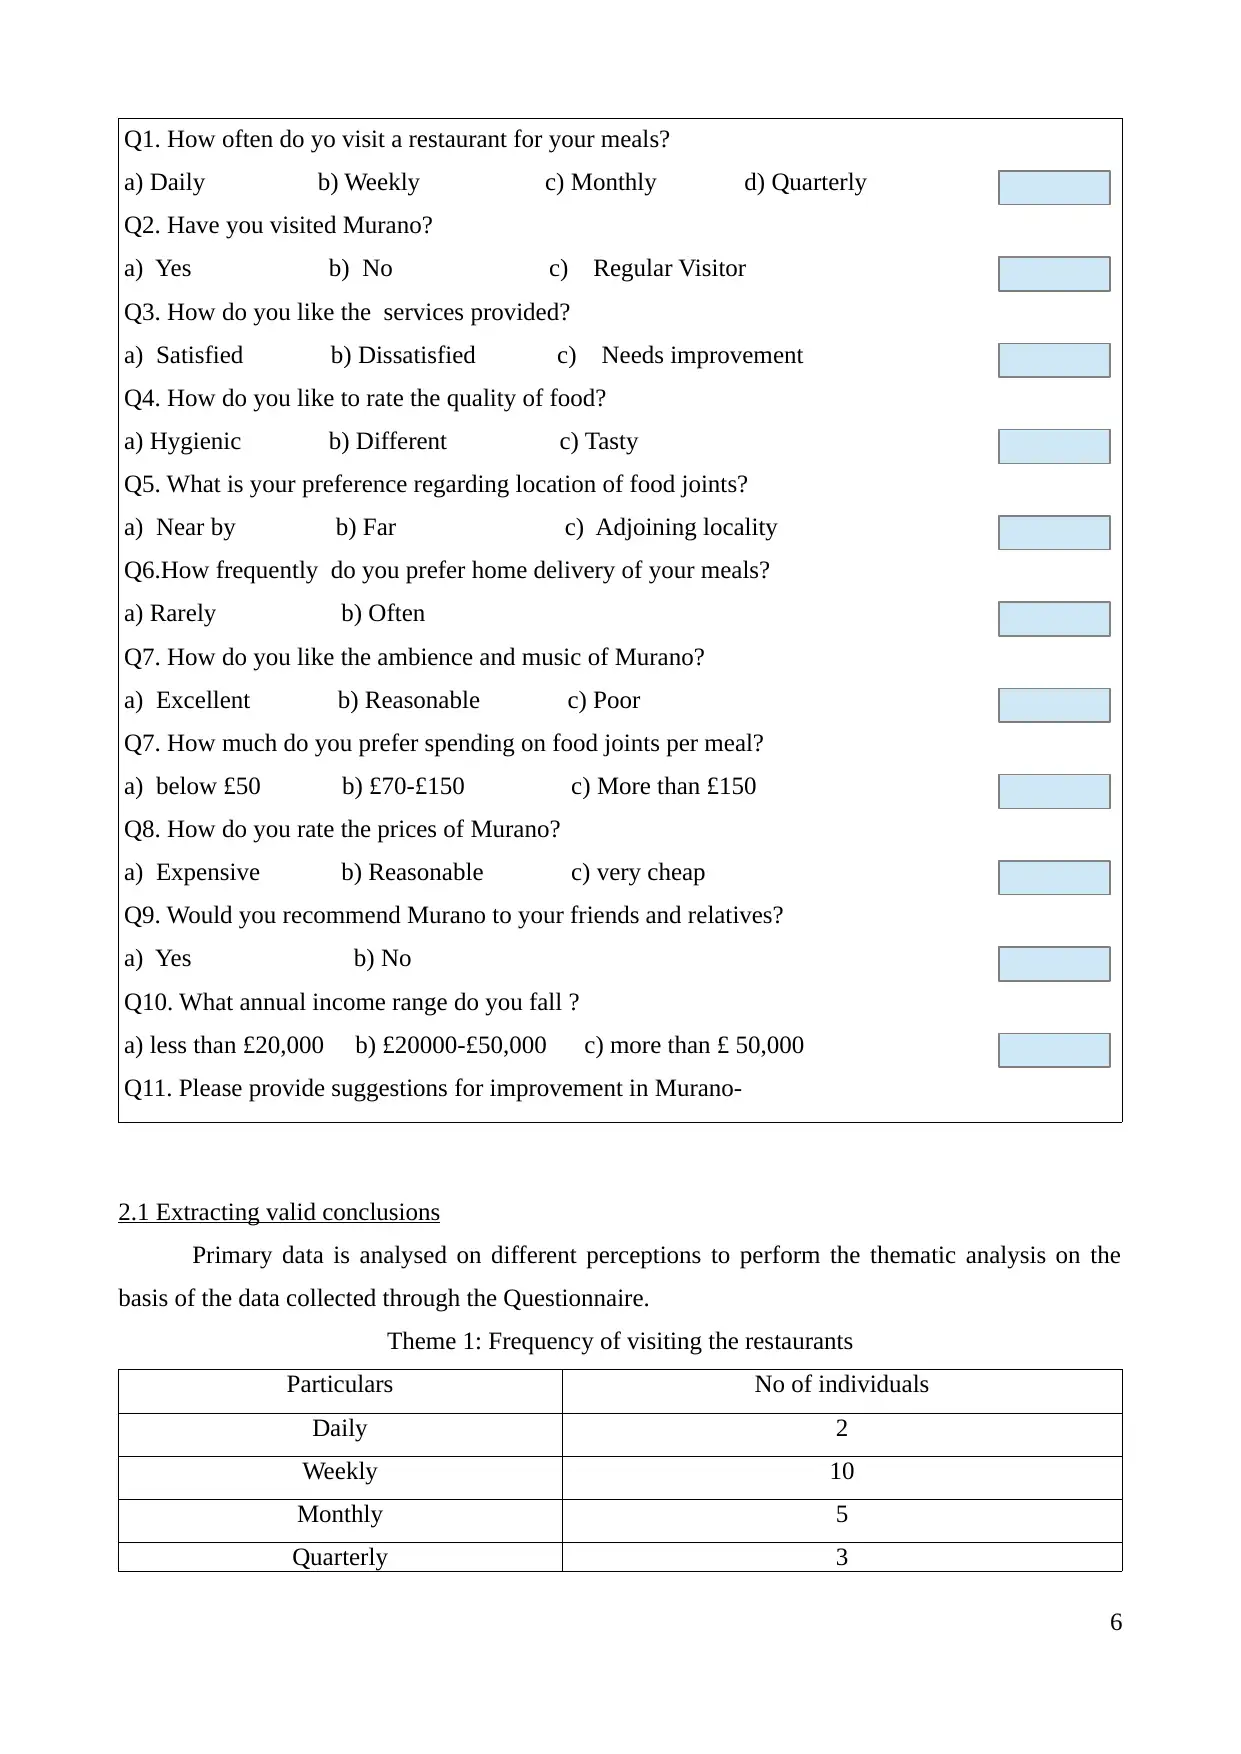
2.1 Extracting valid conclusions
Primary data is analysed on different perceptions to perform the thematic analysis on the
basis of the data collected through the Questionnaire.
Theme 1: Frequency of visiting the restaurants
Particulars No of individuals
Daily 2
Weekly 10
Monthly 5
Quarterly 3
6
a) Daily b) Weekly c) Monthly d) Quarterly
Q2. Have you visited Murano?
a) Yes b) No c) Regular Visitor
Q3. How do you like the services provided?
a) Satisfied b) Dissatisfied c) Needs improvement
Q4. How do you like to rate the quality of food?
a) Hygienic b) Different c) Tasty
Q5. What is your preference regarding location of food joints?
a) Near by b) Far c) Adjoining locality
Q6.How frequently do you prefer home delivery of your meals?
a) Rarely b) Often
Q7. How do you like the ambience and music of Murano?
a) Excellent b) Reasonable c) Poor
Q7. How much do you prefer spending on food joints per meal?
a) below £50 b) £70-£150 c) More than £150
Q8. How do you rate the prices of Murano?
a) Expensive b) Reasonable c) very cheap
Q9. Would you recommend Murano to your friends and relatives?
a) Yes b) No
Q10. What annual income range do you fall ?
a) less than £20,000 b) £20000-£50,000 c) more than £ 50,000
Q11. Please provide suggestions for improvement in Murano-
2.1 Extracting valid conclusions
Primary data is analysed on different perceptions to perform the thematic analysis on the
basis of the data collected through the Questionnaire.
Theme 1: Frequency of visiting the restaurants
Particulars No of individuals
Daily 2
Weekly 10
Monthly 5
Quarterly 3
6
⊘ This is a preview!⊘
Do you want full access?
Subscribe today to unlock all pages.
Trusted by 1+ million students worldwide
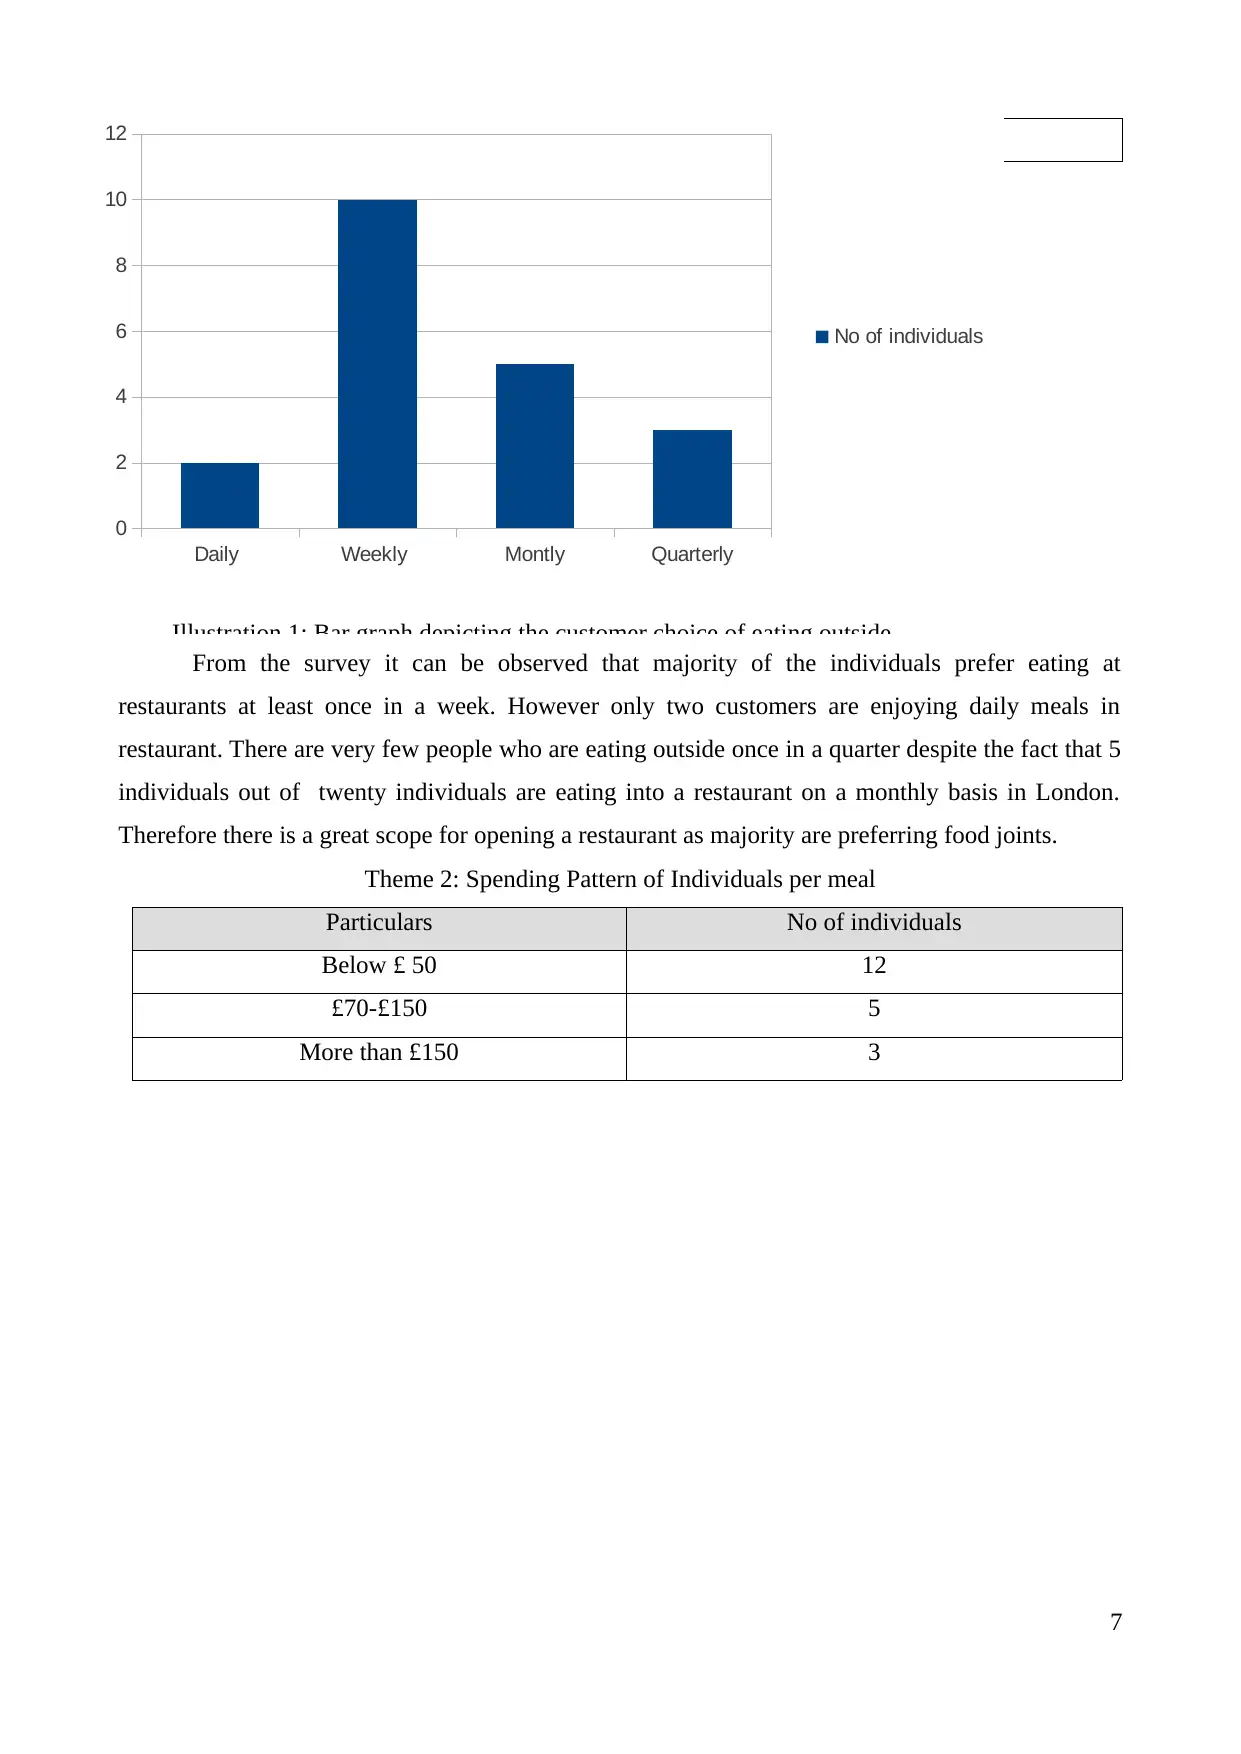
From the survey it can be observed that majority of the individuals prefer eating at
restaurants at least once in a week. However only two customers are enjoying daily meals in
restaurant. There are very few people who are eating outside once in a quarter despite the fact that 5
individuals out of twenty individuals are eating into a restaurant on a monthly basis in London.
Therefore there is a great scope for opening a restaurant as majority are preferring food joints.
Theme 2: Spending Pattern of Individuals per meal
Particulars No of individuals
Below £ 50 12
£70-£150 5
More than £150 3
7
Daily Weekly Montly Quarterly
0
2
4
6
8
10
12
No of individuals
Illustration 1: Bar graph depicting the customer choice of eating outside
Paraphrase This Document
Need a fresh take? Get an instant paraphrase of this document with our AI Paraphraser
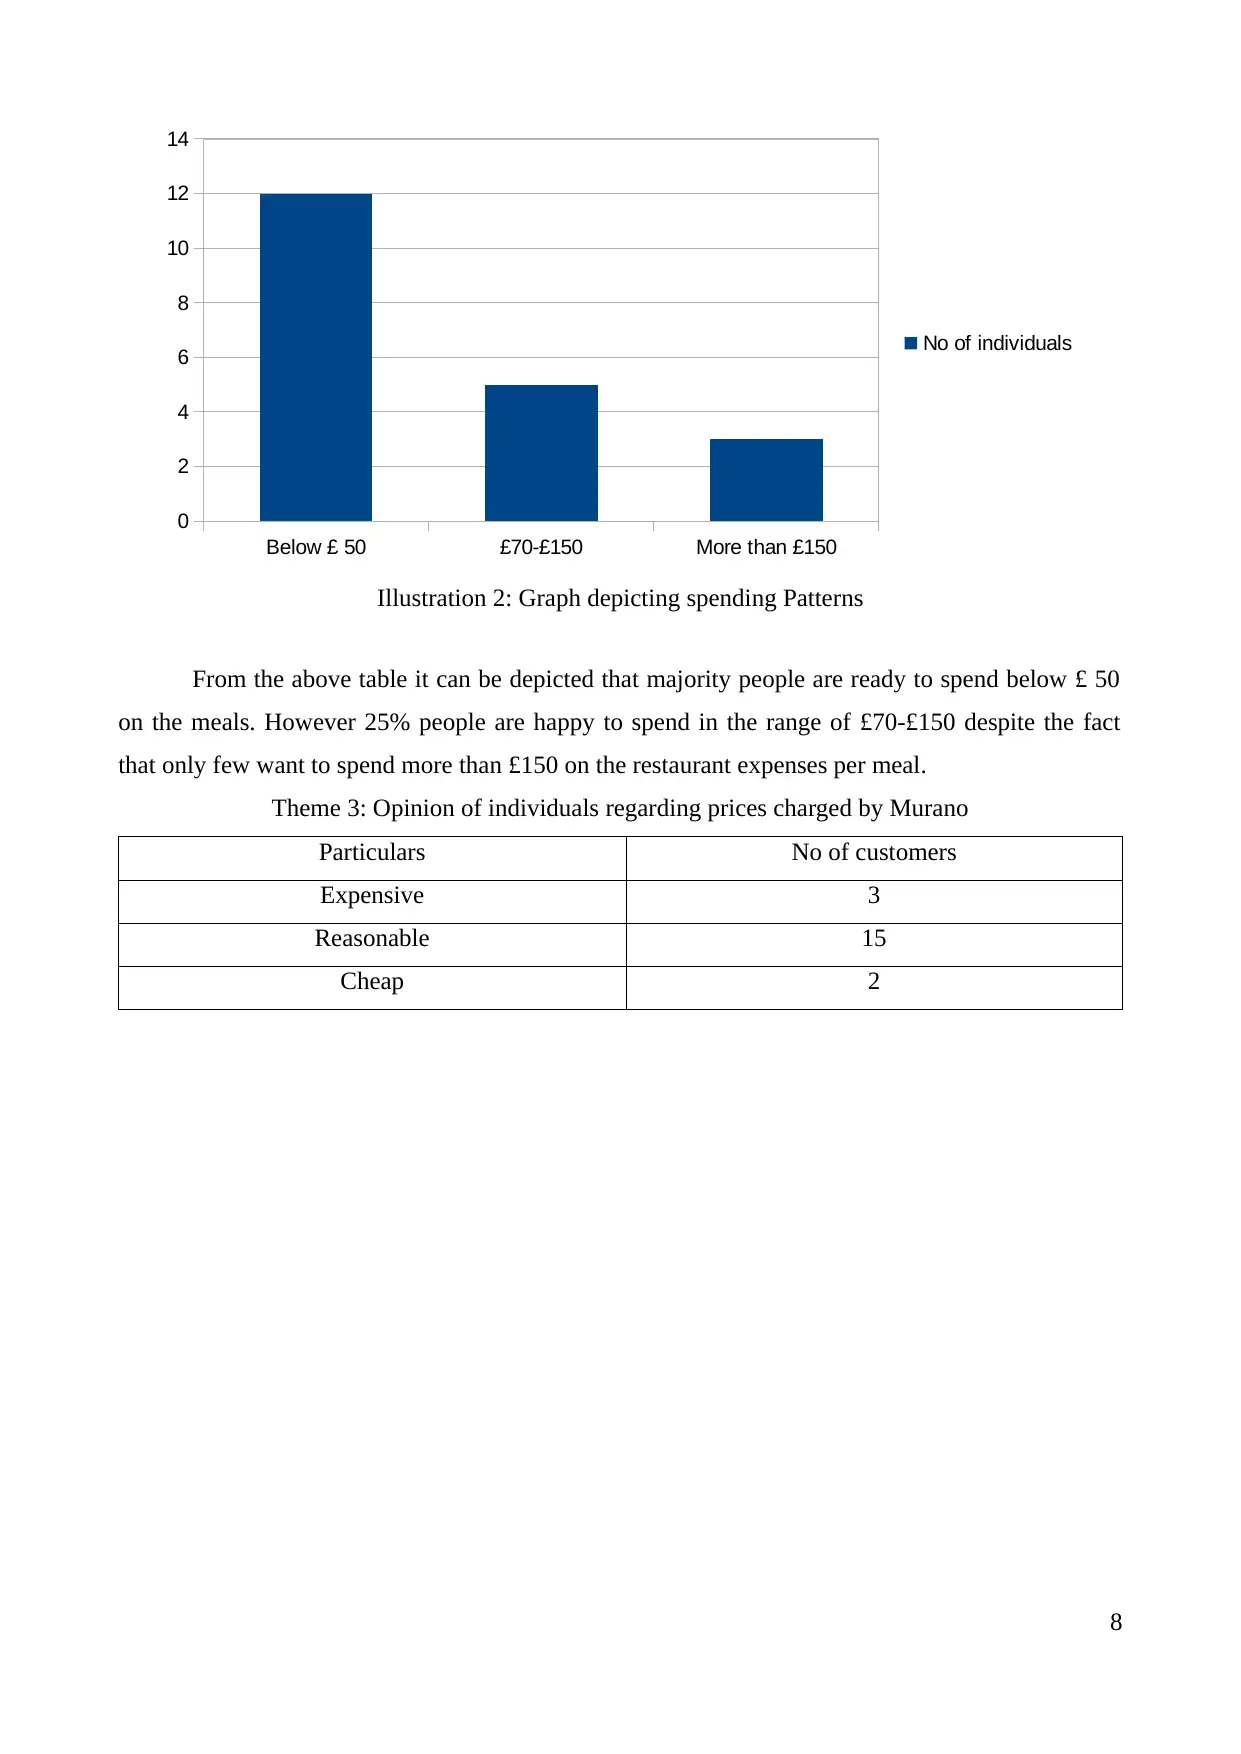
From the above table it can be depicted that majority people are ready to spend below £ 50
on the meals. However 25% people are happy to spend in the range of £70-£150 despite the fact
that only few want to spend more than £150 on the restaurant expenses per meal.
Theme 3: Opinion of individuals regarding prices charged by Murano
Particulars No of customers
Expensive 3
Reasonable 15
Cheap 2
8
Below £ 50 £70-£150 More than £150
0
2
4
6
8
10
12
14
No of individuals
Illustration 2: Graph depicting spending Patterns
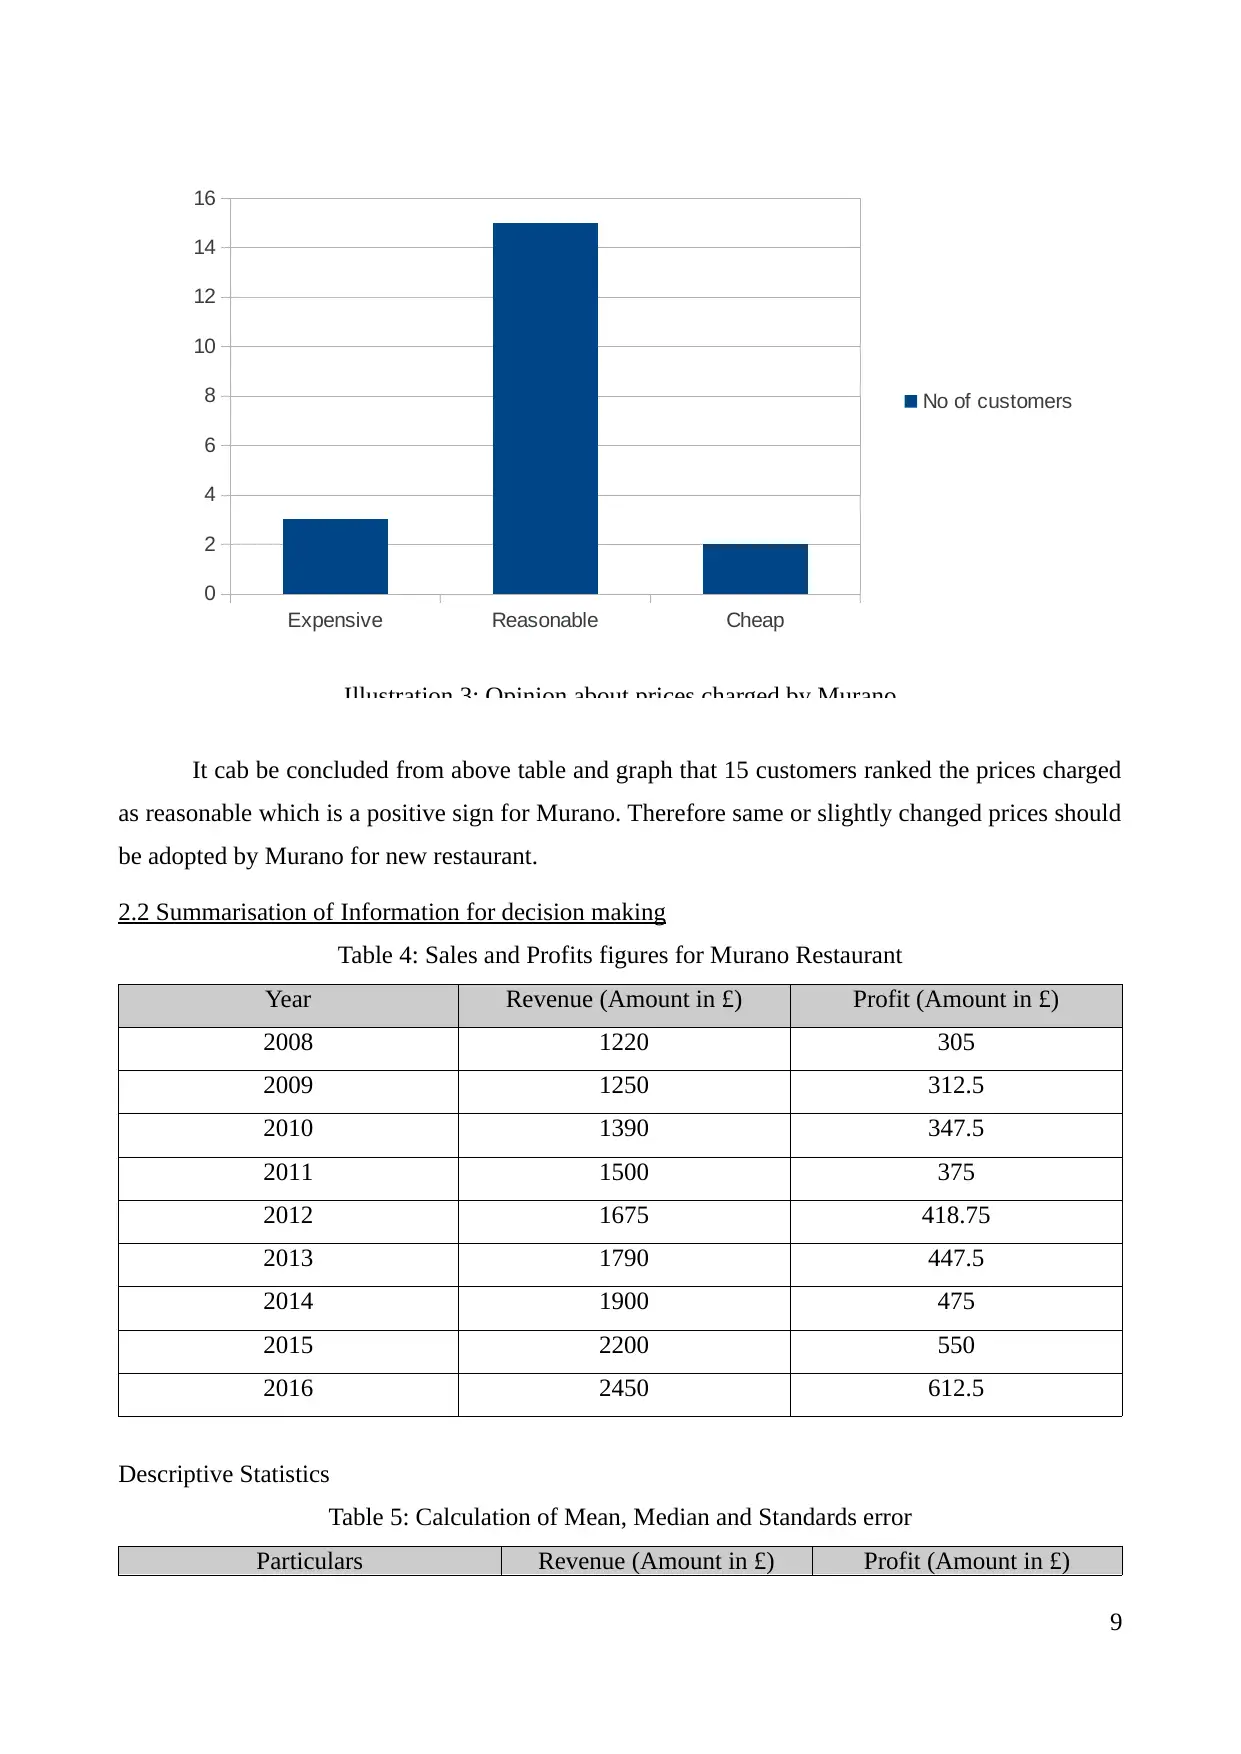
It cab be concluded from above table and graph that 15 customers ranked the prices charged
as reasonable which is a positive sign for Murano. Therefore same or slightly changed prices should
be adopted by Murano for new restaurant.
2.2 Summarisation of Information for decision making
Table 4: Sales and Profits figures for Murano Restaurant
Year Revenue (Amount in £) Profit (Amount in £)
2008 1220 305
2009 1250 312.5
2010 1390 347.5
2011 1500 375
2012 1675 418.75
2013 1790 447.5
2014 1900 475
2015 2200 550
2016 2450 612.5
Descriptive Statistics
Table 5: Calculation of Mean, Median and Standards error
Particulars Revenue (Amount in £) Profit (Amount in £)
9
Expensive Reasonable Cheap
0
2
4
6
8
10
12
14
16
No of customers
Illustration 3: Opinion about prices charged by Murano
⊘ This is a preview!⊘
Do you want full access?
Subscribe today to unlock all pages.
Trusted by 1+ million students worldwide
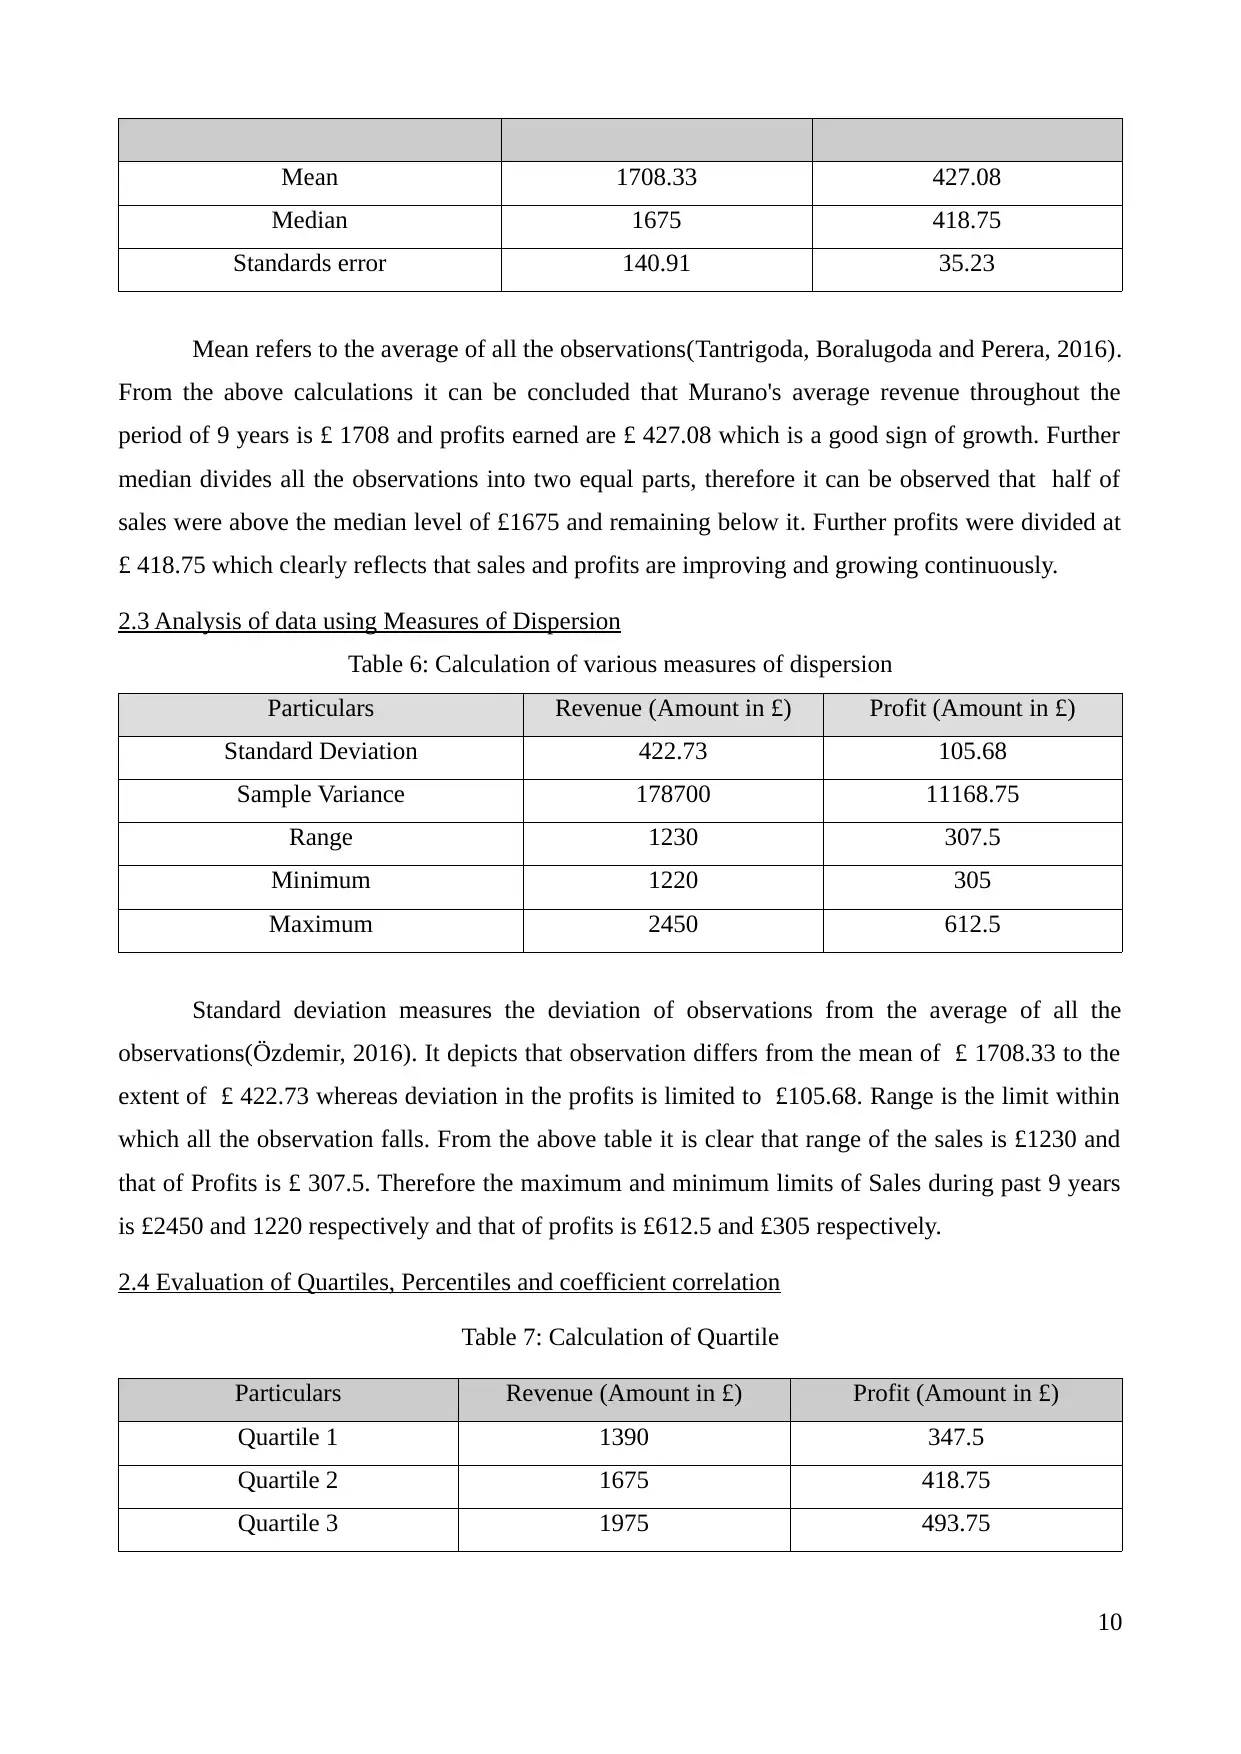
Mean 1708.33 427.08
Median 1675 418.75
Standards error 140.91 35.23
Mean refers to the average of all the observations(Tantrigoda, Boralugoda and Perera, 2016).
From the above calculations it can be concluded that Murano's average revenue throughout the
period of 9 years is £ 1708 and profits earned are £ 427.08 which is a good sign of growth. Further
median divides all the observations into two equal parts, therefore it can be observed that half of
sales were above the median level of £1675 and remaining below it. Further profits were divided at
£ 418.75 which clearly reflects that sales and profits are improving and growing continuously.
2.3 Analysis of data using Measures of Dispersion
Table 6: Calculation of various measures of dispersion
Particulars Revenue (Amount in £) Profit (Amount in £)
Standard Deviation 422.73 105.68
Sample Variance 178700 11168.75
Range 1230 307.5
Minimum 1220 305
Maximum 2450 612.5
Standard deviation measures the deviation of observations from the average of all the
observations(Özdemir, 2016). It depicts that observation differs from the mean of £ 1708.33 to the
extent of £ 422.73 whereas deviation in the profits is limited to £105.68. Range is the limit within
which all the observation falls. From the above table it is clear that range of the sales is £1230 and
that of Profits is £ 307.5. Therefore the maximum and minimum limits of Sales during past 9 years
is £2450 and 1220 respectively and that of profits is £612.5 and £305 respectively.
2.4 Evaluation of Quartiles, Percentiles and coefficient correlation
Table 7: Calculation of Quartile
Particulars Revenue (Amount in £) Profit (Amount in £)
Quartile 1 1390 347.5
Quartile 2 1675 418.75
Quartile 3 1975 493.75
10
Paraphrase This Document
Need a fresh take? Get an instant paraphrase of this document with our AI Paraphraser
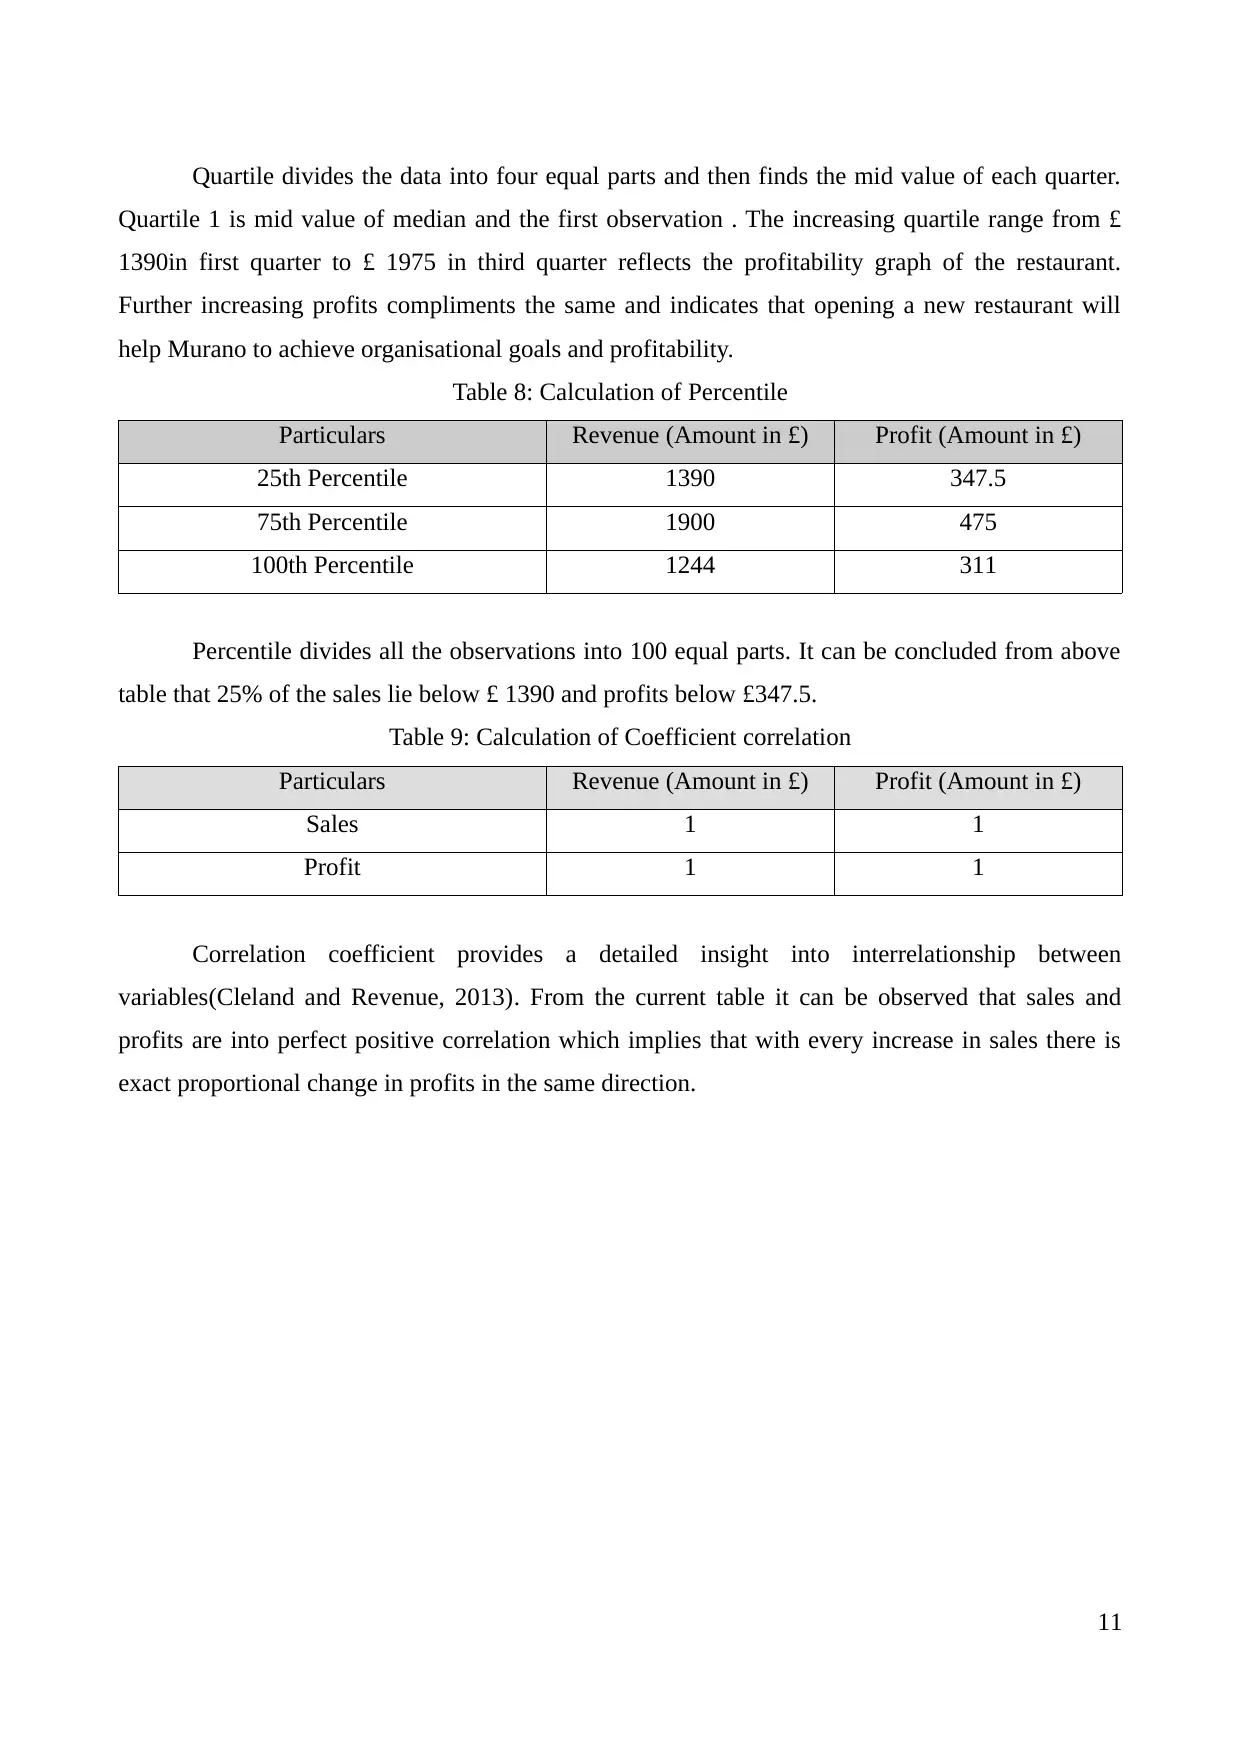
Quartile divides the data into four equal parts and then finds the mid value of each quarter.
Quartile 1 is mid value of median and the first observation . The increasing quartile range from £
1390in first quarter to £ 1975 in third quarter reflects the profitability graph of the restaurant.
Further increasing profits compliments the same and indicates that opening a new restaurant will
help Murano to achieve organisational goals and profitability.
Table 8: Calculation of Percentile
Particulars Revenue (Amount in £) Profit (Amount in £)
25th Percentile 1390 347.5
75th Percentile 1900 475
100th Percentile 1244 311
Percentile divides all the observations into 100 equal parts. It can be concluded from above
table that 25% of the sales lie below £ 1390 and profits below £347.5.
Table 9: Calculation of Coefficient correlation
Particulars Revenue (Amount in £) Profit (Amount in £)
Sales 1 1
Profit 1 1
Correlation coefficient provides a detailed insight into interrelationship between
variables(Cleland and Revenue, 2013). From the current table it can be observed that sales and
profits are into perfect positive correlation which implies that with every increase in sales there is
exact proportional change in profits in the same direction.
11
TASK 2
3.1Preparation of Graphs and spreadsheets
From the above graph it can be easily identified that revenues and profits are growing
continuously over the years. Further profits are also increasing wit the revenue increasing. This is a
positive indication towards the customer relationship and people's preference to restaurants. This
widens the scope for opening a new restaurant to achieve overall organisational profits.
3.2 Trend Lines in Graph to forecast Profit and Sales
12
2008 2009 2010 2011 2012 2013 2014 2015 2016
0
500
1000
1500
2000
2500
3000
Revenues
Profit
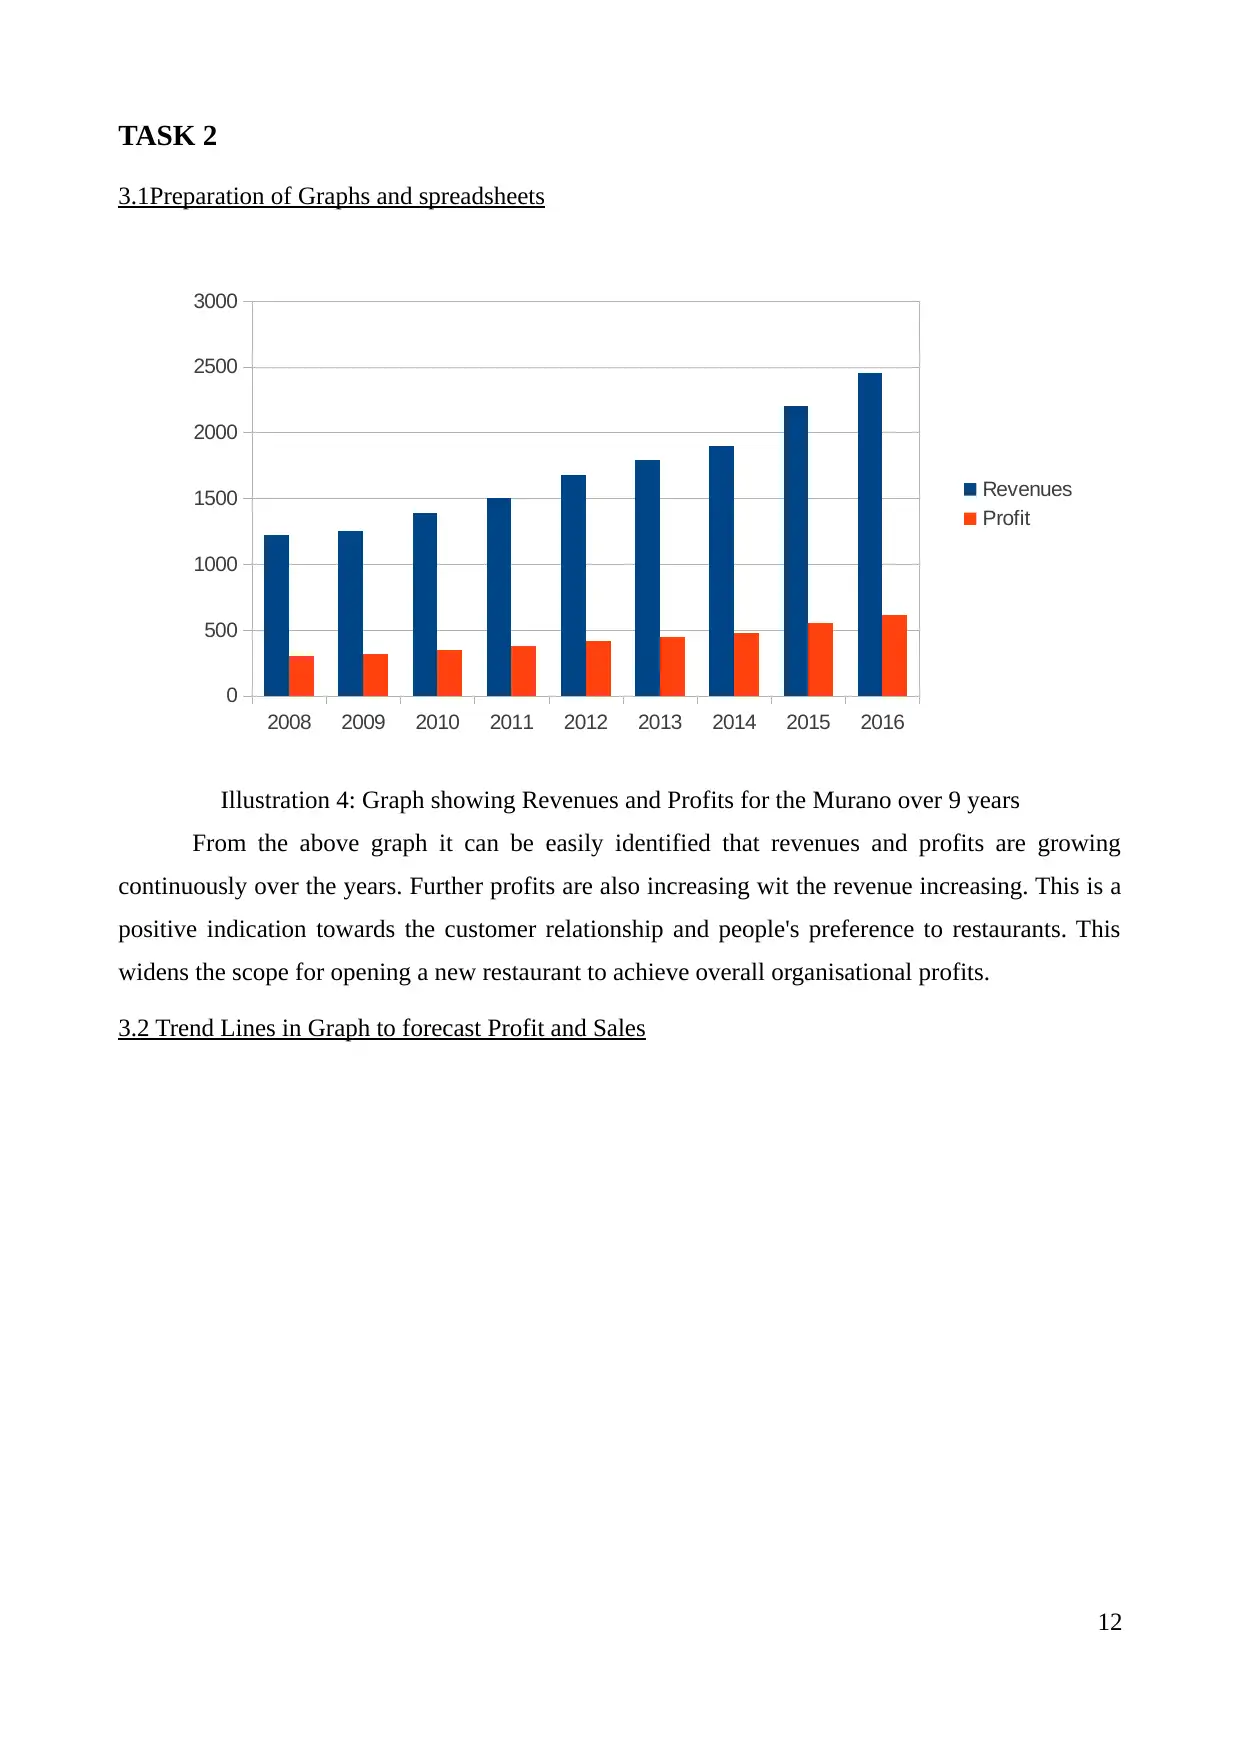
Illustration 4: Graph showing Revenues and Profits for the Murano over 9 years
3.1Preparation of Graphs and spreadsheets
From the above graph it can be easily identified that revenues and profits are growing
continuously over the years. Further profits are also increasing wit the revenue increasing. This is a
positive indication towards the customer relationship and people's preference to restaurants. This
widens the scope for opening a new restaurant to achieve overall organisational profits.
3.2 Trend Lines in Graph to forecast Profit and Sales
12
2008 2009 2010 2011 2012 2013 2014 2015 2016
0
500
1000
1500
2000
2500
3000
Revenues
Profit
Illustration 4: Graph showing Revenues and Profits for the Murano over 9 years
⊘ This is a preview!⊘
Do you want full access?
Subscribe today to unlock all pages.
Trusted by 1+ million students worldwide
1 out of 18
Related Documents


Your All-in-One AI-Powered Toolkit for Academic Success.
+13062052269
info@desklib.com
Available 24*7 on WhatsApp / Email
![[object Object]](/_next/static/media/star-bottom.7253800d.svg)
Unlock your academic potential
Copyright © 2020–2026 A2Z Services. All Rights Reserved. Developed and managed by ZUCOL.