Analyzing Murano Restaurant: Business Decision Making Report
VerifiedAdded on 2020/07/22
|37
|5066
|41
Report
AI Summary
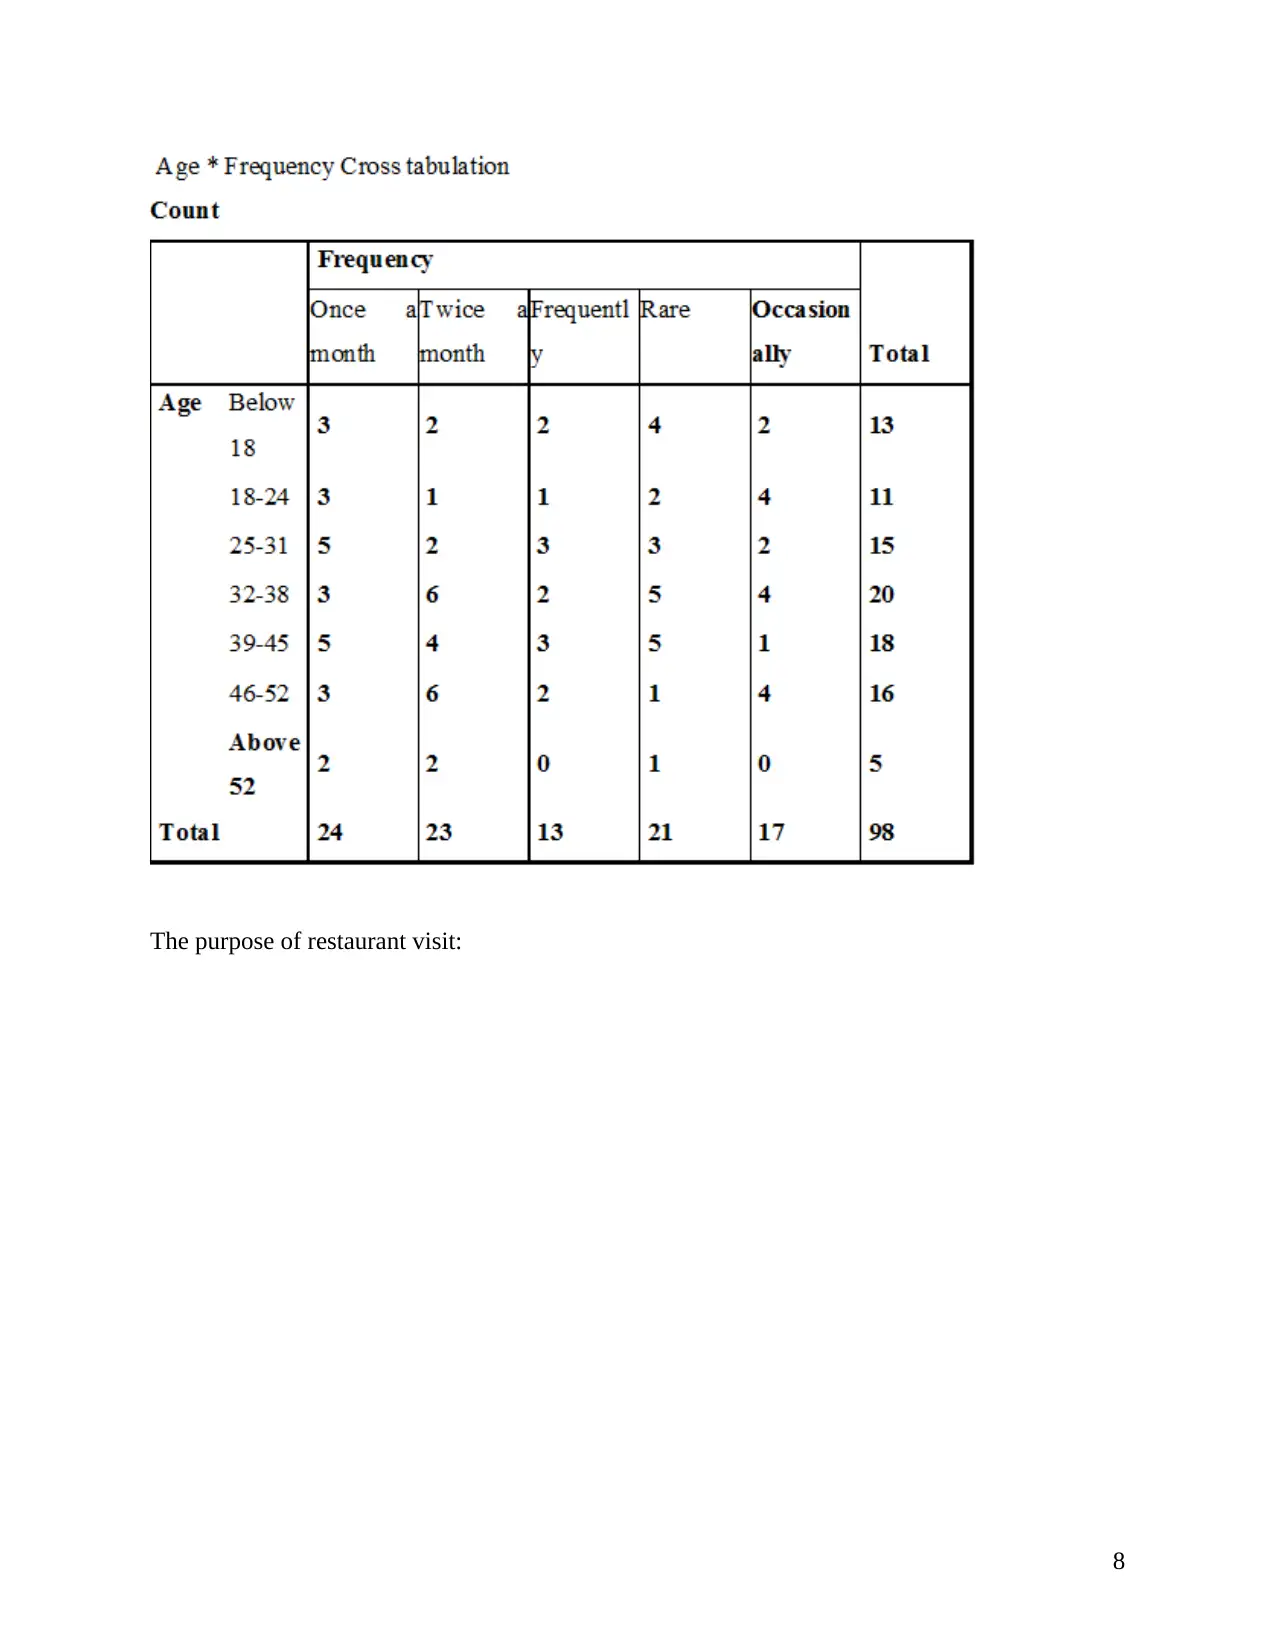
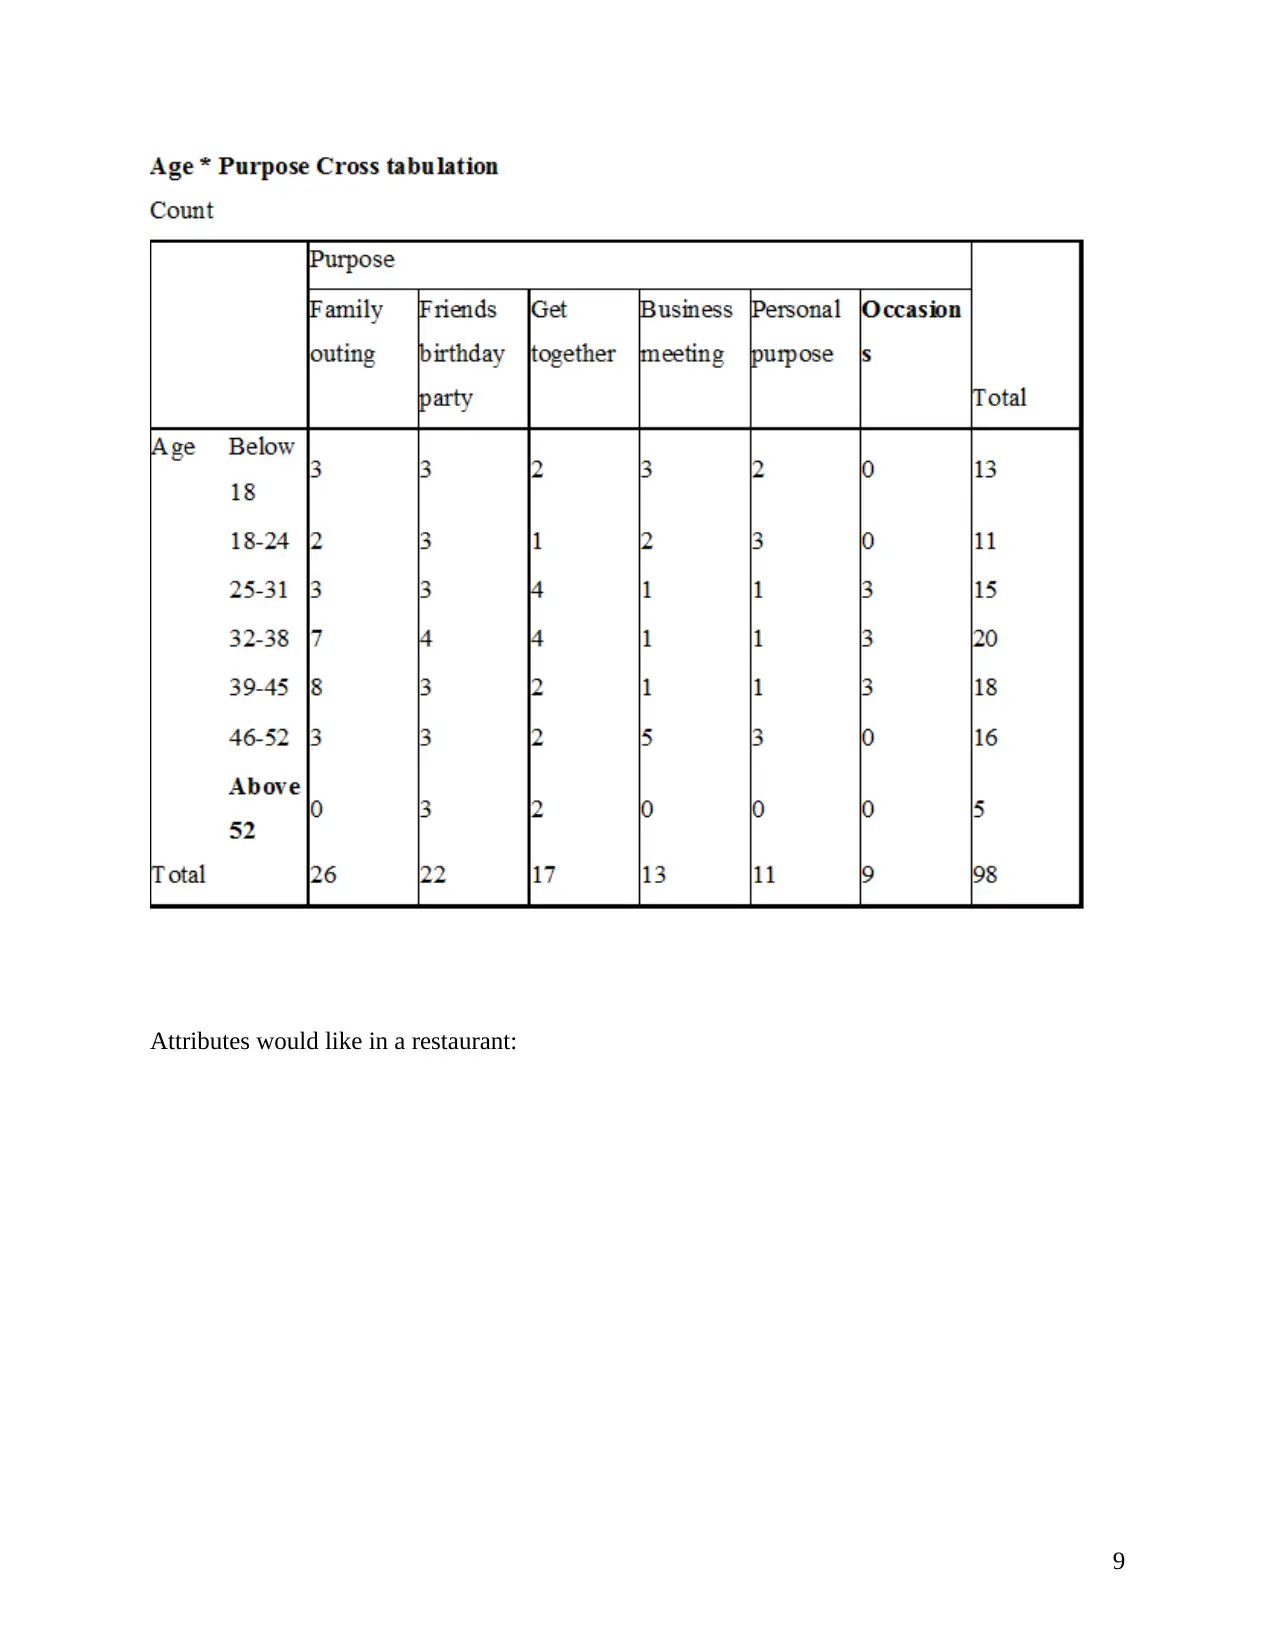
This report analyzes the business decision-making process for Murano Restaurant. It begins with an introduction outlining the importance of data collection and analysis for informed decision-making, emphasizing the need to understand customer preferences and financial viability. Task 1 details the data collection plan, explaining primary and secondary data collection methods, survey methodology, and the questionnaire used. Task 2 focuses on summarizing collected data through mean, median, and mode calculations, providing insights into customer demographics, restaurant visit frequency, and preferences. The report includes a central tendency analysis, graphical presentations, and forecasting using trend line methods. Task 4 covers information processing tools, project planning, and investment appraisal techniques such as NPV and IRR. The conclusion summarizes the findings and emphasizes the importance of data-driven decisions for business success and wealth expansion.

BUSINESS DECISION
MAKING
MAKING
Paraphrase This Document
Need a fresh take? Get an instant paraphrase of this document with our AI Paraphraser

TABLE OF CONTENTS
INTRODUCTION...........................................................................................................................1
TASK 1............................................................................................................................................1
1.1 Data collection plan...............................................................................................................1
1.2 Survey methodology and sampling framework....................................................................1
1.3 Questionnaire........................................................................................................................2
TASK 2............................................................................................................................................5
2.1 Summarizing collected data..................................................................................................5
2.2 Central tendency and analysis.............................................................................................17
2.3 Dispersion and its derivation...............................................................................................20
2.4 Quartile and Correlation coefficient....................................................................................21
TASK 2..........................................................................................................................................25
3.1 Graphical presentation of collected data.............................................................................25
3.2 Trend line method for forecasting on business operations..................................................26
3.3 PowerPoint presentation......................................................................................................27
3.4 Business report....................................................................................................................27
TASK 4..........................................................................................................................................29
4.1 Information processing tools...............................................................................................29
4.2 Project plan..........................................................................................................................29
4.3 Investment appraisal techniques.........................................................................................31
CONCLUSION..............................................................................................................................33
REFERENCE.................................................................................................................................34

ILLUSTRATION INDEX
Illustration 1: Using formula to evaluate mean................................................................................5
Illustration 2: Used for calculating median of collected data..........................................................6
Illustration 3: Project plan activities..............................................................................................30
Illustration 4: Gantt chart ..............................................................................................................30
Illustration 5: Network diagram as project plan............................................................................31
Illustration 6: Project plan..............................................................................................................31
Illustration 7: NPV.........................................................................................................................32
Illustration 8: IRR..........................................................................................................................32
⊘ This is a preview!⊘
Do you want full access?
Subscribe today to unlock all pages.

Trusted by 1+ million students worldwide

INTRODUCTION
For the accomplishment of the business, different choices and arrangements should be
executed precisely. Notwithstanding, gathering of information and coming into a point in the
wake of breaking down it very troublesome, it requires solid utilization of psyche and diligent
work. For this situation, concentrate earlier report will uncover the sharp understanding with
respect to the venture choice made for the concerned eatery. Aside from this, it will likewise
comprehend the present example that clients are taking after including their inclination. While at
the last stride, the venture getting ready for the reasonability of future speculations and
manageability of riches expansion is dissected utilizing different monetary instruments.
TASK 1
1.1 Data collection plan
Data are collected using different methods at primary and secondary level by which
actual position of organisation is identified.
Primary data collection: Information are gathered through conducting survey, face to
face interview, door to door asking questions and so on (Amaya and et.al., 2015). Therefore,
actual position of entity can be gained by which different ideas can generate for further
implementations and business operations effectively.
Secondary data collection: information are collected using ready and prepared tools
such as; articles mentioned in newspapers, books and journal etc. As well, using social
networking sites for decision making on further business activities. Therefore, data collection
methods are used for analysing position of Murano and its operations.
In this project, for analysing performance of Murano, researcher is to use primary data
collection method through conducting survey and generating ideas for further activities. For this
purpose, researcher selects respondents randomly for analysing their views on services provided
by the restaurant. However, actual position of entity can be identified on which ideas are
generated regarding its expansion and increasing quality services. Therefore, data are collected
through conducting survey and collecting respondents' views on services efficiently.
1.2 Survey methodology and sampling framework
Survey: It is a process to identify respondents' views on services of Murano in different
ways. In this process, researcher selects respondents in samples such as; systematic, simple
1
Paraphrase This Document
Need a fresh take? Get an instant paraphrase of this document with our AI Paraphraser

random sampling and so on. Therefore, for analysing customers' opinion on its services,
researcher is to use random sampling through selecting respondents randomly.
Sampling: Random sampling method is used for survey and collecting data regarding
food and accommodation services of organisation. In this process, researcher prepares
questionnaire of questions related with its services and different ideas are generated for
improving its services and enhancing efficiency on large scale. Hence, survey is to conducted for
identifying actual position of organisation and increasing its food and accommodation facilities.
For decision making regrading Murano restaurant, researcher is to conduct survey with
20 people to identify its market demand. In this regard, he prepares questionnaire consists of
questions related to food services and accommodation of the entity. Therefore, different ideas are
generated for better quality services and satisfying its customers at maximum level.
As indicated by the previously mentioned review, the essential research holds the most
elevated inclination over online review since it takes out the biasses in applying testing
technique. Arbitrary testing accomplished for social affair reaction from the clients went by
Murano as it requires to be done in a substantial scale. Be that as it may, the polls are
appropriated in the field inside 3 days in regard to different administrations offered by Murano.
1.3 Questionnaire
Q1. Please choose your age group
Below 18
18-24
25-31
32-38
39-45
46-52
Above 52
Q2. Tick your current occupation
2

Business person
Service holder
Retired
Students
Professional
Q3 what is the frequency of your restaurant visit?
Once a month
Twice a month
Frequently
Rare
Occasionally
Q4. What is the purpose you come for?
Family outing
Friends birthday party
Get together
Business meeting
Personal purpose
Occasions
Q5. What are the attributes you would like in a restaurant?
Food quality
Price
Product variety
Ambience
Service quality
3
⊘ This is a preview!⊘
Do you want full access?
Subscribe today to unlock all pages.

Trusted by 1+ million students worldwide

Staffs behaviours and treatment
Q6. What is the feature you like most in Murano?
Food variety
Interior
Location
Price
Service delivery
Q7. Are you satisfied with your current choice of restaurant?
Highly satisfied
Satisfied
Neutral
Dissatisfied
Highly dissatisfied
Q8. Would you prefer to visit another restaurant to experience in another location?
Yes
No
Not sure
Q9. What else in the restaurant would you like to add for better experience?
Taste of different regions
Home delivery
Special dishes on occasions
Self-service options for beverage
Q10. Would you like to revisit the restaurant again in future?
Yes
4
Paraphrase This Document
Need a fresh take? Get an instant paraphrase of this document with our AI Paraphraser

No
Not sure
Q11. Would you like to refer the brand others?
Yes
No
Not sure
TASK 2
2.1 Summarizing collected data
Data collection estimation is done through mean, median and mode. However, estimation
collected data as customers' views on services of Burano can be understood as:
Mean: It is an average value on overall collected data evaluated by dividing sum of
collected responds to number of participants who involved in the survey. However, used
formula to determine mean is as:
Illustration 1: Using
formula to evaluate
mean
Age Mean
18 2
18-24 5
25-31 7
32-38 3
5
Not sure
Q11. Would you like to refer the brand others?
Yes
No
Not sure
TASK 2
2.1 Summarizing collected data
Data collection estimation is done through mean, median and mode. However, estimation
collected data as customers' views on services of Burano can be understood as:
Mean: It is an average value on overall collected data evaluated by dividing sum of
collected responds to number of participants who involved in the survey. However, used
formula to determine mean is as:
Illustration 1: Using
formula to evaluate
mean
Age Mean
18 2
18-24 5
25-31 7
32-38 3
5

39-45 2
46-52 1
Total 20
Mean 3.3333333333
It is determined that on average respondents participated in survey are belonged to
between 25 to 31 at most. Similarly, average of total respondents in age factor is 3.33. Therefore,
different ideas can be generated regarding Murano restaurant and improving its quality services.
Median: It is considered as mid value of overall collected data on which decisions are
made for further business planning. For even and odd number of respondents, median is
evaluated by using formula as:
For even number of respondents:
Median = (n/2)th term
For odd number of participants:
Illustration 2: Used for calculating median of collected data
Mode: In this way, data collection is done through analysing repeated respondents as
frequency of answers of collected data.
Current occupation:
6
⊘ This is a preview!⊘
Do you want full access?
Subscribe today to unlock all pages.

Trusted by 1+ million students worldwide

Frequency of restaurant visit:
7
7
Paraphrase This Document
Need a fresh take? Get an instant paraphrase of this document with our AI Paraphraser

The purpose of restaurant visit:
8
8

Attributes would like in a restaurant:
9
9
⊘ This is a preview!⊘
Do you want full access?
Subscribe today to unlock all pages.

Trusted by 1+ million students worldwide
1 out of 37
Related Documents

Your All-in-One AI-Powered Toolkit for Academic Success.
+13062052269
info@desklib.com
Available 24*7 on WhatsApp / Email
Unlock your academic potential
© 2024 | Zucol Services PVT LTD | All rights reserved.