Business Decision Making Report: Syngenta and Amistar in Sri Lanka
VerifiedAdded on 2020/01/07
|47
|8824
|195
Report
AI Summary
This report provides a comprehensive analysis of business decision-making for the launch of Syngenta's Amistar product in Sri Lanka. The report begins with a market analysis, selecting Sri Lanka as a suitable country for expansion and detailing data collection methods, survey methodologies, and sampling techniques. It then designs a market survey questionnaire to gather insights into product preference, pricing, and promotion. Statistical methods, including mean, median, mode, range, and standard deviation, are employed to analyze data and improve business performance. The report also covers project management tools such as Gantt charts and network diagrams, along with time series analysis for forecasting and investment appraisal techniques like payback period, ARR, and NPV. The document also provides a critical evaluation of the four measures of investment appraisal. The report aims to guide Syngenta in making informed decisions for a successful market entry and business expansion.
Assignment title Business Decision Making
Instructions
An electronic copy of your assessment
must be fully uploaded by the deadline
date and time.
You must submit one single PDF or MS
Office Word document. Any relevant
images or screenshots must be included
within the same MS Office Word or PDF
document.
The last version you upload will be the
one that is marked. Your paper will be
marked if you have indicated this as
your final submission.
Review the mitigating circumstances
policy for information relating to
extensions.
The file size must not exceed 20MB.
Answer the criteria in order, clearly
indicating the pass criteria number.
Ensure that all work has been proof-
read and checked prior to submission.
Ensure that the layout of your
documents are in a professional format
with font style Arial, font size 12 for the
text, font 14 for sub heading and font 16
for main heading, line spacing 1.5 and
justified.
Use the Harvard referencing system;
otherwise it will be considered as
1
Paraphrase This Document
Need a fresh take? Get an instant paraphrase of this document with our AI Paraphraser
Learner Declaration
I
Date: 08/05/2016
BUSINESS DECISION MAKING
2
I
Date: 08/05/2016
BUSINESS DECISION MAKING
2
Contents
Introduction......................................................................................................................................5
Task 1...............................................................................................................................................6
Q1: Select a country of your choice where Amistar can be launched, and discuss the reasons
why your chosen country seems appropriate for expanding your business. This report should
also contain a plan explaining how you will collect the primary or secondary data, and a
discussion of the survey methodology you will adopt as well as the sampling method you will
use. (LO 1.1, LO 1.2, LO 3.4 & M2)...........................................................................................6
Q2: Design a market survey questionnaire (with around 12 carefully adapted questions) that
can be used to gain more insights for launching Amistar in a country that you have chosen
(include concepts like product preference, place, price and promotion, etc.). (LO1.3)..............8
M1: Explainhow you calculate the coefficient of skewness. Justify and explain how you can
use this concept to improve the performance of a business?.....................................................10
Task 2.............................................................................................................................................12
Q1. Calculation of Mean, Median and Mode and analysis and explanation of the significance
of these statistical calculations to an organization like Syngenta (LO2.1 & LO2.2).................12
Q2. Calculation of Range and standard deviation and explanation on the significance of these
calculations for an organisation like Syngenta (LO 2.3)...........................................................15
Q3. Importance of calculation of Quartiles, Percentiles and the correlation coefficient to an
organisation like Syngenta (LO 2.4)..........................................................................................17
Task 3 (LO3: 3.1, 3.2, 3.3, M3 and D1)........................................................................................17
Q1: Produce a Column/Bar graph showing Sales, Cost and Profit using software such as
Microsoft Excel, and, in a paragraph, draw valid conclusions based on the information derived.
(LO3.1)...........................................................................................................................................19
3
⊘ This is a preview!⊘
Do you want full access?
Subscribe today to unlock all pages.
Trusted by 1+ million students worldwide
Q2: Produce sales and profit line graphs showing trend lines which can be used for projecting
both the sales and profit. Show the regression equation separately on the graph. (LO3.2).......20
Q3: Prepare a presentation using software such as Microsoft PowerPoint, for the upcoming
meeting. Apply part of your answers from Q.1and Q.2 in this task, drawing valid conclusions
and recommendations. (LO 3.3 & M3)......................................................................................22
D1...............................................................................................................................................28
In approximately 300 words, critically evaluate the use of Time Series Analysis as a tool for
forecasting..................................................................................................................................28
Task 4 (LO4: 4.1, 4.2, 4.3 and D3)................................................................................................29
Q1: From the data above, prepare a Gantt chart, and state the benefits of using Gantt Charts as
a Project Management Tool. (LO4.1)........................................................................................30
Q2: Prepare a network diagram for the activities using software like Microsoft Project or Open
Project, clearly showing the critical path. In addition, show your calculation and answer for
the Project Duration. (LO4.2)....................................................................................................32
Q3: The Payback period, Accounting Rate of Return(ARR) and Net Present Value (NPV) of
each project. Recommend which project to undertake, and state why you would recommend
this option. (LO4.3& D3)...........................................................................................................34
D3: critically evaluate the four measures of investment appraisal (Payback period, ARR, NPV
and IRR).....................................................................................................................................38
Conclusion.....................................................................................................................................45
D2 Achieved here..........................................................................................................................46
Works Cited...................................................................................................................................46
4
Paraphrase This Document
Need a fresh take? Get an instant paraphrase of this document with our AI Paraphraser
Introduction
Syngenta is the company established in UK and planning to launch its new product i.e.
Amistar in new market place so that they are able to reap advantage of diversified
market place. For this purpose, research has been conducted and all matters like data
collection, its methods, survey mythology and sampling were used in this report. After
collection of relevant data in the research, data shall be analysed by using statistical
methods. Therefore this report includes use of mean, mode and median for processing
data and makes it error free for decision making.This report also includes methods
under measures of dispersion i.e. range and standard deviation. Another concern that is
raised in this report is of capital budgeting methods i.e. payback period, net present
value, IRR, etc. These are sued to evaluate capital projects that were undertaken by the
company.
5
Task 1
Q1: Select a country of your choice where Amistar can be launched, and discuss
the reasons why your chosen country seems appropriate for expanding your
business. This report should also contain a plan explaining how you will
collect the primary or secondary data, and a discussion of the survey
methodology you will adopt as well as the sampling method you will use.
(LO 1.1, LO 1.2, LO 3.4 & M2)
Syngenta is the organisation that is dealing in researching and developing fungicide that
will be used in protecting plants allaround the world. Syngenta is involvedin operating
business that will support and manage security of the plants that were grown all over
the world. Syngenta includes separate department for research and development under
which they develop such pest management fungicides. Apart from that, Syngenta is
alsoinvolve in making farmers as their member in this context and provide them with
sufficient education related to securities of plants.
Management of Syngenta is considering todevelopnew market for its product i.e.
Amistar. Therefore management of Syngenta is concern foridentifying market where
they can provide its services and can earn huge profits by selling Amistar there. Main
focus of Syngenta is to provide better measures to country in terms of crops or plants
management and security. Amistar not only provides security to crops but it also helps
in upgrading its quality(Driscoll & Brizee, 2010). Management is looking for the country
which has agriculture asits base and therefore we have lined up fewcountries for the
same and they are India, Pakistan, China, Sri Lanka, etc. among them Sri Lanka has
been selected for expanding its business by introducing Amistar in there.
Appropriate research has been conducted on agricultural sector of Sri Lanka, which
reveals that Sri Lanka has been apopular country in terms of spices, green veggies, etc.
Sri Lanka is involved in export of many items that are related to agriculture.Most of the
population is involved in agricultural activities there. It has beenseen (after research)
that farmers there are usingold technique for the security of plants and crops. Most of
6
⊘ This is a preview!⊘
Do you want full access?
Subscribe today to unlock all pages.
Trusted by 1+ million students worldwide
the areas in Sri Lanka were not using any product that can protect its crops. Other than
that Sri Lanka includes 52% as agriculture sector and government in Sri Lanka is
alsosupporting agriculturalactivities(Kumar, 2014). Therefore the government of Sri
Lanka had announced subsidiary and government grants on the products that were
manufactured or imported for the purpose of security of the crops and plants. This move
of the government of Sri Lanka has made Sri Lanka more attractive in terms of business
expansion country for Syngenta for their new product i.e. Amistar.
For the purpose of this research, both primary and secondary data will be used and
then analysed for making it error free. Primary data is collected from primary sources
that include questionnaire, interview, etc. Therefore primary data provides to the point
data to the researcher (Kaueper & Beaumont, 2010). Therefore in case of Syngenta,
primary data will be collected from the use of questionnaires. Questionnaires are the
method under which open ended and close ended question will be asked to the target
population and answers are analysed for the decision making. But in this research
limited primary data can be gathered because of distance. On the other hand,
secondary data will also be gathered for this research. Secondary data shall be carefully
gathered and used in this research since it is less reliable as a source. Secondary data
for this research will be collected from internet and mostly from the Sri Lankan
government sites and from other authorised and official sites only. On the other hand,
agricultural sector reports in Sri Lanka will be gathered and analysed so that deeper
analysis for business expansion opportunity can be gathered in terms of Amistar
product of Syngenta.
Since for the collection of primary data questionnaires will be used therefore sample
size, sample criteria and sampling method that is to used need to be defied here. It can
be noted that huge population is to be target therefore adequate sample is to be defined
(Driscoll & Brizee, 2010). For this research, simple random sampling method shall be
used because there are many farmers or other target people that need to be questioned
therefore simple sampling shall be done. Before providing questionnaires, criteria for the
respondent needs to be asked i.e. he / she shall be a farmer, standard income, area of
land used for agriculture, etc. Researcher aims to adopt appropriate survey method in
7
Paraphrase This Document
Need a fresh take? Get an instant paraphrase of this document with our AI Paraphraser
regard to undertake appropriate decisions so that it could assist managers in regard to
carry out successful business. However, the information collected through using primary
sources are always accurate and feasible. Hence, managers are required to easily
evaluate the crucial information in regard to expand the business functions in market.
Also, the data collected through survey methodology results in making appropriate
future decisions and thus reach potential respondents through spreading questionnaire
through google scholars, social media websites or e-mail. The collected data through
such sources helps in making effective decisions in terms of raising business
performance.
Sampling frame- Carrying out random sampling technique helps in collecting random
sample frame in regard to assess the information from selected respondents.
Researcher also uses selected frame in regard to assists scholar and thus choose the
most crucial group of population from whole universe. Further, it is essential for
researcher to adopt effective techniques through which appropriate information could be
collected and thus enhance the business functions in market. It aids management to
undertake flexible decision so that business expansion could be attained.
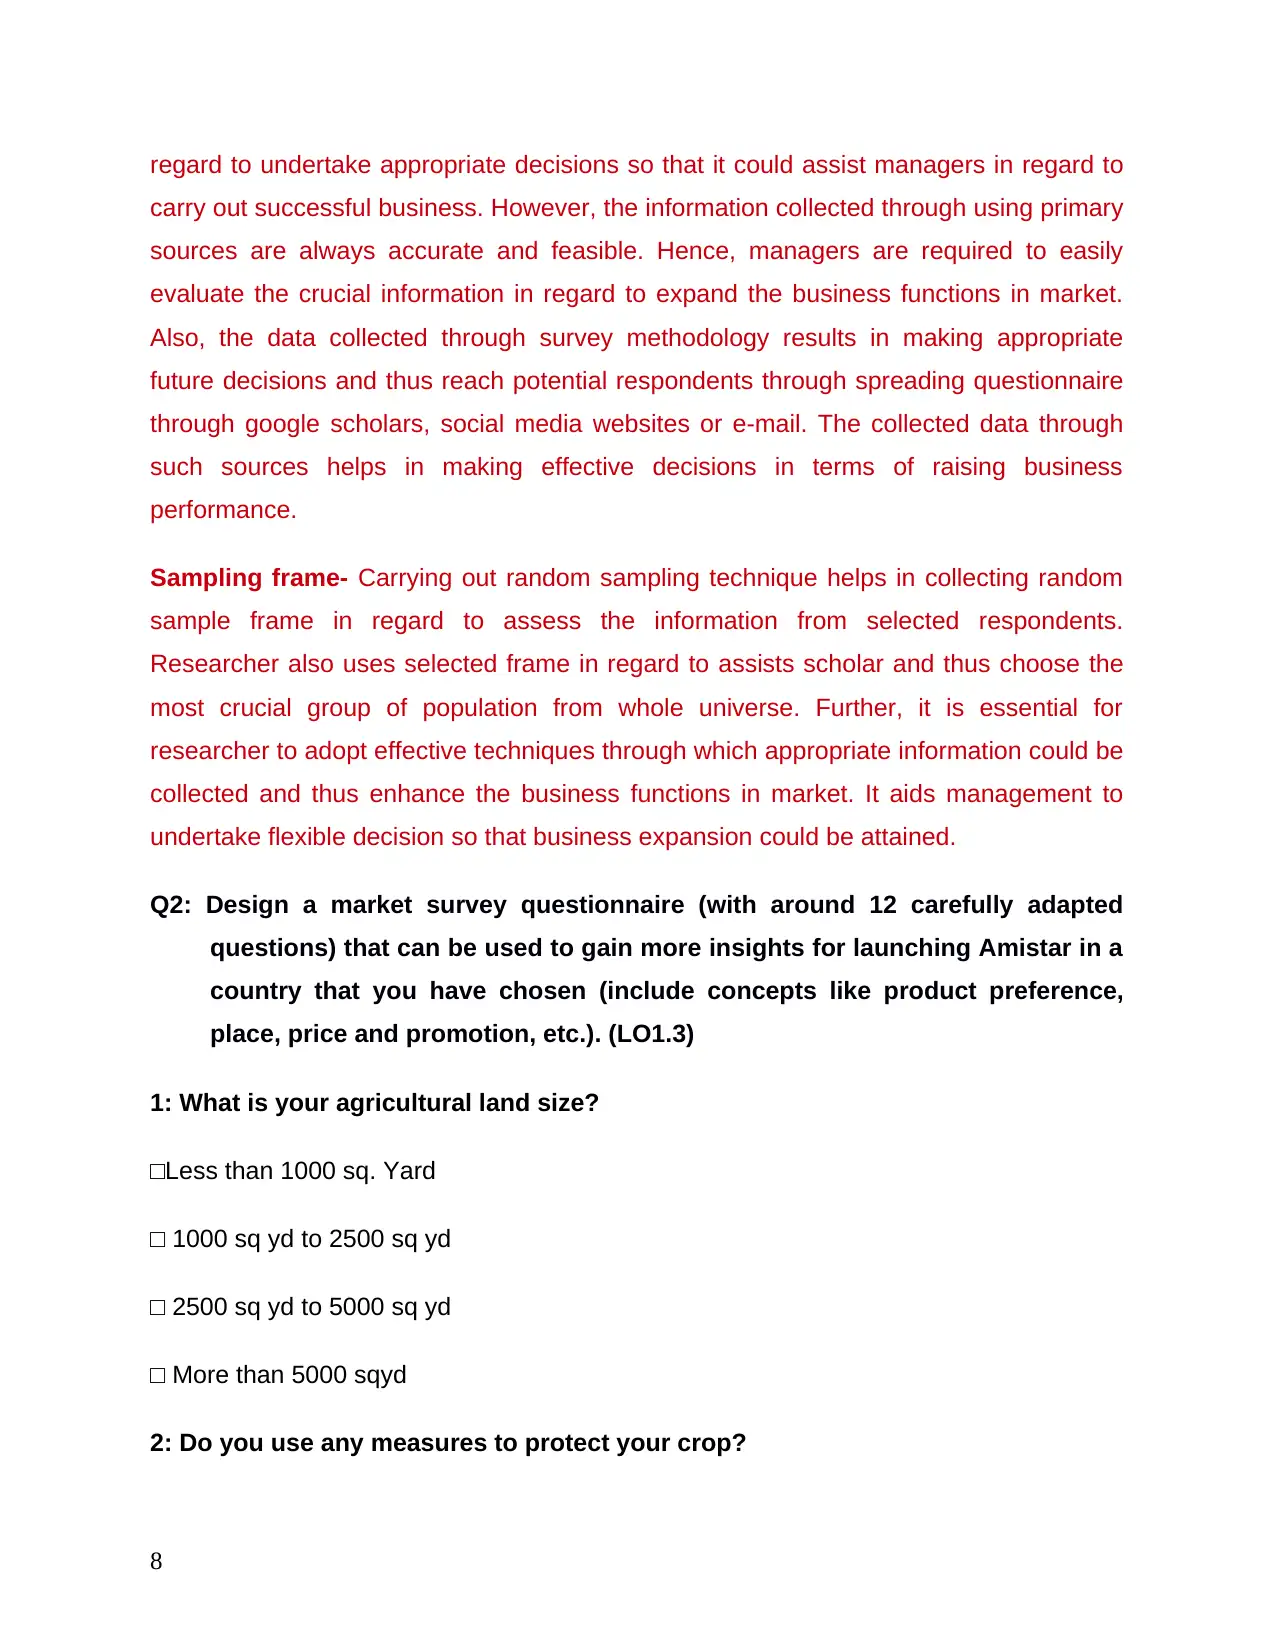
Q2: Design a market survey questionnaire (with around 12 carefully adapted
questions) that can be used to gain more insights for launching Amistar in a
country that you have chosen (include concepts like product preference,
place, price and promotion, etc.). (LO1.3)
1: What is your agricultural land size?
□Less than 1000 sq. Yard
□ 1000 sq yd to 2500 sq yd
□ 2500 sq yd to 5000 sq yd
□ More than 5000 sqyd
2: Do you use any measures to protect your crop?
8
carry out successful business. However, the information collected through using primary
sources are always accurate and feasible. Hence, managers are required to easily
evaluate the crucial information in regard to expand the business functions in market.
Also, the data collected through survey methodology results in making appropriate
future decisions and thus reach potential respondents through spreading questionnaire
through google scholars, social media websites or e-mail. The collected data through
such sources helps in making effective decisions in terms of raising business
performance.
Sampling frame- Carrying out random sampling technique helps in collecting random
sample frame in regard to assess the information from selected respondents.
Researcher also uses selected frame in regard to assists scholar and thus choose the
most crucial group of population from whole universe. Further, it is essential for
researcher to adopt effective techniques through which appropriate information could be
collected and thus enhance the business functions in market. It aids management to
undertake flexible decision so that business expansion could be attained.
Q2: Design a market survey questionnaire (with around 12 carefully adapted
questions) that can be used to gain more insights for launching Amistar in a
country that you have chosen (include concepts like product preference,
place, price and promotion, etc.). (LO1.3)
1: What is your agricultural land size?
□Less than 1000 sq. Yard
□ 1000 sq yd to 2500 sq yd
□ 2500 sq yd to 5000 sq yd
□ More than 5000 sqyd
2: Do you use any measures to protect your crop?
8
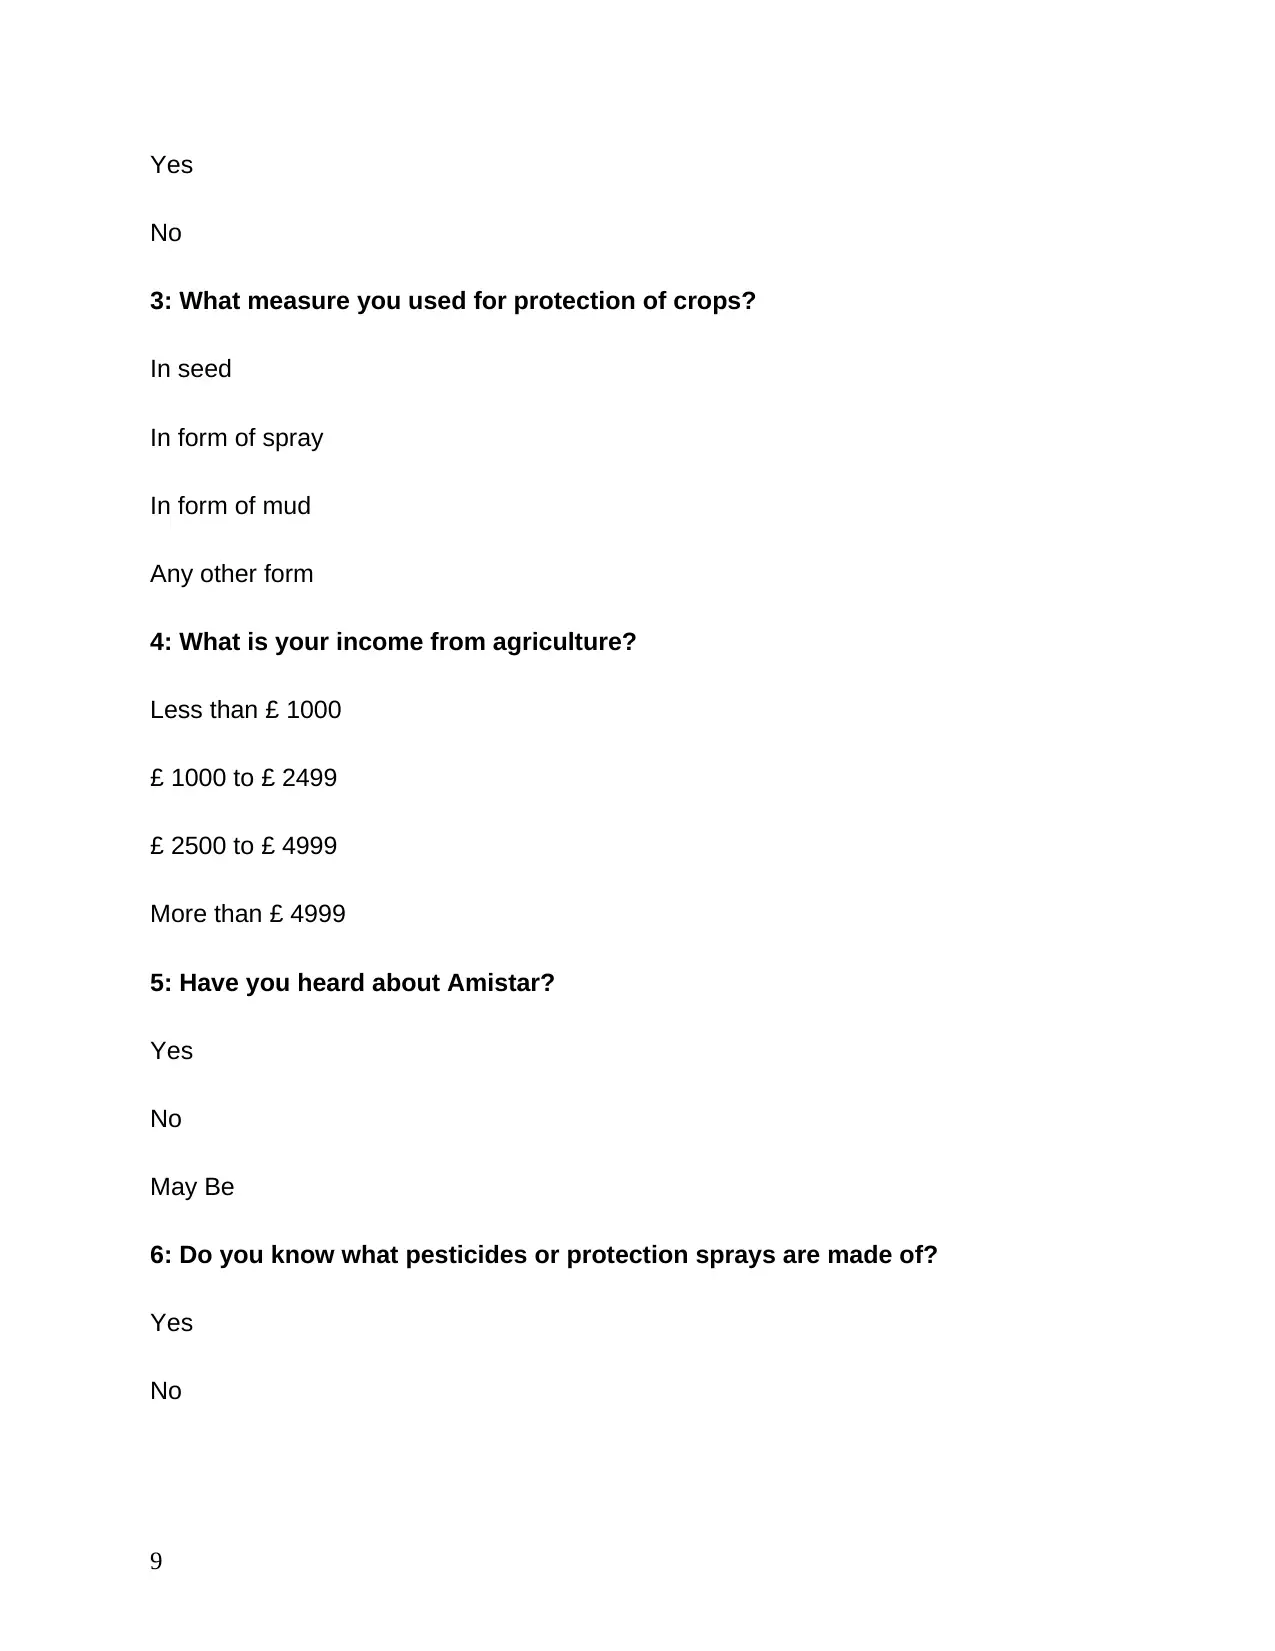
Yes
No
3: What measure you used for protection of crops?
In seed
In form of spray
In form of mud
Any other form
4: What is your income from agriculture?
Less than £ 1000
£ 1000 to £ 2499
£ 2500 to £ 4999
More than £ 4999
5: Have you heard about Amistar?
Yes
No
May Be
6: Do you know what pesticides or protection sprays are made of?
Yes
No
9
No
3: What measure you used for protection of crops?
In seed
In form of spray
In form of mud
Any other form
4: What is your income from agriculture?
Less than £ 1000
£ 1000 to £ 2499
£ 2500 to £ 4999
More than £ 4999
5: Have you heard about Amistar?
Yes
No
May Be
6: Do you know what pesticides or protection sprays are made of?
Yes
No
9
⊘ This is a preview!⊘
Do you want full access?
Subscribe today to unlock all pages.
Trusted by 1+ million students worldwide
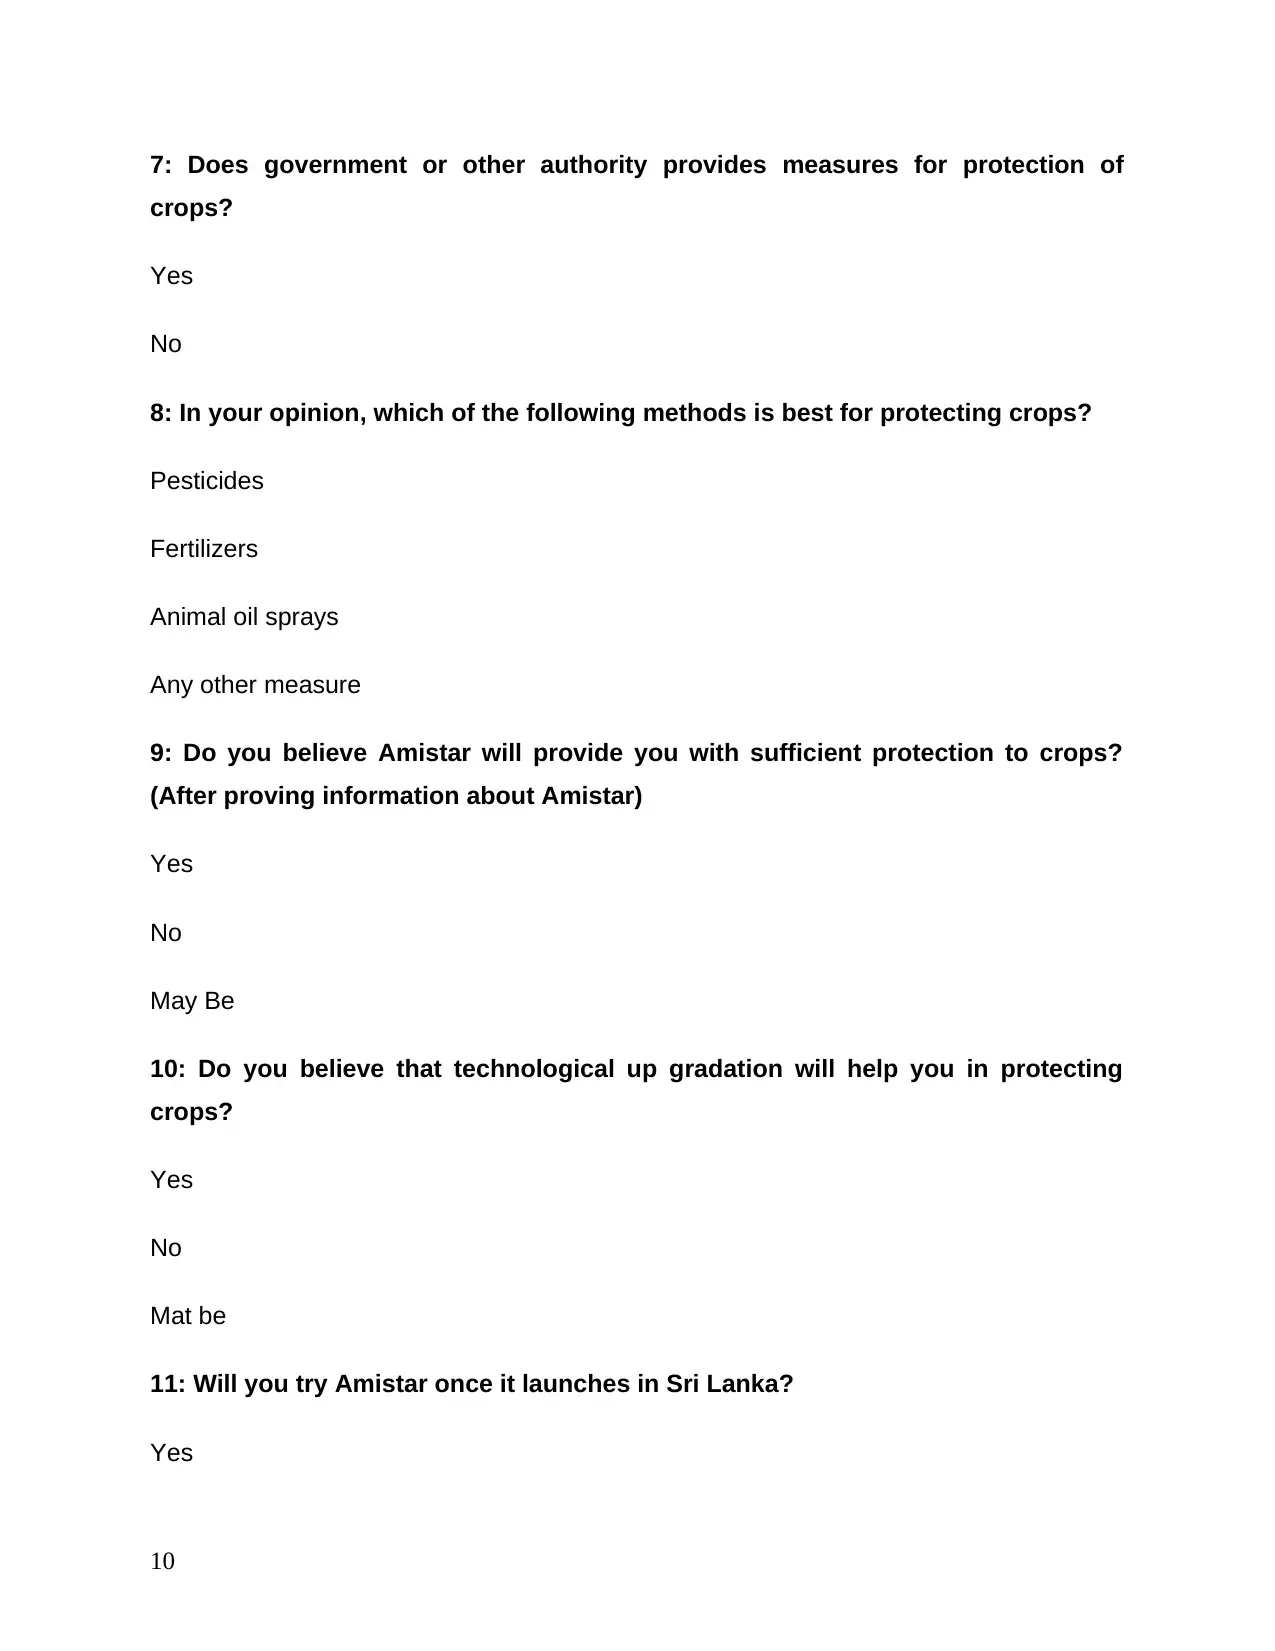
7: Does government or other authority provides measures for protection of
crops?
Yes
No
8: In your opinion, which of the following methods is best for protecting crops?
Pesticides
Fertilizers
Animal oil sprays
Any other measure
9: Do you believe Amistar will provide you with sufficient protection to crops?
(After proving information about Amistar)
Yes
No
May Be
10: Do you believe that technological up gradation will help you in protecting
crops?
Yes
No
Mat be
11: Will you try Amistar once it launches in Sri Lanka?
Yes
10
crops?
Yes
No
8: In your opinion, which of the following methods is best for protecting crops?
Pesticides
Fertilizers
Animal oil sprays
Any other measure
9: Do you believe Amistar will provide you with sufficient protection to crops?
(After proving information about Amistar)
Yes
No
May Be
10: Do you believe that technological up gradation will help you in protecting
crops?
Yes
No
Mat be
11: Will you try Amistar once it launches in Sri Lanka?
Yes
10
Paraphrase This Document
Need a fresh take? Get an instant paraphrase of this document with our AI Paraphraser
No
May be
12: Any suggestion for improvement in features of Amistar?
(Boulton, 2012)
M1: Explain how you calculate the coefficient of skewness. Justify and explain
how you can use this concept to improve the performance of a business?
It includes probability theory under which mean, median and standard deviation present
in mean and median will be analysed for the purpose of calculating Coefficient of
Skewness. Coefficient of Skewness supports business decisions related to results
calculated in mean, median and standard deviation. Coefficient of Skewness can be
positive or negative or zero.
Coefficient of Skewness = 3 (mean – median) / standard deviation
Use of Coefficient of Skewness: Coefficient of Skewness is used to analysedata
related to mean, median and standard deviation and measures relationship between
these elements. Therefore it provides information for the decision making process.
Greater mean reflectpositive coefficient of Skewness and lower mean denotes negative
coefficient of Skewness. Positive coefficient of Skewness provides positive results as
compared to negative.
11
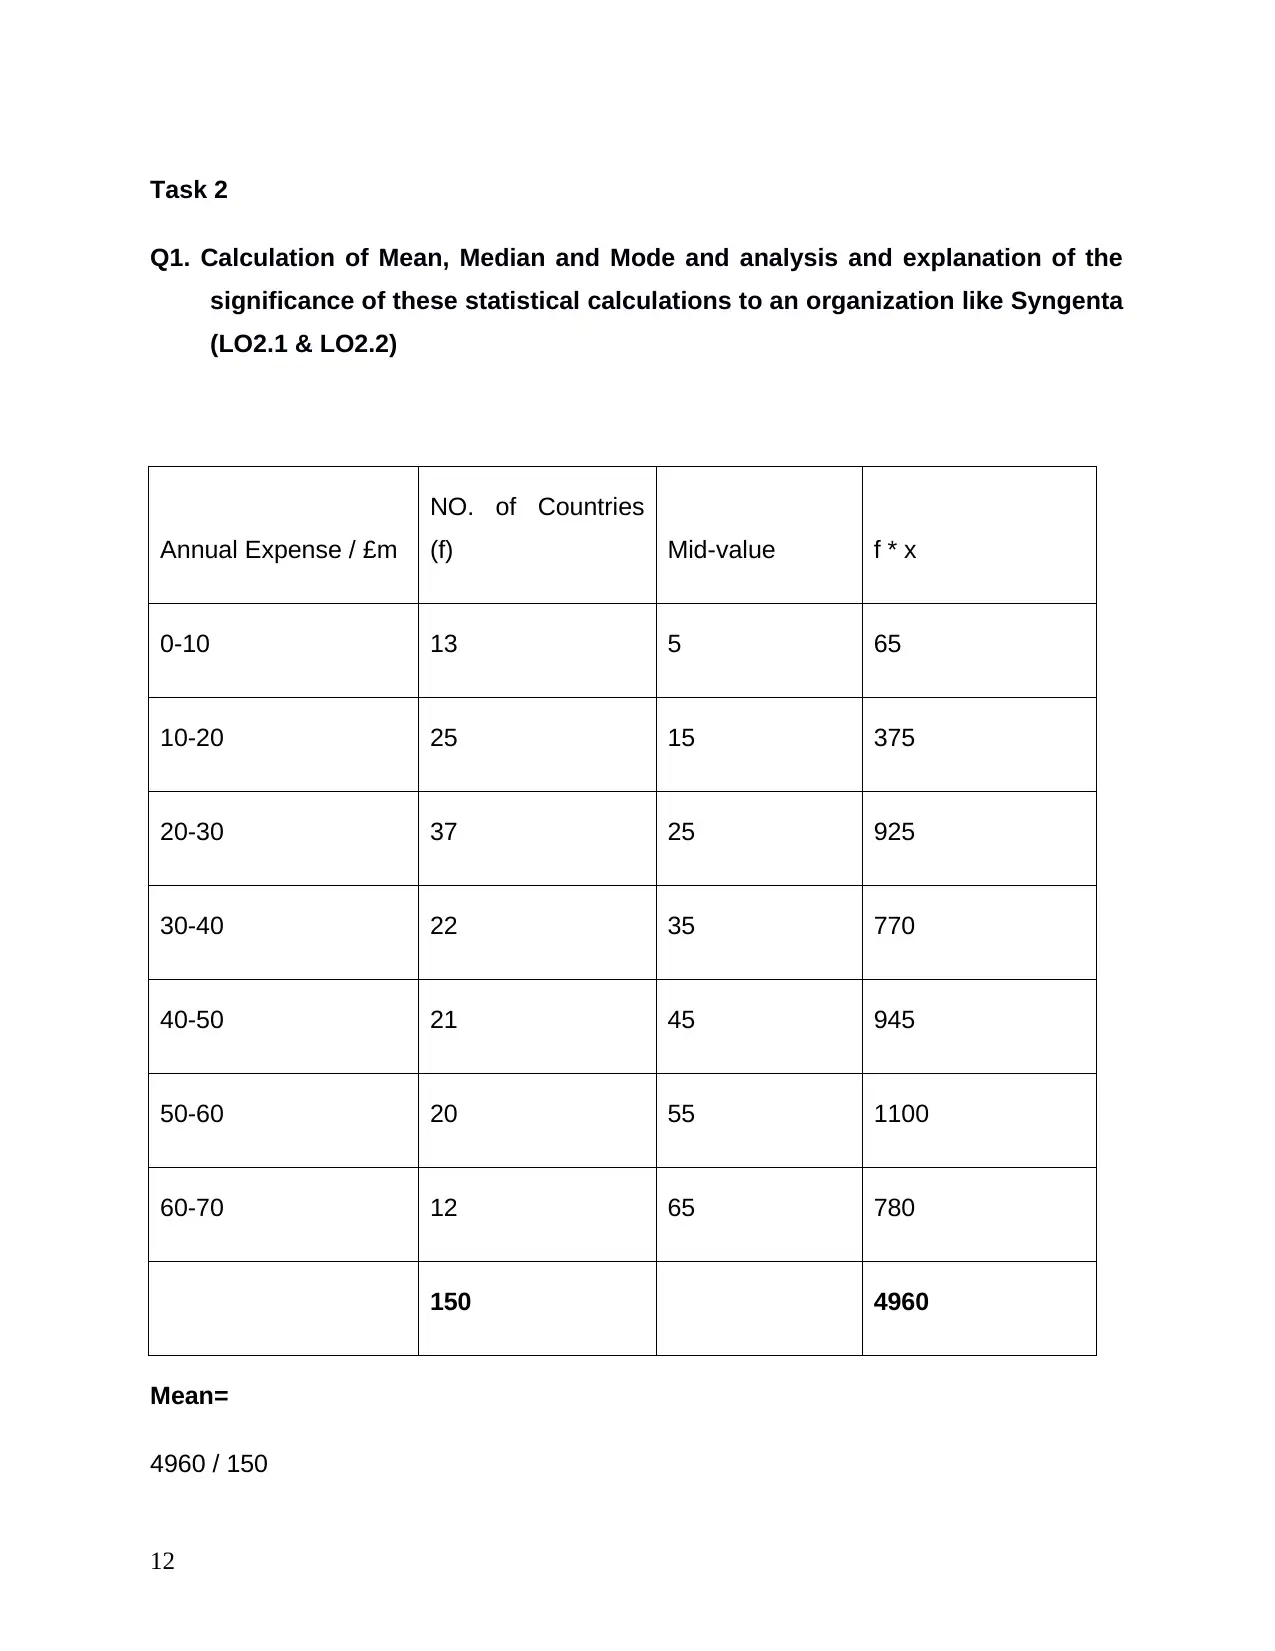
Task 2
Q1. Calculation of Mean, Median and Mode and analysis and explanation of the
significance of these statistical calculations to an organization like Syngenta
(LO2.1 & LO2.2)
Annual Expense / £m
NO. of Countries
(f) Mid-value f * x
0-10 13 5 65
10-20 25 15 375
20-30 37 25 925
30-40 22 35 770
40-50 21 45 945
50-60 20 55 1100
60-70 12 65 780
150 4960
Mean=
4960 / 150
12
⊘ This is a preview!⊘
Do you want full access?
Subscribe today to unlock all pages.
Trusted by 1+ million students worldwide
1 out of 47
Related Documents


Your All-in-One AI-Powered Toolkit for Academic Success.
+13062052269
info@desklib.com
Available 24*7 on WhatsApp / Email
![[object Object]](/_next/static/media/star-bottom.7253800d.svg)
Unlock your academic potential
Copyright © 2020–2026 A2Z Services. All Rights Reserved. Developed and managed by ZUCOL.