Business Decision Making Report for Blackfriars Restaurant
VerifiedAdded on 2020/01/16
|30
|5365
|206
Report
AI Summary
This report analyzes business decision-making for Blackfriars Restaurant, focusing on market understanding and strategic insights. The report starts with an introduction to the restaurant and the importance of data-driven decisions. It covers data collection methods, including primary and secondary data, and explains survey methodology and sampling techniques. Task 2 delves into statistical analysis, calculating and interpreting mean, mode, median, standard deviation, correlation, quartiles, and percentiles. Task 3 presents graphical representations and trend lines to aid decision-making, along with business presentations and formal reports. The final task examines information systems used in decision-making and the application of capital budgeting techniques, including payback period calculations and other methods. The report concludes with a summary of findings and references.

BUSINESS
DECISION
MAKING
DECISION
MAKING
Paraphrase This Document
Need a fresh take? Get an instant paraphrase of this document with our AI Paraphraser
Table of Contents
INTRODUCTION...........................................................................................................................1
TASK 1............................................................................................................................................1
1.1 Plan and method for collection of data.............................................................................1
1.2 Survey methodology and sampling method ....................................................................2
1.3 Questioner related to Survey Questioner..........................................................................3
TASK -2...........................................................................................................................................6
2.1 mean,mode.median...........................................................................................................6
2.2 interpretation of mean, mode, median.............................................................................8
2.3 Stander deviation.............................................................................................................9
2.4 Correlation ,Quartile, percentiles and coefficient...........................................................10
TASK – 3......................................................................................................................................11
3.1 Graphical presentation....................................................................................................11
3.2 Trend line describing and help to taking decision-making............................................13
3.3 Business presentation.....................................................................................................14
3.4 Business formal report....................................................................................................17
TASK – 4.......................................................................................................................................18
4.1 Information system used in the decision........................................................................18
4.2 calculation of payback period.........................................................................................18
4.3 Different techniques of Capital budgeting.....................................................................21
CONCLUSION .............................................................................................................................23
REFERENCES..............................................................................................................................24
Illustration Index
Illustration 1: Critical Path.............................................................................................................22
Illustration 2: Gantt Chart..............................................................................................................23
Illustration 1: Critical Path.............................................................................................................22
Illustration 2: Gantt Chart..............................................................................................................23
⊘ This is a preview!⊘
Do you want full access?
Subscribe today to unlock all pages.
Trusted by 1+ million students worldwide
INTRODUCTION
Blackfriars Restaurant is one of the restaurant in UK. It is essential start the business to
understand the market and help to decision. It has been observed that the most of business using
the fact and figures in order to make the decision in the firm In this regard they used the tactical
tools and statical tool related to mean, mode, median, correlation, coefficient in the research. In
order to understand practical application of these tools calculations are done and their results are
interpreted in order to measure the firm’s performance from different sides. In that report we are
collect the primary data is also collected by distributing questionnaire and their results are also
interpreted.
TASK 1
1.1 Plan and method for collection of data
The researcher can collect the data through the primary method and secondary method
for analysing the situation and demand of the restaurant in particular areas.
Primary data- The researcher can use the collection of data and also gathering the data
through the directly to the customer and original sources. It includes the resource
observation, telephonic, mail, interview, survey, experiment, focus group etc.
Observation – The researcher can collect the data through this process directly in interact
with the costumers and identifying the demand and need and perception of restaurant in
the country(Sutherland, 2010).
Survey – In this method researcher can select the sample size it may be probable and non
probable and they also used the questioner related to the situation and filling through
online. They prepare the questioner related to open ended and close ended and that may
fill through the directly in the business.
Secondary data- Researcher can collect the data through the articles, journals and also
other result of collecting the data and this is the estimated data not a correct data for the
making decision in the business. It is less expensive and investigator is not personally
responsible for the quality of data. Its disadvantages is related the not only to the
availability of sources in the business. This type of data investigator not decide what is
1
Paraphrase This Document
Need a fresh take? Get an instant paraphrase of this document with our AI Paraphraser
the reason and situation for collection of data and it is the right and the data already no
hassle for data collection.
1.2 Survey methodology and sampling method
Survey methodology- Survey methodology is the study of sampling of in dividual and
population It is the construct that the time associated with the survey data collection it include
the method for improving the number and accuracy of the responded to the survey. The
researcher can used this technique and also gather the information through question to the person
Researcher can take advantage It is broader range collect the information and it produced the
information related to attitude, opinion, motive etc. It is the usually cheaper rate and also reliable
of data and also simple to administer in the situation.
Sampling method – Sampling is the method and process of selecting the group of population in
this Black friars restaurant the researcher can select the 30 customer in conducting the survey.
There are the two type of method used in the collect the sample in the research.
Probability sampling - This is the method each population element has known and also
the chance of being choose in the sample.
Random sampling – It is the method for any sampling have chance to select and the
population consist the N object and if all possible sample are select the equally random
selection. There are many ways but lottery is better way to determined the theory and
prospectus of the costumers. In this method researcher can select and assigned the
number that are unique code of the person.
Stratified sampling – In this method researcher can make the group based on the
characteristic. Within each group have income, taste and same of the preference for the
food making by the Black friars restaurant can take the research and also conclude the
result. And this group also called strata(García- Peñalvo and Conde, 2014).
Cluster sampling – In this method every member assigned a one group and group are
select by the probability method.
Non probability method – It is the method that choose of the population element will be
select and not and each population element has no zero chance of being select or not.
2
Voluntary sampling – It is the method that the people have selected and self select in the
interview and also conduct the research according to the interest in main topic of survey.
Convenience sample - It is the sample the person are easy to reach and also confirm the
behaviour and it is easy to taken the result awareness of the result of sample.
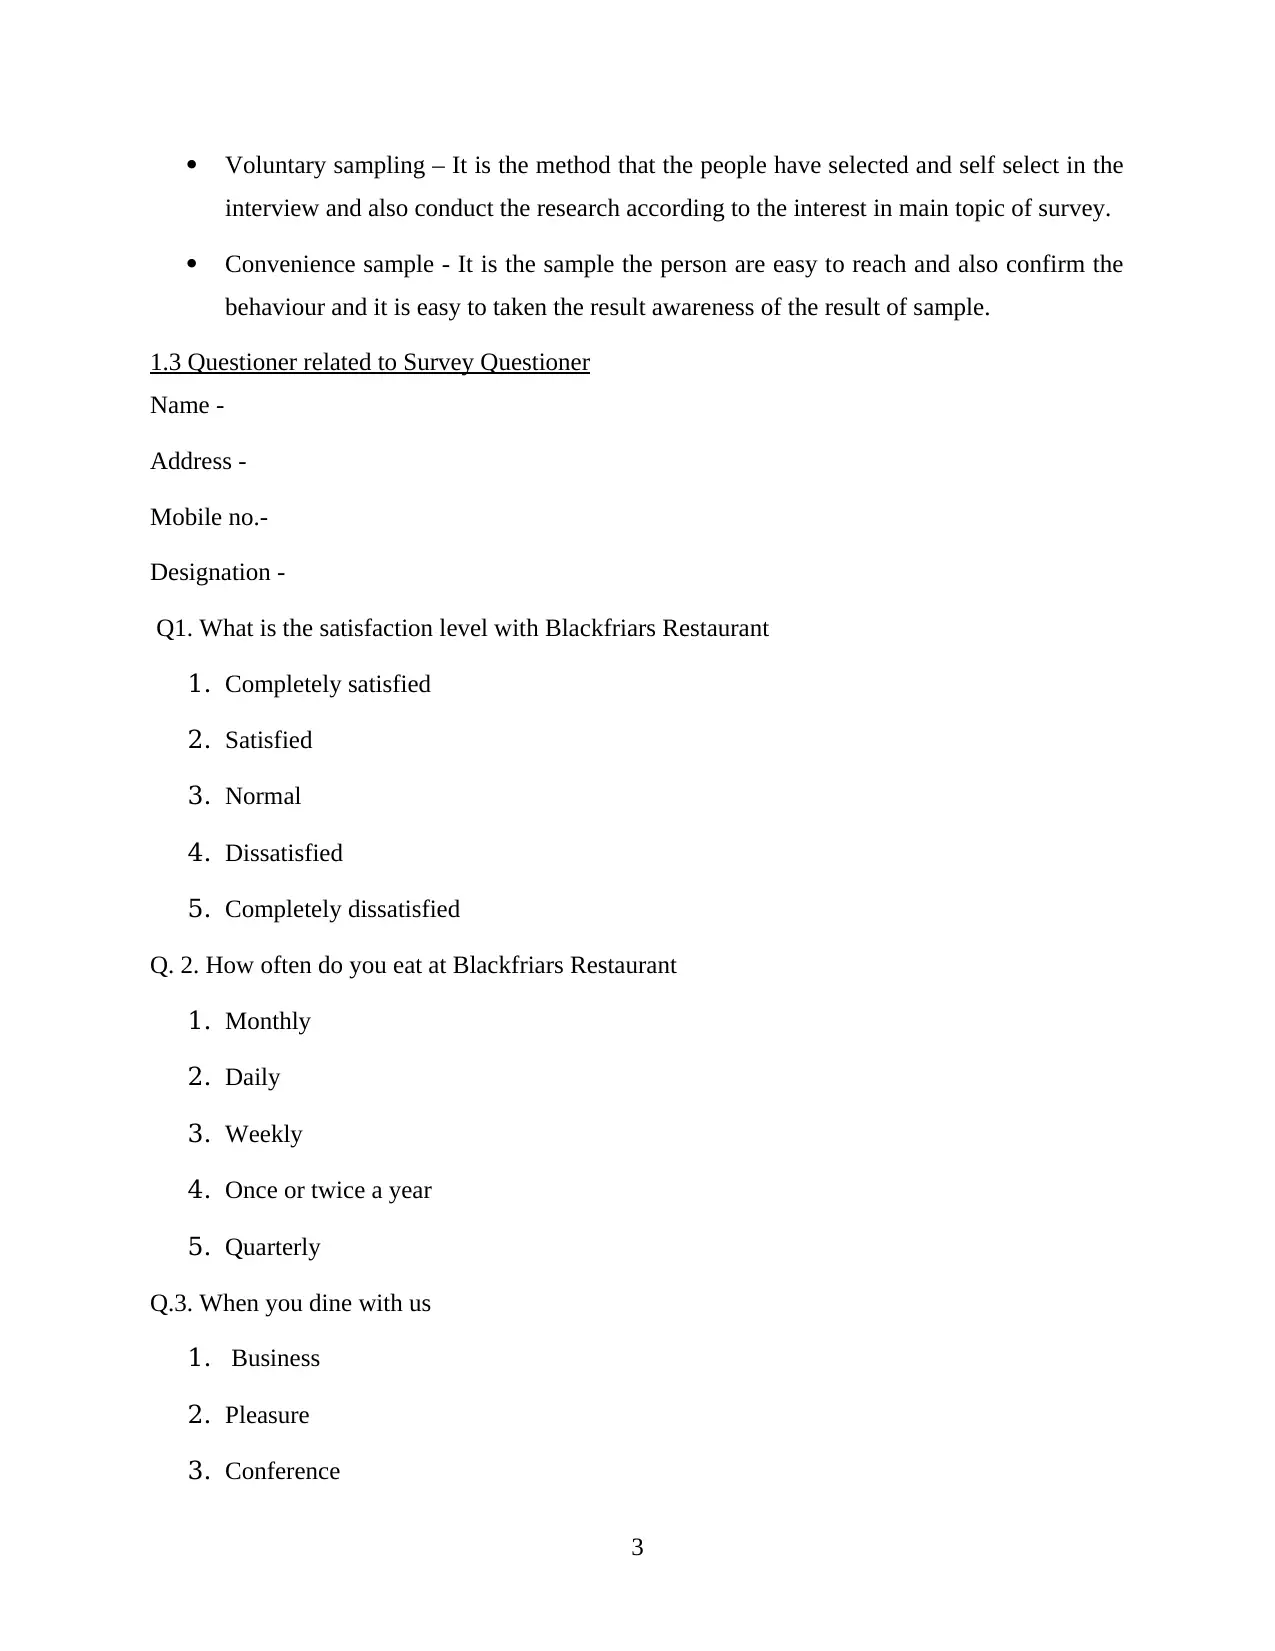
1.3 Questioner related to Survey Questioner
Name -
Address -
Mobile no.-
Designation -
Q1. What is the satisfaction level with Blackfriars Restaurant
1. Completely satisfied
2. Satisfied
3. Normal
4. Dissatisfied
5. Completely dissatisfied
Q. 2. How often do you eat at Blackfriars Restaurant
1. Monthly
2. Daily
3. Weekly
4. Once or twice a year
5. Quarterly
Q.3. When you dine with us
1. Business
2. Pleasure
3. Conference
3
interview and also conduct the research according to the interest in main topic of survey.
Convenience sample - It is the sample the person are easy to reach and also confirm the
behaviour and it is easy to taken the result awareness of the result of sample.
1.3 Questioner related to Survey Questioner
Name -
Address -
Mobile no.-
Designation -
Q1. What is the satisfaction level with Blackfriars Restaurant
1. Completely satisfied
2. Satisfied
3. Normal
4. Dissatisfied
5. Completely dissatisfied
Q. 2. How often do you eat at Blackfriars Restaurant
1. Monthly
2. Daily
3. Weekly
4. Once or twice a year
5. Quarterly
Q.3. When you dine with us
1. Business
2. Pleasure
3. Conference
3
⊘ This is a preview!⊘
Do you want full access?
Subscribe today to unlock all pages.
Trusted by 1+ million students worldwide
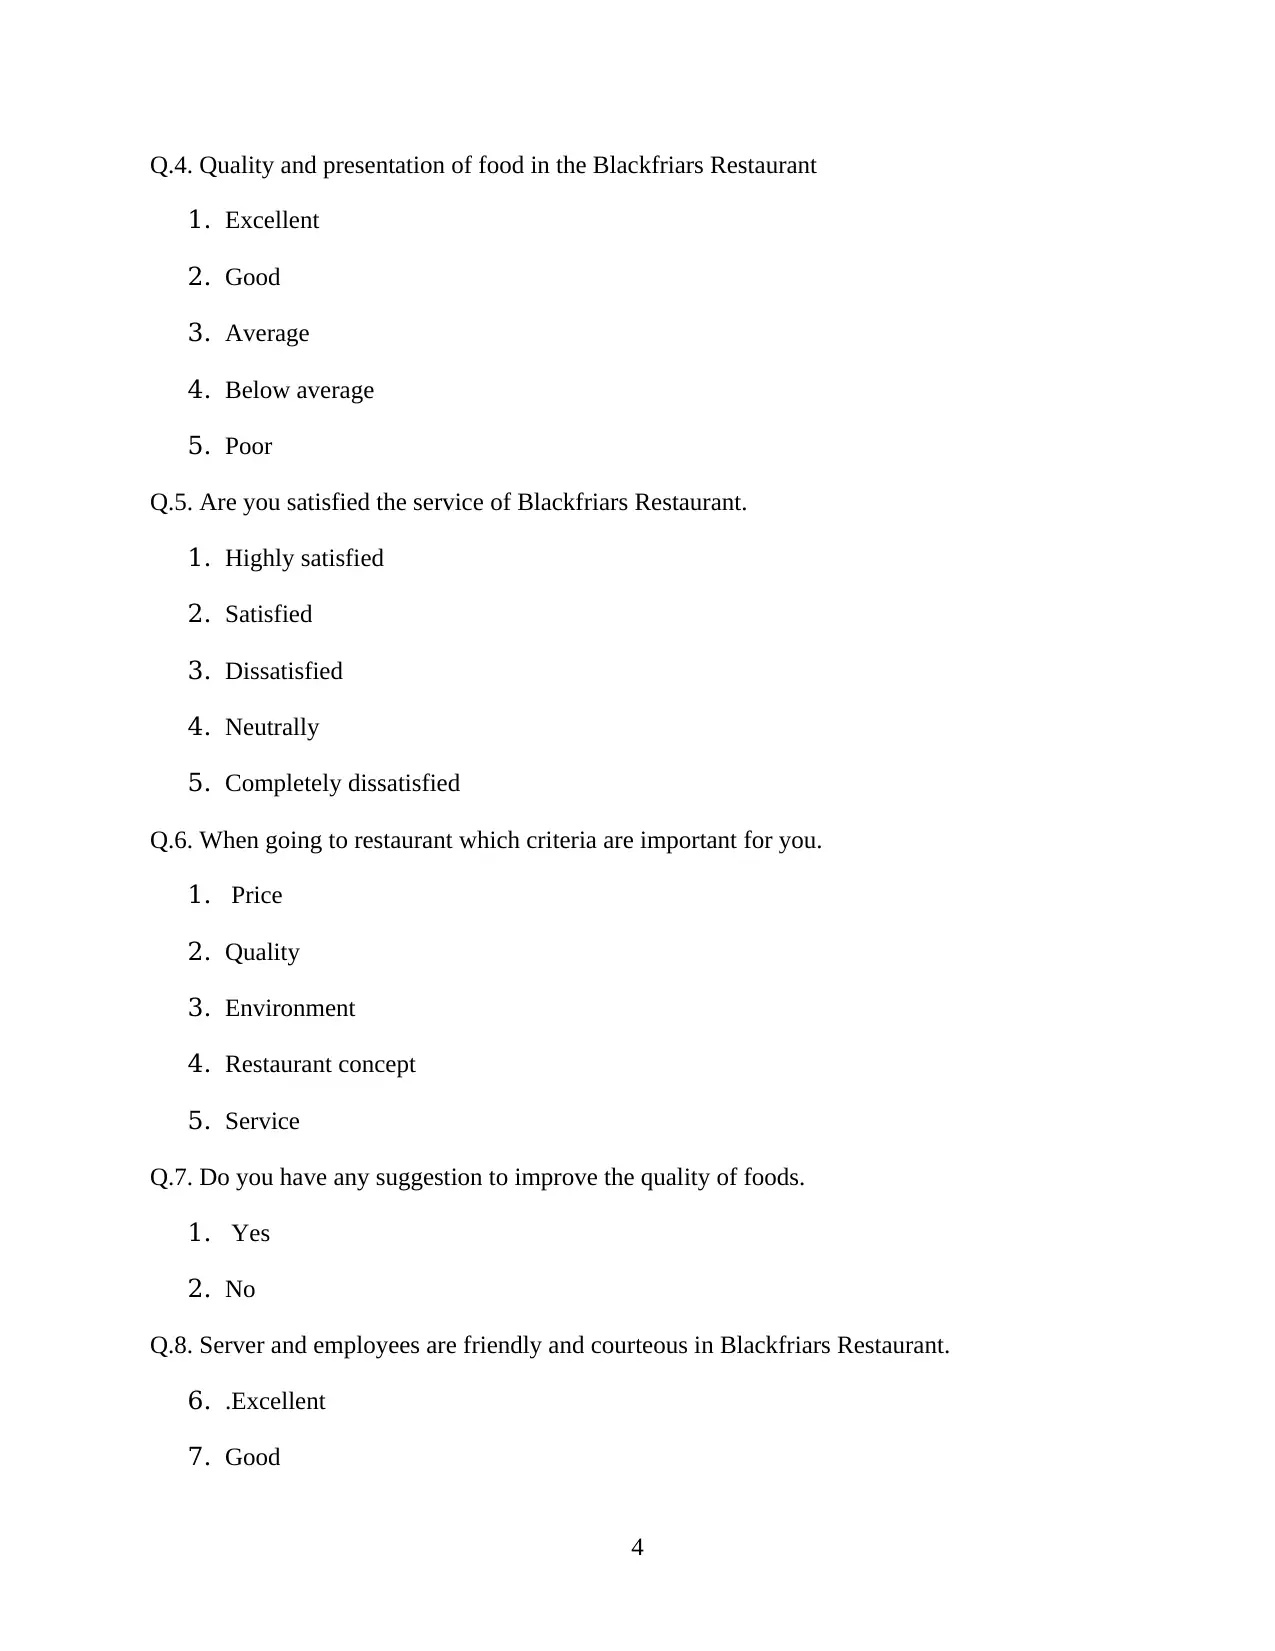
Q.4. Quality and presentation of food in the Blackfriars Restaurant
1. Excellent
2. Good
3. Average
4. Below average
5. Poor
Q.5. Are you satisfied the service of Blackfriars Restaurant.
1. Highly satisfied
2. Satisfied
3. Dissatisfied
4. Neutrally
5. Completely dissatisfied
Q.6. When going to restaurant which criteria are important for you.
1. Price
2. Quality
3. Environment
4. Restaurant concept
5. Service
Q.7. Do you have any suggestion to improve the quality of foods.
1. Yes
2. No
Q.8. Server and employees are friendly and courteous in Blackfriars Restaurant.
6. .Excellent
7. Good
4
Paraphrase This Document
Need a fresh take? Get an instant paraphrase of this document with our AI Paraphraser
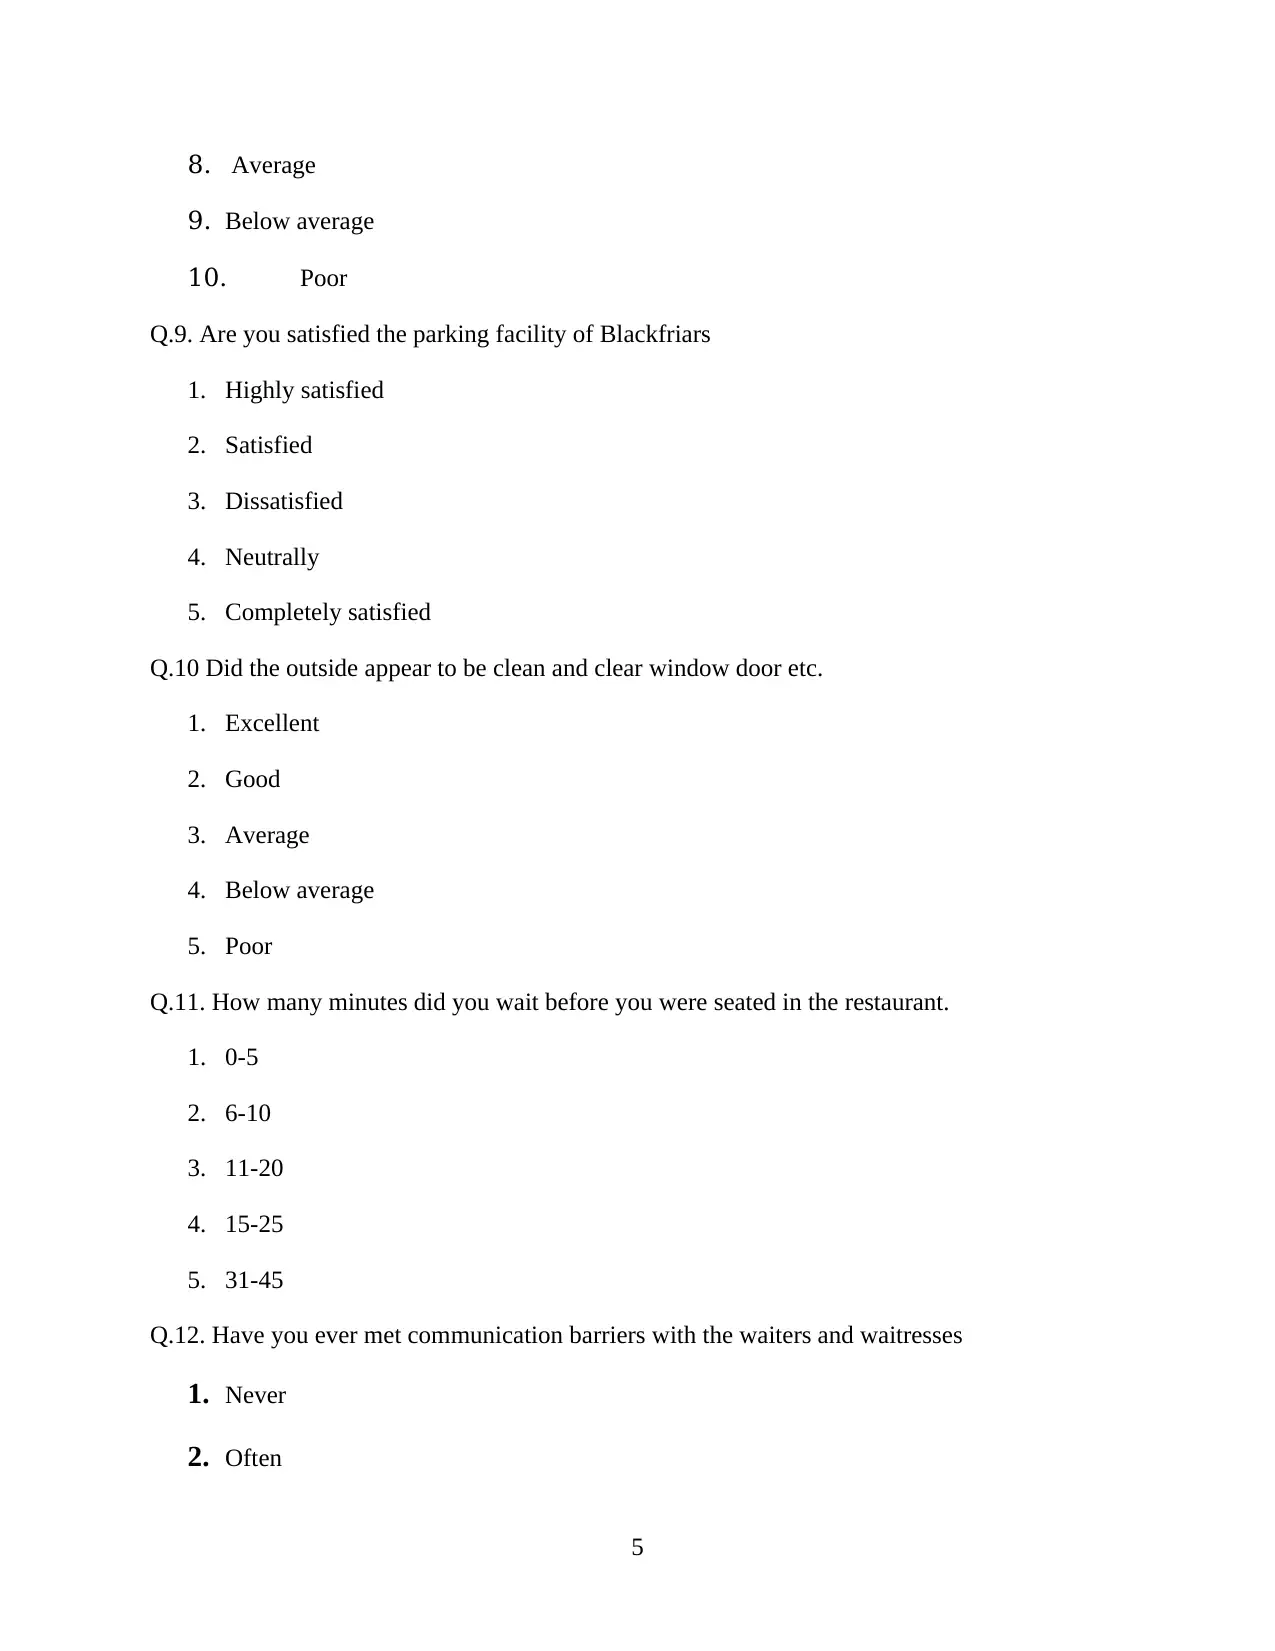
8. Average
9. Below average
10. Poor
Q.9. Are you satisfied the parking facility of Blackfriars
1. Highly satisfied
2. Satisfied
3. Dissatisfied
4. Neutrally
5. Completely satisfied
Q.10 Did the outside appear to be clean and clear window door etc.
1. Excellent
2. Good
3. Average
4. Below average
5. Poor
Q.11. How many minutes did you wait before you were seated in the restaurant.
1. 0-5
2. 6-10
3. 11-20
4. 15-25
5. 31-45
Q.12. Have you ever met communication barriers with the waiters and waitresses
1. Never
2. Often
5
3. Always
4. Seldom
Q. 13. Are you satisfied quality of the food in Blackfriars Restaurant.
1. Satisfied
2. Very satisfied
3. Dissatisfied
4. Neutrally
5. Very dissatisfied
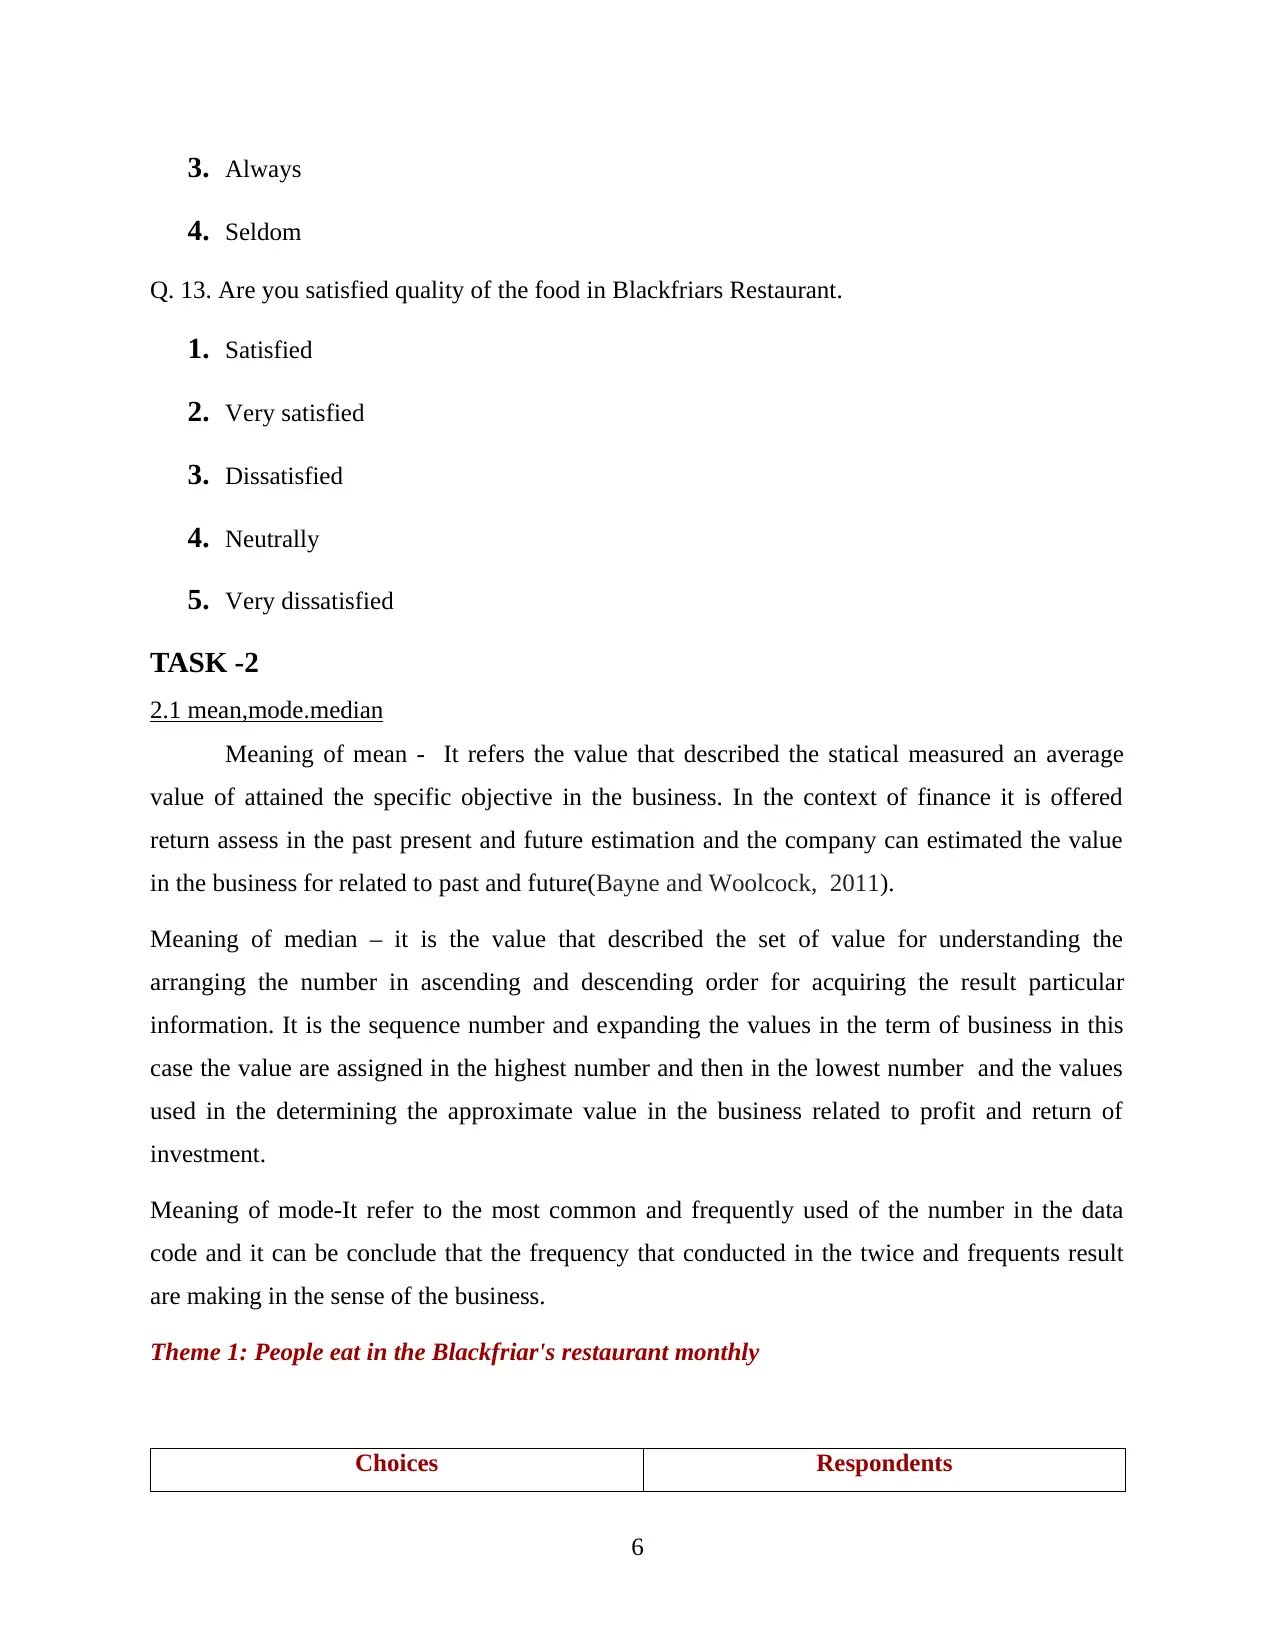
TASK -2
2.1 mean,mode.median
Meaning of mean - It refers the value that described the statical measured an average
value of attained the specific objective in the business. In the context of finance it is offered
return assess in the past present and future estimation and the company can estimated the value
in the business for related to past and future(Bayne and Woolcock, 2011).
Meaning of median – it is the value that described the set of value for understanding the
arranging the number in ascending and descending order for acquiring the result particular
information. It is the sequence number and expanding the values in the term of business in this
case the value are assigned in the highest number and then in the lowest number and the values
used in the determining the approximate value in the business related to profit and return of
investment.
Meaning of mode-It refer to the most common and frequently used of the number in the data
code and it can be conclude that the frequency that conducted in the twice and frequents result
are making in the sense of the business.
Theme 1: People eat in the Blackfriar's restaurant monthly
Choices Respondents
6
4. Seldom
Q. 13. Are you satisfied quality of the food in Blackfriars Restaurant.
1. Satisfied
2. Very satisfied
3. Dissatisfied
4. Neutrally
5. Very dissatisfied
TASK -2
2.1 mean,mode.median
Meaning of mean - It refers the value that described the statical measured an average
value of attained the specific objective in the business. In the context of finance it is offered
return assess in the past present and future estimation and the company can estimated the value
in the business for related to past and future(Bayne and Woolcock, 2011).
Meaning of median – it is the value that described the set of value for understanding the
arranging the number in ascending and descending order for acquiring the result particular
information. It is the sequence number and expanding the values in the term of business in this
case the value are assigned in the highest number and then in the lowest number and the values
used in the determining the approximate value in the business related to profit and return of
investment.
Meaning of mode-It refer to the most common and frequently used of the number in the data
code and it can be conclude that the frequency that conducted in the twice and frequents result
are making in the sense of the business.
Theme 1: People eat in the Blackfriar's restaurant monthly
Choices Respondents
6
⊘ This is a preview!⊘
Do you want full access?
Subscribe today to unlock all pages.
Trusted by 1+ million students worldwide
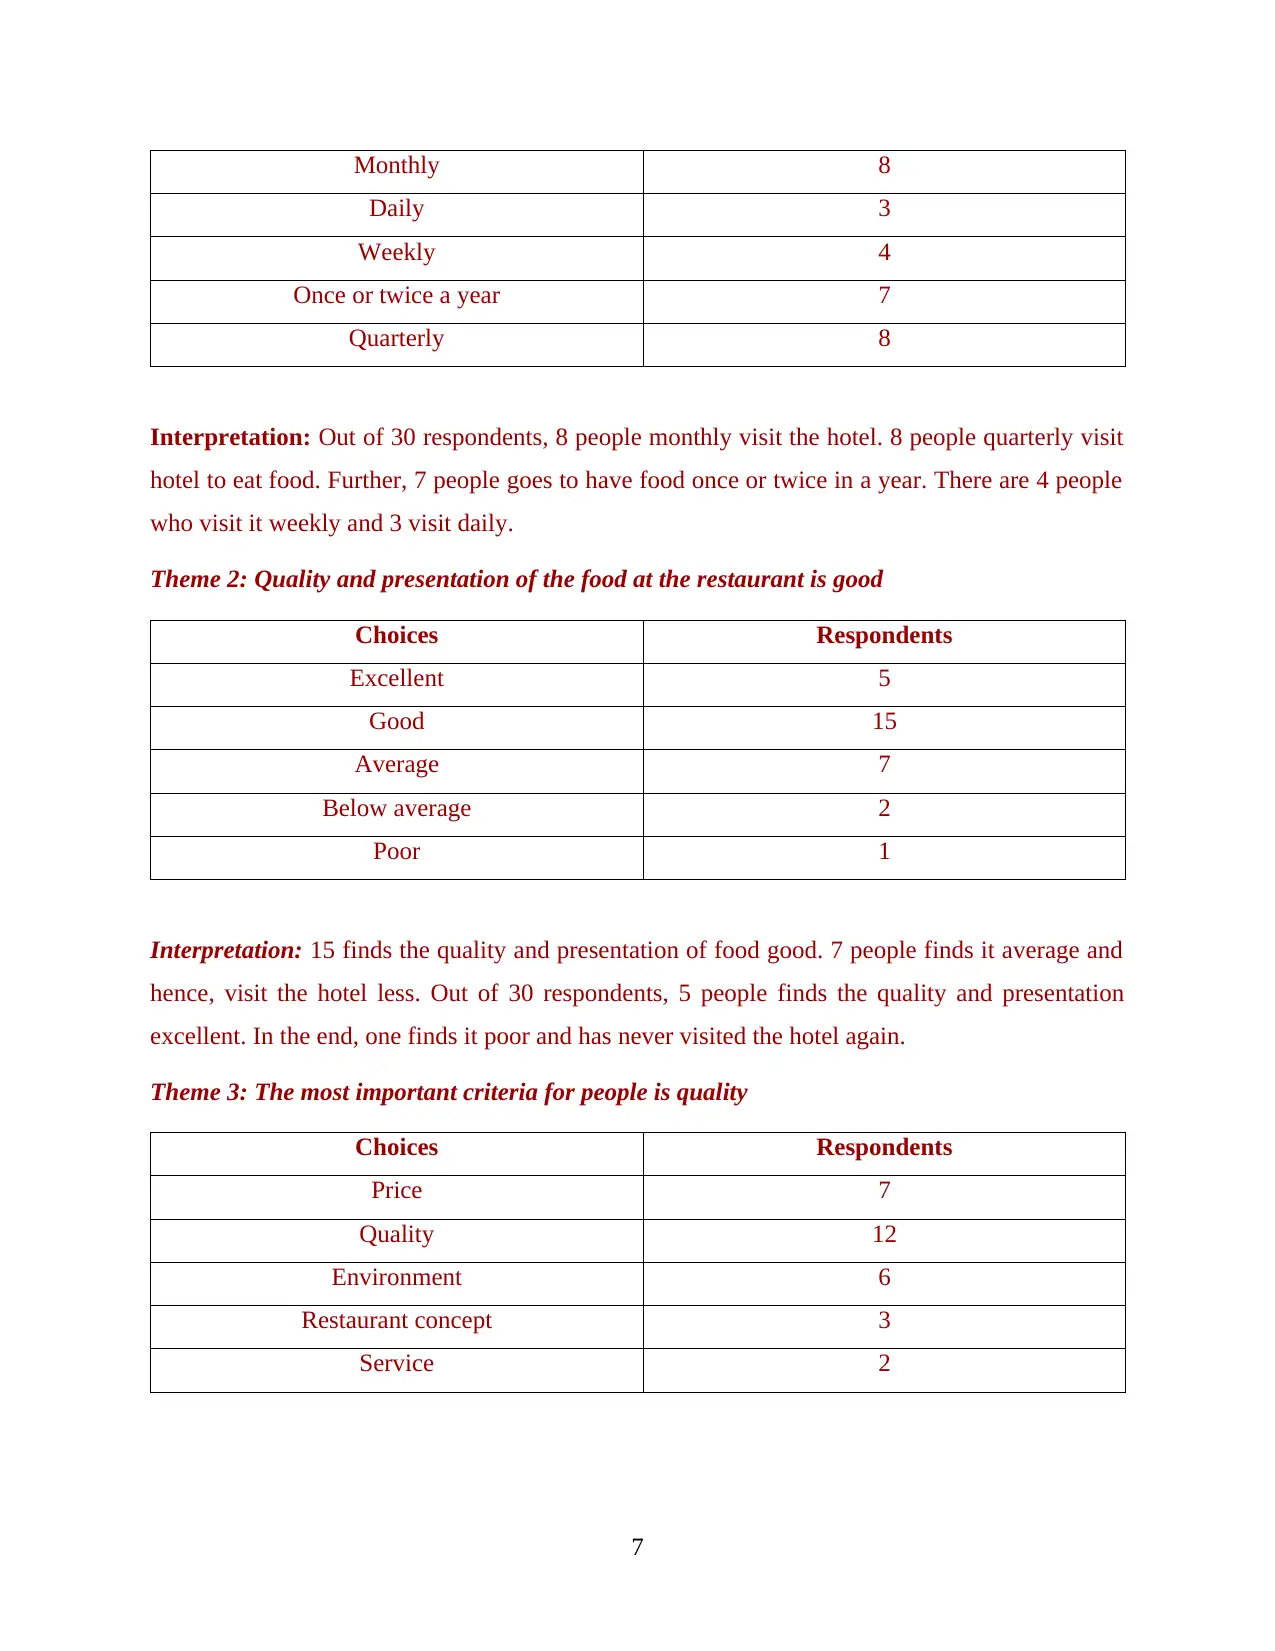
Monthly 8
Daily 3
Weekly 4
Once or twice a year 7
Quarterly 8
Interpretation: Out of 30 respondents, 8 people monthly visit the hotel. 8 people quarterly visit
hotel to eat food. Further, 7 people goes to have food once or twice in a year. There are 4 people
who visit it weekly and 3 visit daily.
Theme 2: Quality and presentation of the food at the restaurant is good
Choices Respondents
Excellent 5
Good 15
Average 7
Below average 2
Poor 1
Interpretation: 15 finds the quality and presentation of food good. 7 people finds it average and
hence, visit the hotel less. Out of 30 respondents, 5 people finds the quality and presentation
excellent. In the end, one finds it poor and has never visited the hotel again.
Theme 3: The most important criteria for people is quality
Choices Respondents
Price 7
Quality 12
Environment 6
Restaurant concept 3
Service 2
7
Paraphrase This Document
Need a fresh take? Get an instant paraphrase of this document with our AI Paraphraser
Interpretation: Out of 30 respondents, 12 people focus on quality of the food before anything.
Further, 7 people finds price as the most important factor. Environment of the place is important
for 6 people. In the ends, service is the most important factor for 2 people.
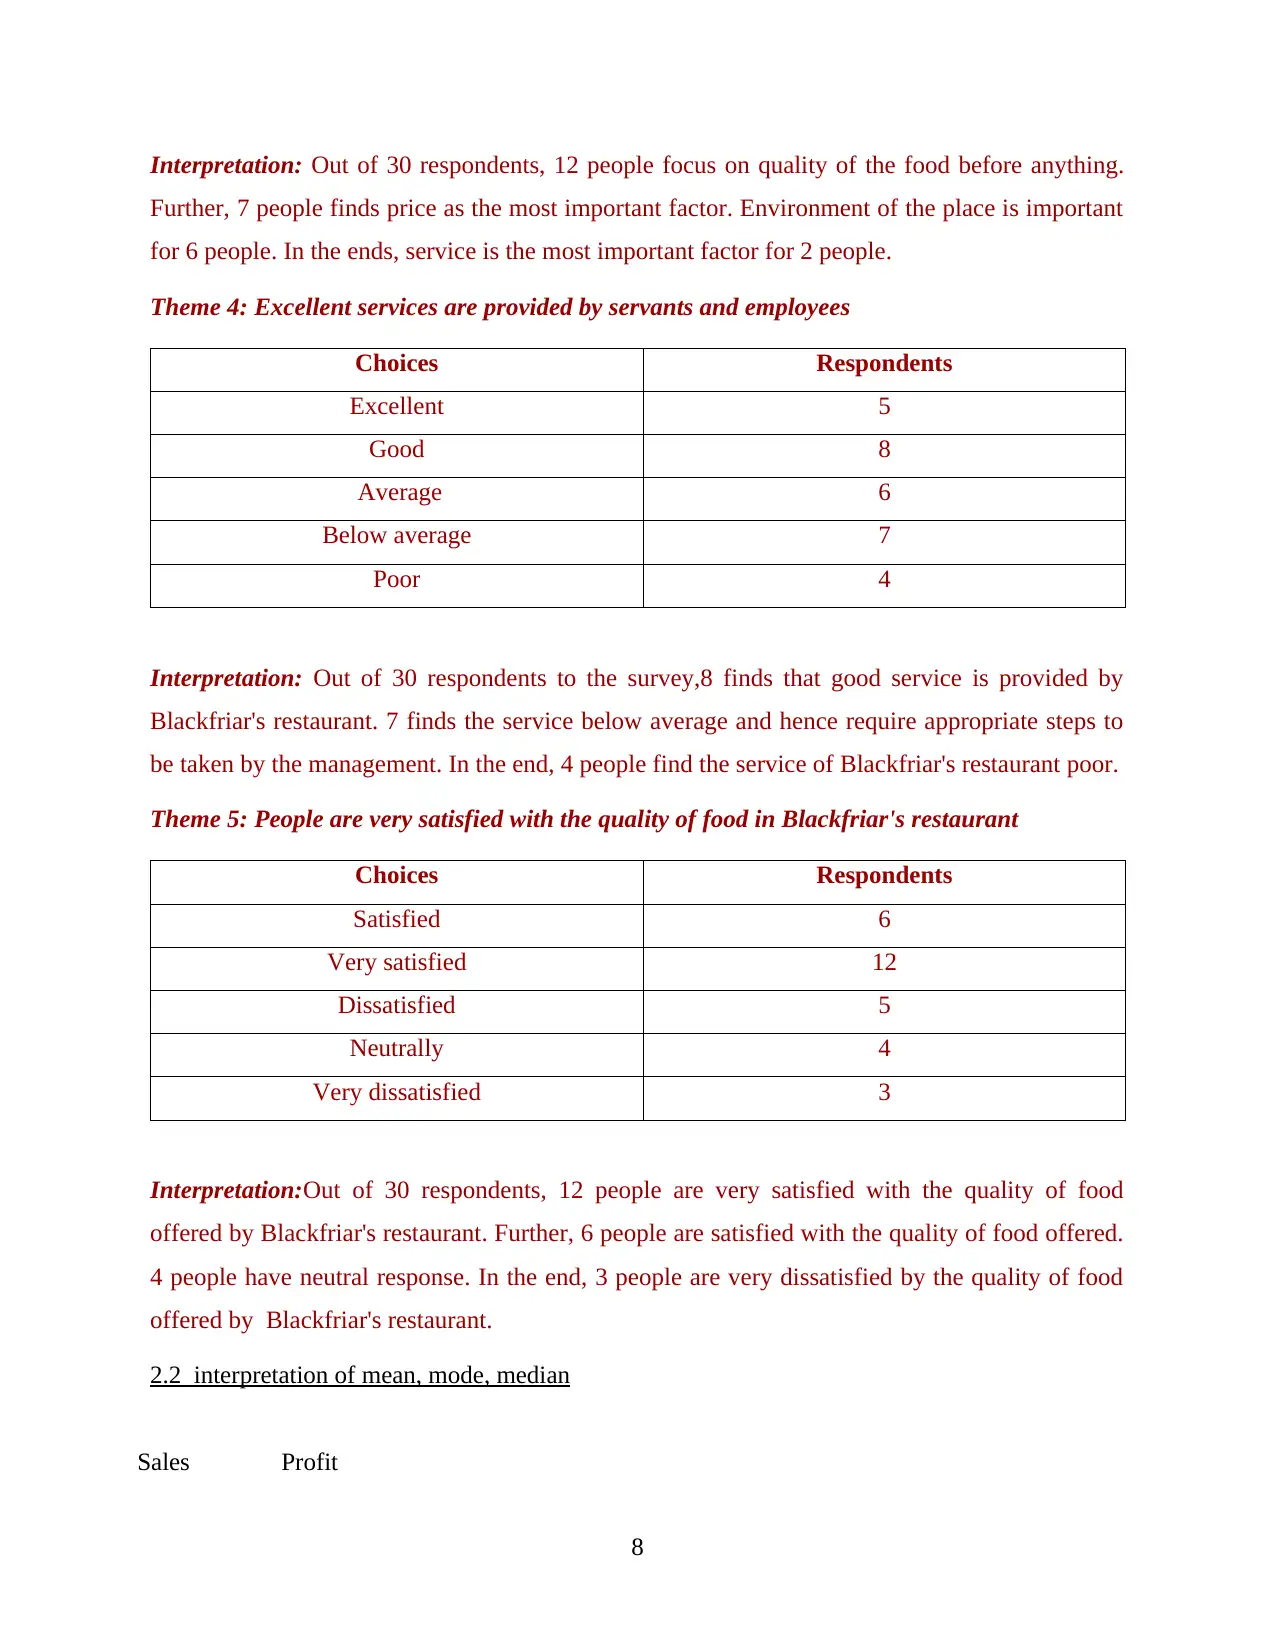
Theme 4: Excellent services are provided by servants and employees
Choices Respondents
Excellent 5
Good 8
Average 6
Below average 7
Poor 4
Interpretation: Out of 30 respondents to the survey,8 finds that good service is provided by
Blackfriar's restaurant. 7 finds the service below average and hence require appropriate steps to
be taken by the management. In the end, 4 people find the service of Blackfriar's restaurant poor.
Theme 5: People are very satisfied with the quality of food in Blackfriar's restaurant
Choices Respondents
Satisfied 6
Very satisfied 12
Dissatisfied 5
Neutrally 4
Very dissatisfied 3
Interpretation:Out of 30 respondents, 12 people are very satisfied with the quality of food
offered by Blackfriar's restaurant. Further, 6 people are satisfied with the quality of food offered.
4 people have neutral response. In the end, 3 people are very dissatisfied by the quality of food
offered by Blackfriar's restaurant.
2.2 interpretation of mean, mode, median
Sales Profit
8
Further, 7 people finds price as the most important factor. Environment of the place is important
for 6 people. In the ends, service is the most important factor for 2 people.
Theme 4: Excellent services are provided by servants and employees
Choices Respondents
Excellent 5
Good 8
Average 6
Below average 7
Poor 4
Interpretation: Out of 30 respondents to the survey,8 finds that good service is provided by
Blackfriar's restaurant. 7 finds the service below average and hence require appropriate steps to
be taken by the management. In the end, 4 people find the service of Blackfriar's restaurant poor.
Theme 5: People are very satisfied with the quality of food in Blackfriar's restaurant
Choices Respondents
Satisfied 6
Very satisfied 12
Dissatisfied 5
Neutrally 4
Very dissatisfied 3
Interpretation:Out of 30 respondents, 12 people are very satisfied with the quality of food
offered by Blackfriar's restaurant. Further, 6 people are satisfied with the quality of food offered.
4 people have neutral response. In the end, 3 people are very dissatisfied by the quality of food
offered by Blackfriar's restaurant.
2.2 interpretation of mean, mode, median
Sales Profit
8
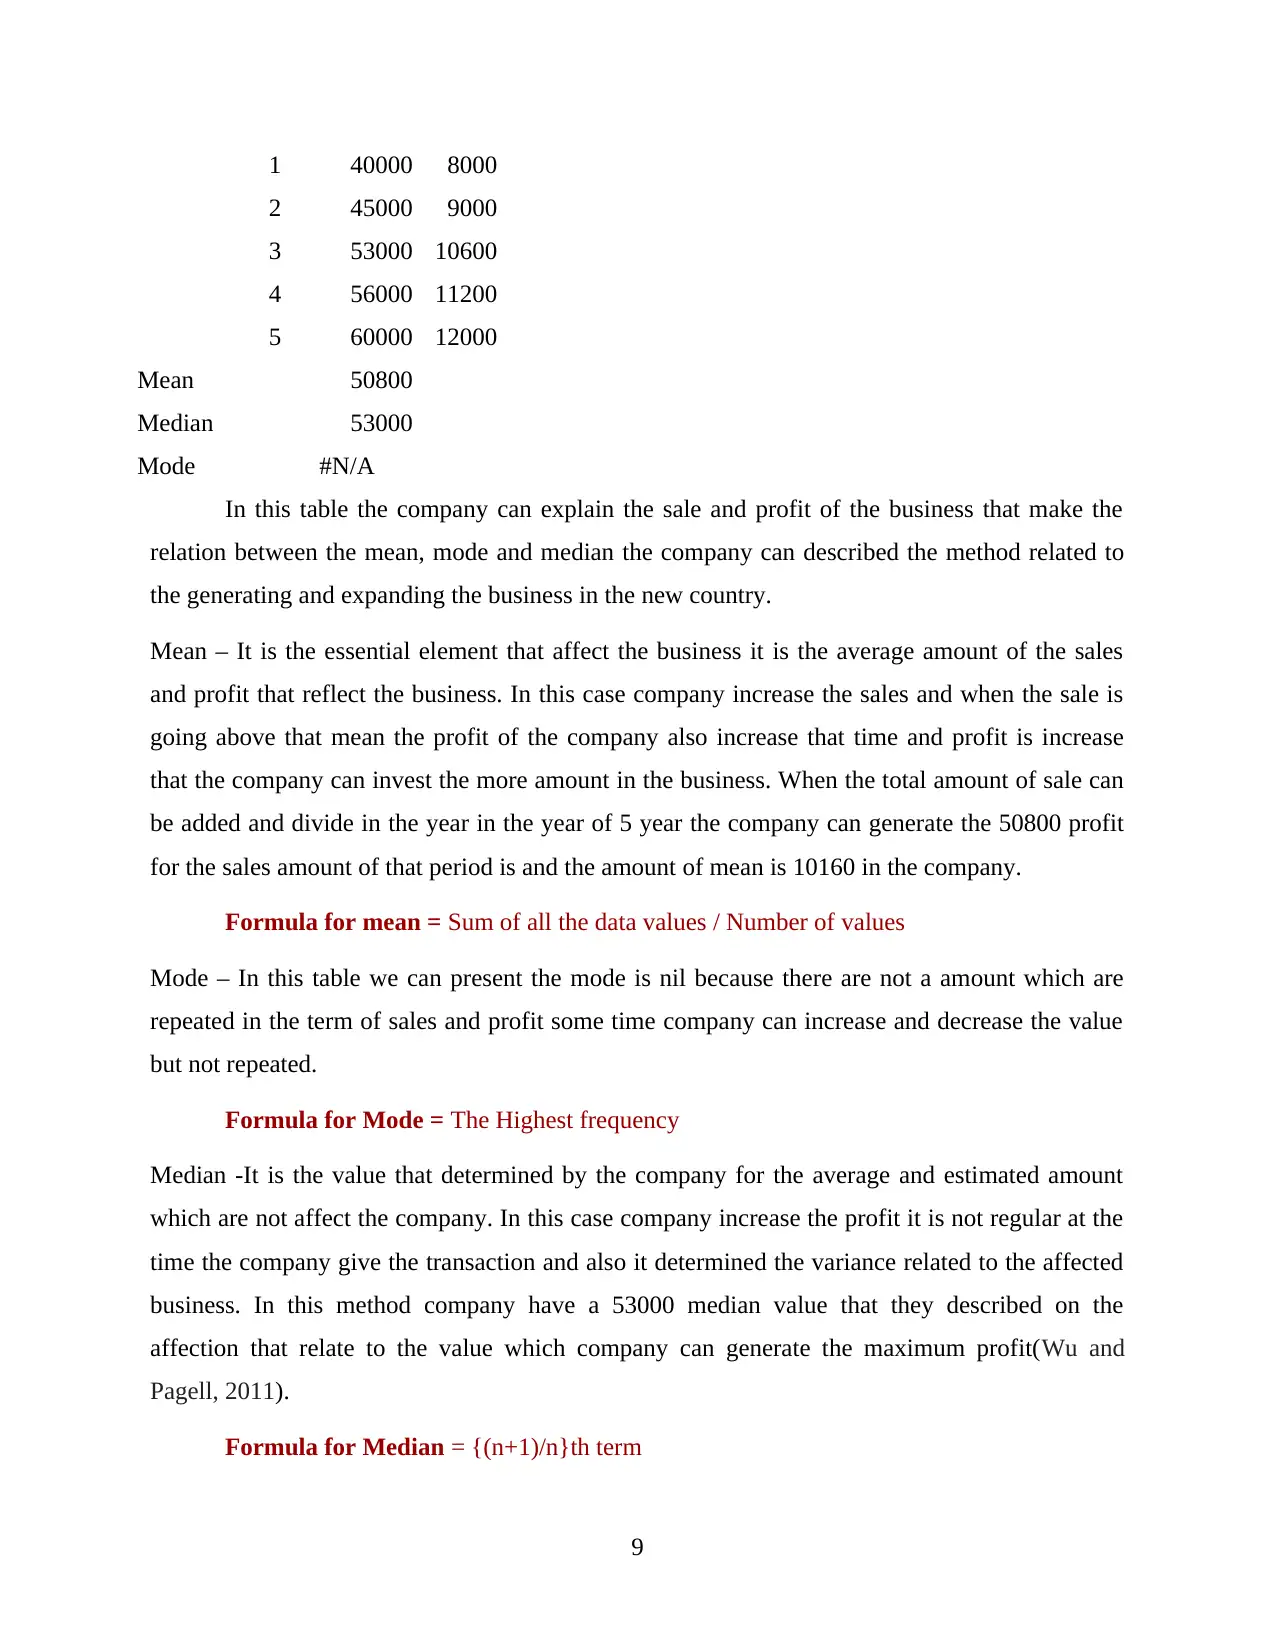
1 40000 8000
2 45000 9000
3 53000 10600
4 56000 11200
5 60000 12000
Mean 50800
Median 53000
Mode #N/A
In this table the company can explain the sale and profit of the business that make the
relation between the mean, mode and median the company can described the method related to
the generating and expanding the business in the new country.
Mean – It is the essential element that affect the business it is the average amount of the sales
and profit that reflect the business. In this case company increase the sales and when the sale is
going above that mean the profit of the company also increase that time and profit is increase
that the company can invest the more amount in the business. When the total amount of sale can
be added and divide in the year in the year of 5 year the company can generate the 50800 profit
for the sales amount of that period is and the amount of mean is 10160 in the company.
Formula for mean = Sum of all the data values / Number of values
Mode – In this table we can present the mode is nil because there are not a amount which are
repeated in the term of sales and profit some time company can increase and decrease the value
but not repeated.
Formula for Mode = The Highest frequency
Median -It is the value that determined by the company for the average and estimated amount
which are not affect the company. In this case company increase the profit it is not regular at the
time the company give the transaction and also it determined the variance related to the affected
business. In this method company have a 53000 median value that they described on the
affection that relate to the value which company can generate the maximum profit(Wu and
Pagell, 2011).
Formula for Median = {(n+1)/n}th term
9
⊘ This is a preview!⊘
Do you want full access?
Subscribe today to unlock all pages.
Trusted by 1+ million students worldwide
1 out of 30
Related Documents


Your All-in-One AI-Powered Toolkit for Academic Success.
+13062052269
info@desklib.com
Available 24*7 on WhatsApp / Email
![[object Object]](/_next/static/media/star-bottom.7253800d.svg)
Unlock your academic potential
Copyright © 2020–2026 A2Z Services. All Rights Reserved. Developed and managed by ZUCOL.