Business Decision Making Report: WWT E-Cigarette Market Analysis
VerifiedAdded on 2020/01/21
|19
|4308
|101
Report
AI Summary
This report focuses on the decision-making process within the context of World Wide Tobacco (WWT), specifically analyzing the e-cigarette market. It begins with an introduction to the importance of decision-making in business, emphasizing the use of primary and secondary data sources. Task 1 details the collection of primary data through survey methodology, questionnaire design, and sampling techniques, and secondary data from Imperial Tobacco group. Task 2 delves into statistical analysis, including cumulative frequency, quartiles, mean, mode, median, semi-interquartile range, standard deviation, and correlation coefficients to analyze the collected data. Task 3 covers graphical representations and trend line creation for forecasting, culminating in a business presentation and formal report. Task 4 explores information processing tools and project planning. Task 5 uses financial tools for decision-making. The report provides a comprehensive overview of the e-cigarette market for WWT, using statistical and financial tools to make informed business decisions.

BUSINESS DECISION
MAKING
MAKING
Paraphrase This Document
Need a fresh take? Get an instant paraphrase of this document with our AI Paraphraser
Table of Contents
INTRODUCTION......................................................................................................................1
TASK 1......................................................................................................................................1
AC 1.1 Collection of primary and secondary data............................................................1
AC 1.2 Survey methodology and sampling frame for data collection..............................1
AC 1.3 Designing a questionnaire....................................................................................2
TASK 2......................................................................................................................................4
AC 2.1 Cumulative frequency of the table.......................................................................4
AC 2.1, 2.3 Lower quartile, upper quartile, mean, mode and median..............................4
AC 2.3 Value of semi inter-quartile range........................................................................5
AC 2.4, 2.2 Analysis of the results...................................................................................6
AC 2.3 Calculation of standard deviation and range........................................................7
TASK 3......................................................................................................................................8
AC 3.1 Graphical representation.......................................................................................8
AC 3.2 Creating trend line for forecasting......................................................................10
AC 3.3 Preparation of business presentation..................................................................12
AC 3.4 Formal business report.......................................................................................12
TASK 4....................................................................................................................................12
AC 4.1 Appropriate information processing tool...........................................................12
AC 4.2 Prepare a project plan for an activity to determine critical path........................13
TASK 5 ...................................................................................................................................14
AC 4.3 Using financial tool for decision-making...........................................................14
CONCLUSION........................................................................................................................16
REFERENCES.........................................................................................................................17
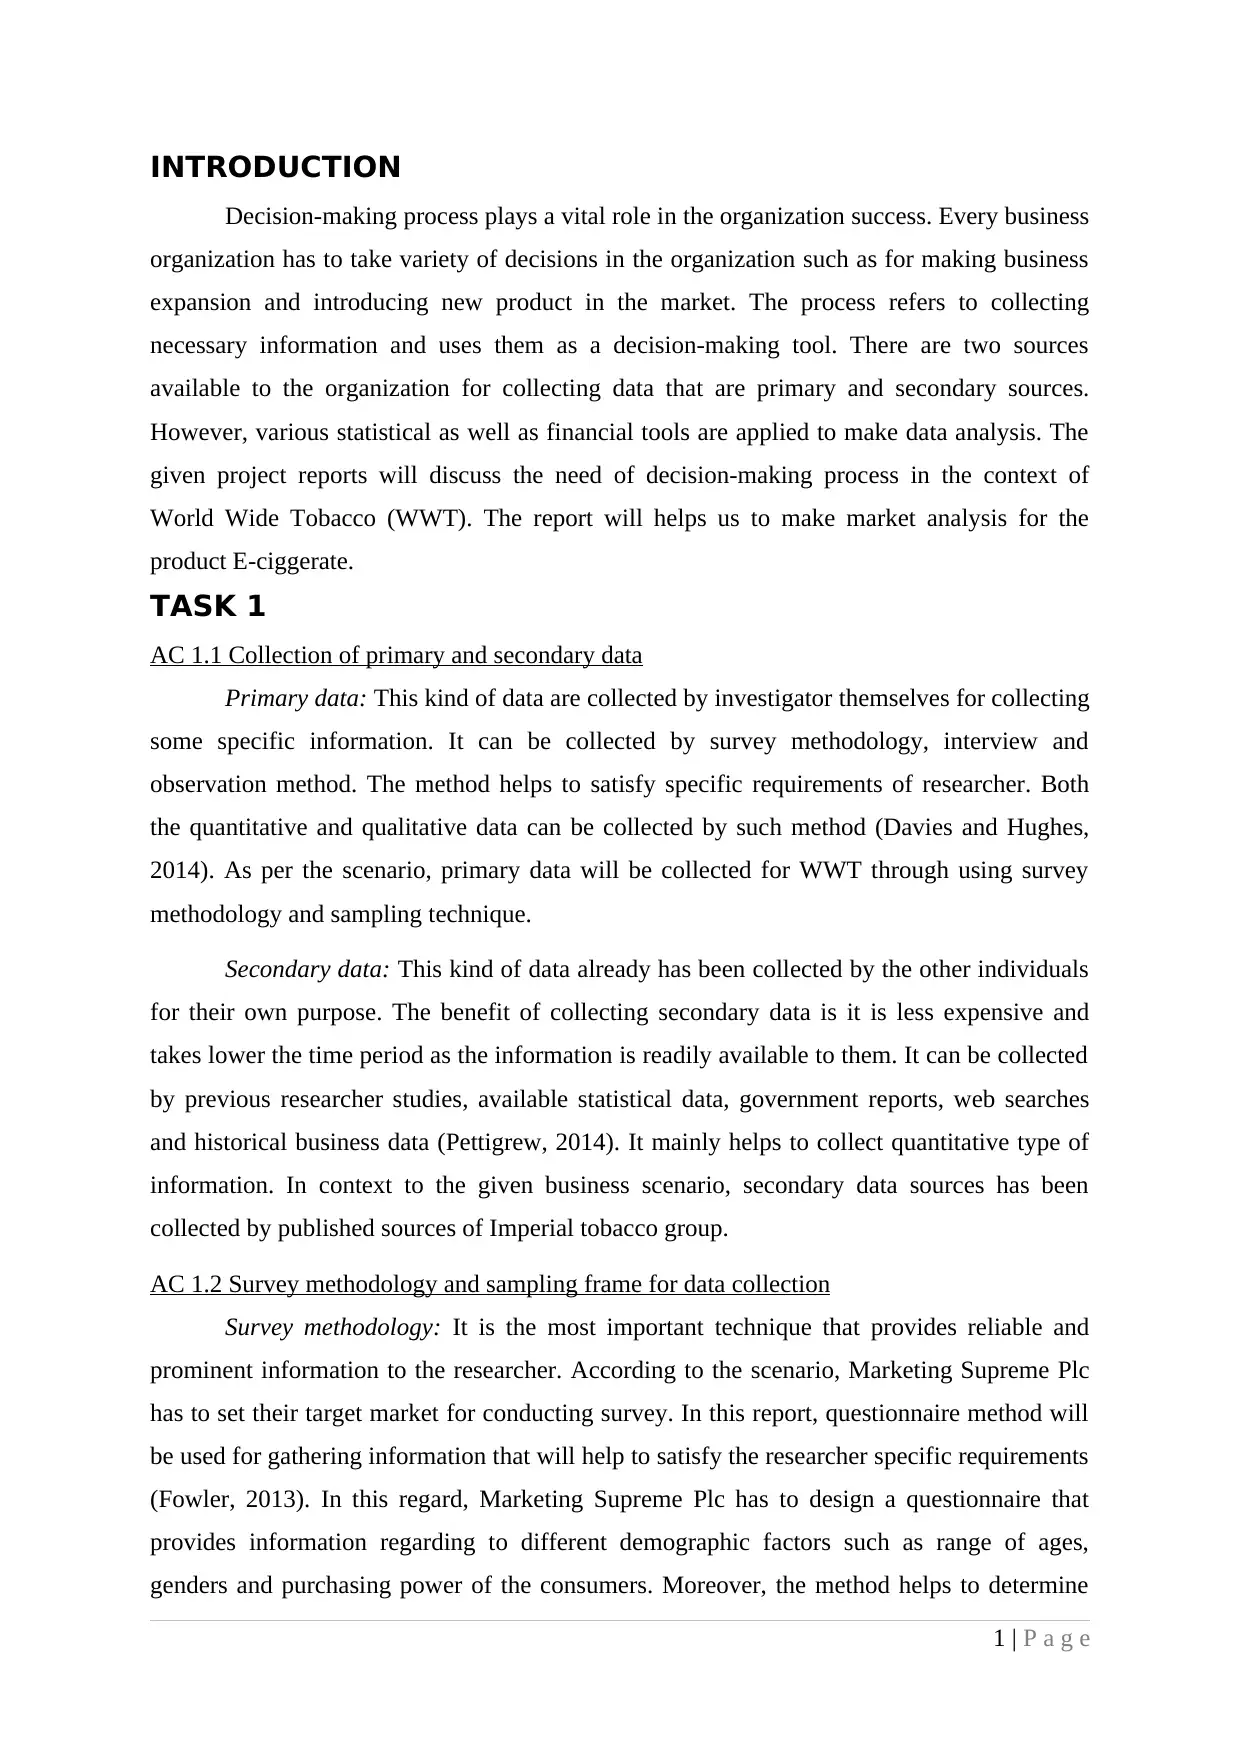
INTRODUCTION
Decision-making process plays a vital role in the organization success. Every business
organization has to take variety of decisions in the organization such as for making business
expansion and introducing new product in the market. The process refers to collecting
necessary information and uses them as a decision-making tool. There are two sources
available to the organization for collecting data that are primary and secondary sources.
However, various statistical as well as financial tools are applied to make data analysis. The
given project reports will discuss the need of decision-making process in the context of
World Wide Tobacco (WWT). The report will helps us to make market analysis for the
product E-ciggerate.
TASK 1
AC 1.1 Collection of primary and secondary data
Primary data: This kind of data are collected by investigator themselves for collecting
some specific information. It can be collected by survey methodology, interview and
observation method. The method helps to satisfy specific requirements of researcher. Both
the quantitative and qualitative data can be collected by such method (Davies and Hughes,
2014). As per the scenario, primary data will be collected for WWT through using survey
methodology and sampling technique.
Secondary data: This kind of data already has been collected by the other individuals
for their own purpose. The benefit of collecting secondary data is it is less expensive and
takes lower the time period as the information is readily available to them. It can be collected
by previous researcher studies, available statistical data, government reports, web searches
and historical business data (Pettigrew, 2014). It mainly helps to collect quantitative type of
information. In context to the given business scenario, secondary data sources has been
collected by published sources of Imperial tobacco group.
AC 1.2 Survey methodology and sampling frame for data collection
Survey methodology: It is the most important technique that provides reliable and
prominent information to the researcher. According to the scenario, Marketing Supreme Plc
has to set their target market for conducting survey. In this report, questionnaire method will
be used for gathering information that will help to satisfy the researcher specific requirements
(Fowler, 2013). In this regard, Marketing Supreme Plc has to design a questionnaire that
provides information regarding to different demographic factors such as range of ages,
genders and purchasing power of the consumers. Moreover, the method helps to determine
1 | P a g e
⊘ This is a preview!⊘
Do you want full access?
Subscribe today to unlock all pages.
Trusted by 1+ million students worldwide
consumer’s consumption and buying patterns and their preferences (Solomon and et. al.,
2014). The benefit of the method is that it provides accurate information and filled by the
respondents hence, helps to eliminate any bias. Furthermore, web questionnaire can be
designed and can be filled through sending e-mail helps to collect information at a wider
space. Another benefit of the method is that it takes very less time to fill up.
Sampling frame: Along with the survey methodology, sampling frame can also be
used. Studying the universe or all the population seems to be very difficult task for the
business. Therefore, the method says that universe can be studied by identifying the
information related to a representative sample. The sampling frame tells that Marketing
Supreme Plc has to decide an appropriate size of sample and it should be representative to
whole universe. Sample can be selected by various methods such as random sampling and
non random sampling techniques. Under the random sampling techniques, all the units of the
population have an equal chance or probability of inclusion in sample (Molenberghs, n.d.).
However, under the non random sampling technique, sample can be constructed using any
basis hence, it is relatively convenient for the researcher. According to the scenario, sample
of 60 customers has been taken by random sampling method. All the consumers are using E-
cigarettes product to a great extent. The reason for using the method is that sampling error
can be determined hence provides more reliable and authentic information to the business.
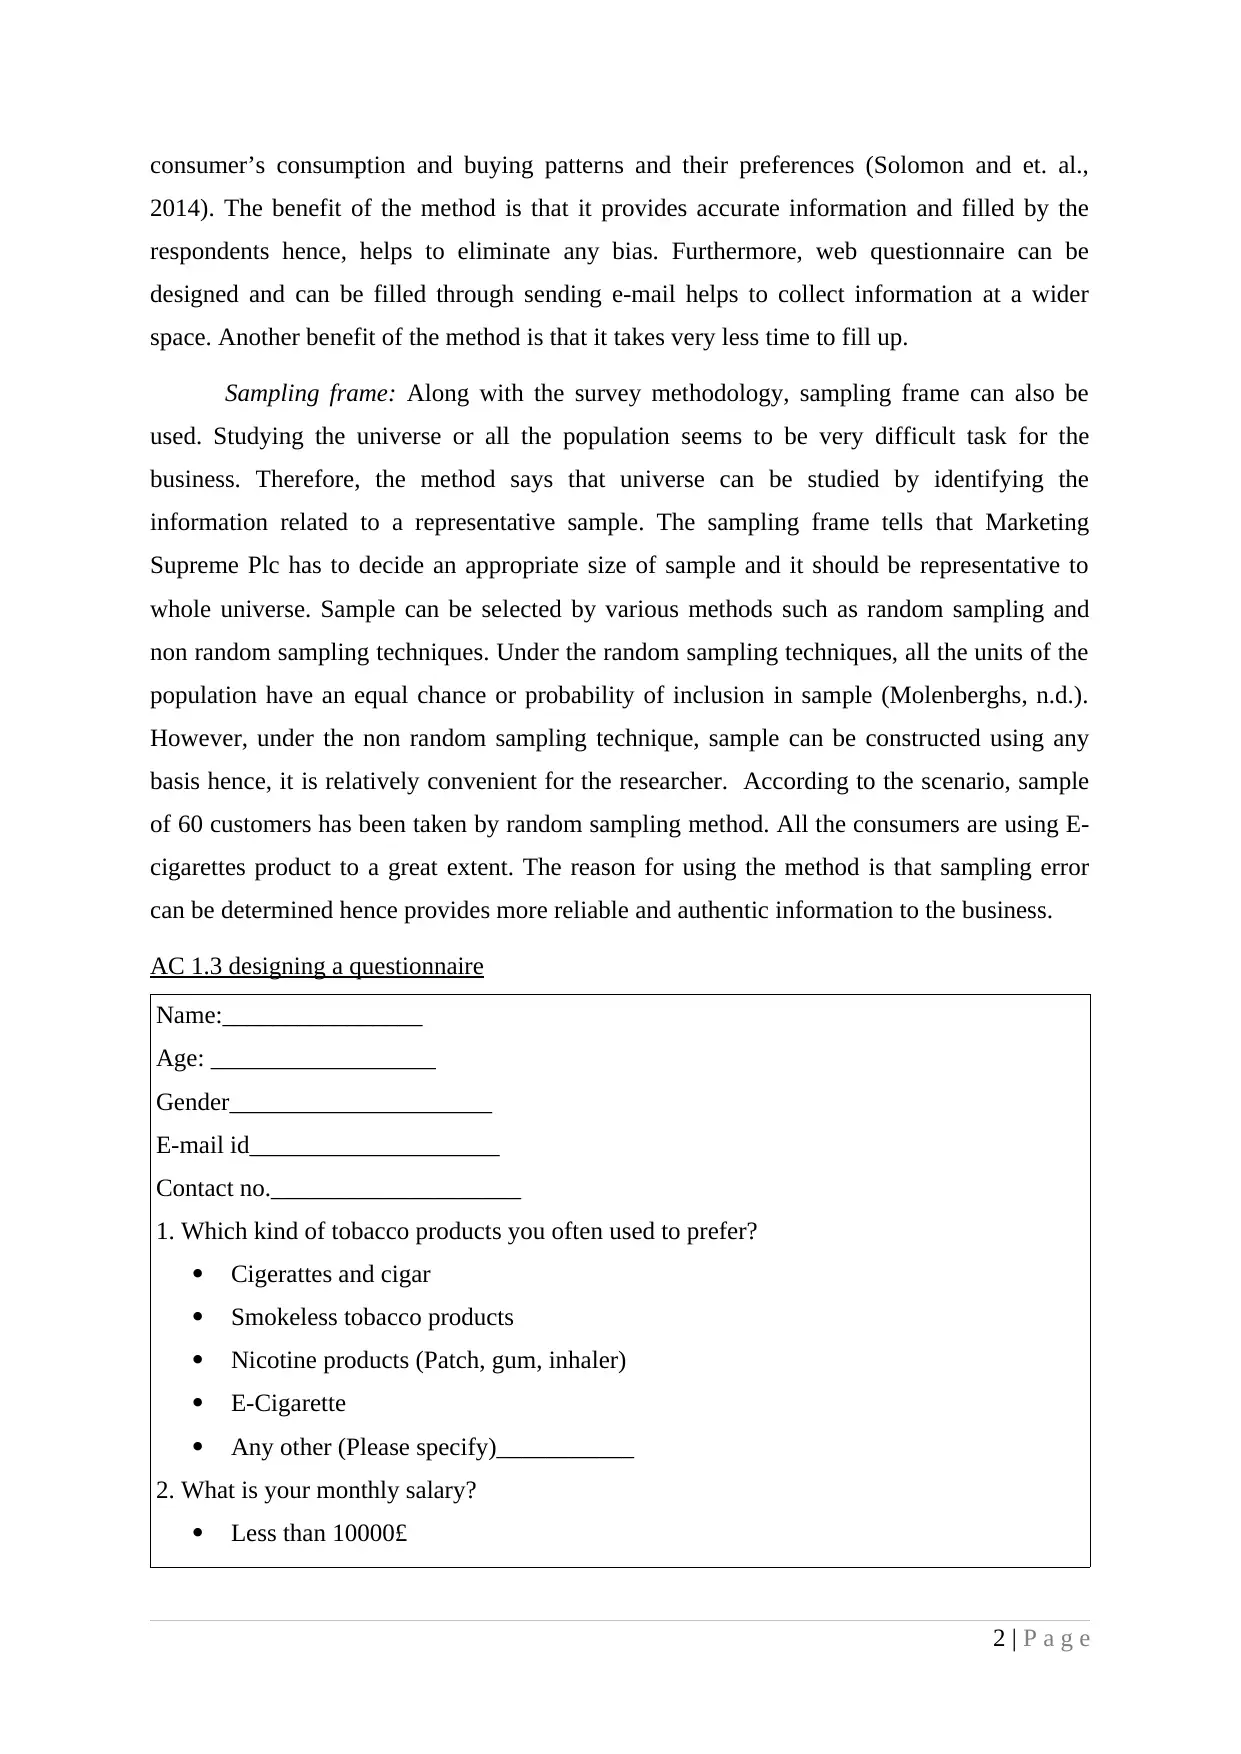
AC 1.3 designing a questionnaire
Name:________________
Age: __________________
Gender_____________________
E-mail id____________________
Contact no.____________________
1. Which kind of tobacco products you often used to prefer?
Cigerattes and cigar
Smokeless tobacco products
Nicotine products (Patch, gum, inhaler)
E-Cigarette
Any other (Please specify)___________
2. What is your monthly salary?
Less than 10000£
2 | P a g e
2014). The benefit of the method is that it provides accurate information and filled by the
respondents hence, helps to eliminate any bias. Furthermore, web questionnaire can be
designed and can be filled through sending e-mail helps to collect information at a wider
space. Another benefit of the method is that it takes very less time to fill up.
Sampling frame: Along with the survey methodology, sampling frame can also be
used. Studying the universe or all the population seems to be very difficult task for the
business. Therefore, the method says that universe can be studied by identifying the
information related to a representative sample. The sampling frame tells that Marketing
Supreme Plc has to decide an appropriate size of sample and it should be representative to
whole universe. Sample can be selected by various methods such as random sampling and
non random sampling techniques. Under the random sampling techniques, all the units of the
population have an equal chance or probability of inclusion in sample (Molenberghs, n.d.).
However, under the non random sampling technique, sample can be constructed using any
basis hence, it is relatively convenient for the researcher. According to the scenario, sample
of 60 customers has been taken by random sampling method. All the consumers are using E-
cigarettes product to a great extent. The reason for using the method is that sampling error
can be determined hence provides more reliable and authentic information to the business.
AC 1.3 designing a questionnaire
Name:________________
Age: __________________
Gender_____________________
E-mail id____________________
Contact no.____________________
1. Which kind of tobacco products you often used to prefer?
Cigerattes and cigar
Smokeless tobacco products
Nicotine products (Patch, gum, inhaler)
E-Cigarette
Any other (Please specify)___________
2. What is your monthly salary?
Less than 10000£
2 | P a g e
Paraphrase This Document
Need a fresh take? Get an instant paraphrase of this document with our AI Paraphraser
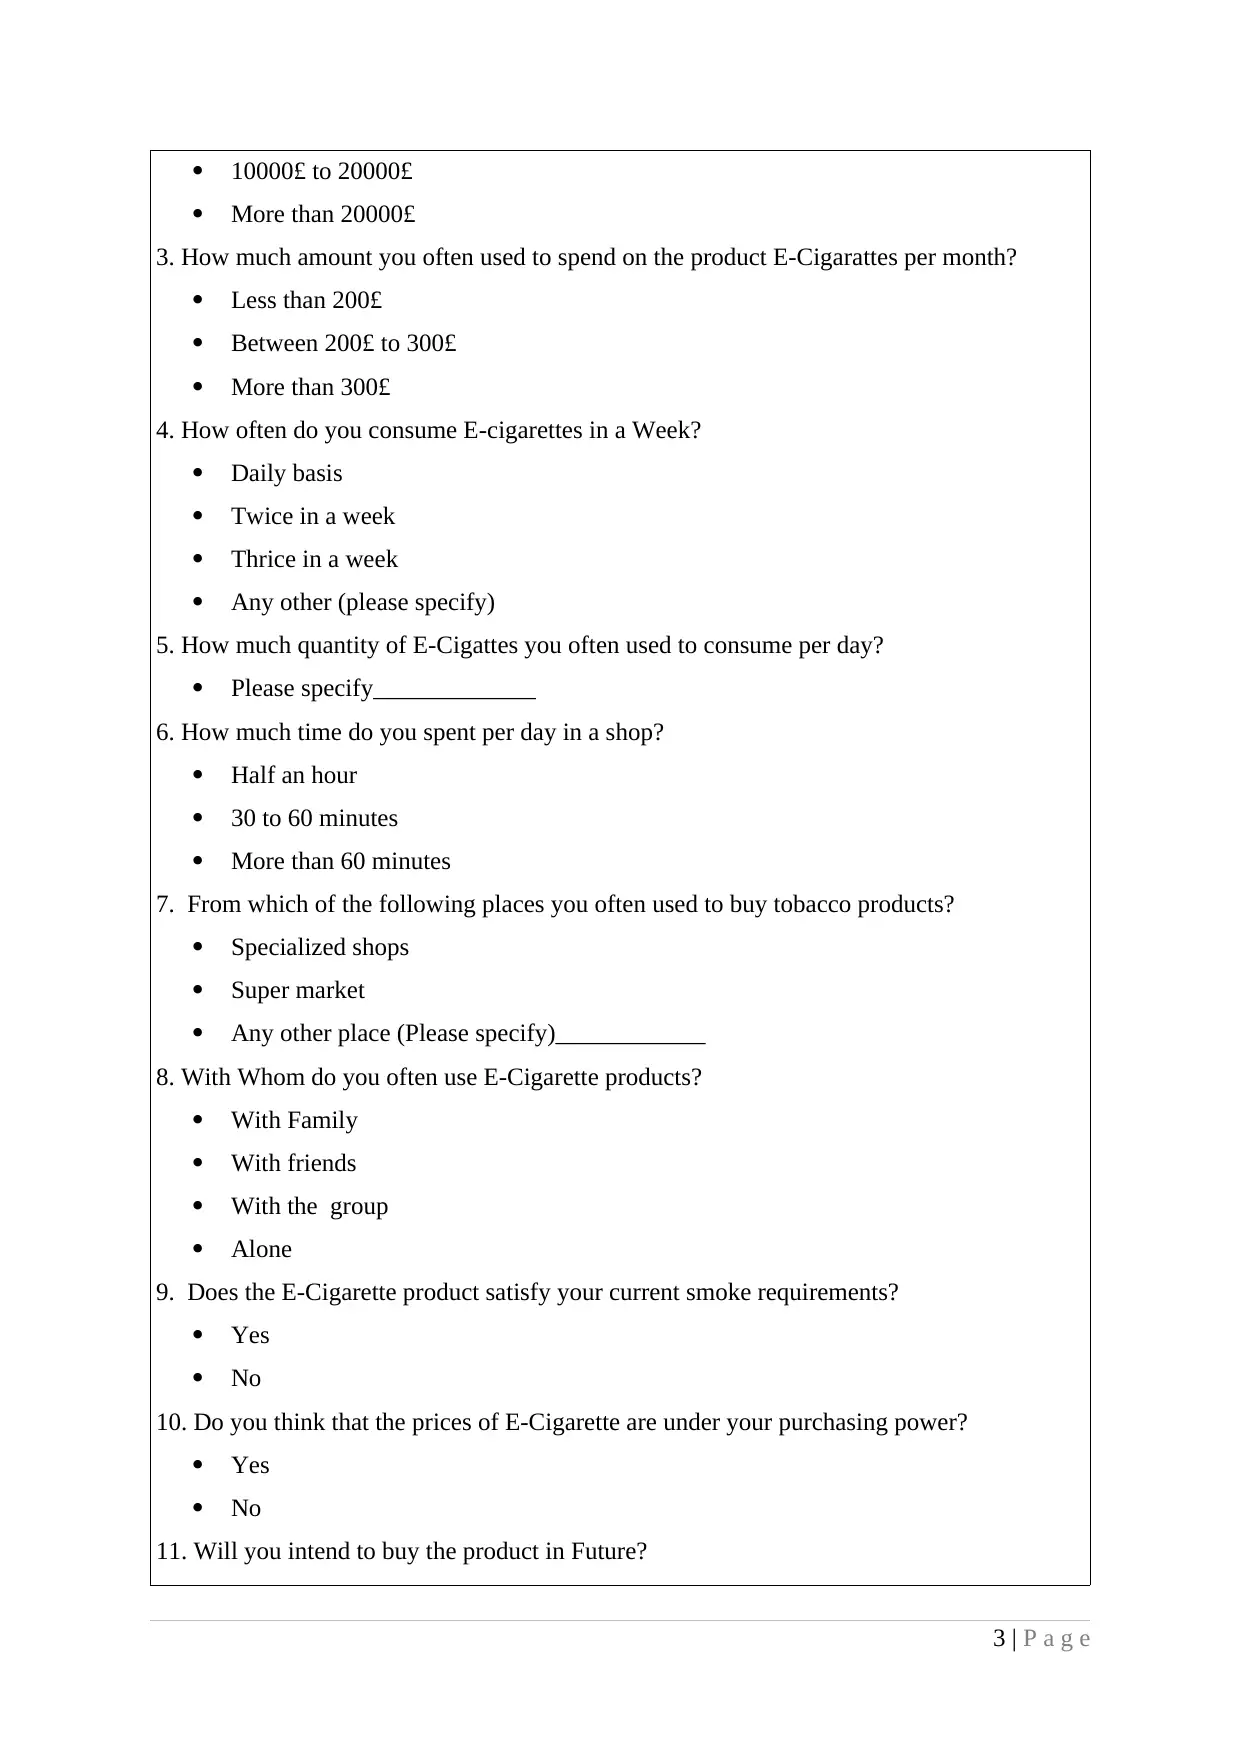
10000£ to 20000£
More than 20000£
3. How much amount you often used to spend on the product E-Cigarattes per month?
Less than 200£
Between 200£ to 300£
More than 300£
4. How often do you consume E-cigarettes in a Week?
Daily basis
Twice in a week
Thrice in a week
Any other (please specify)
5. How much quantity of E-Cigattes you often used to consume per day?
Please specify_____________
6. How much time do you spent per day in a shop?
Half an hour
30 to 60 minutes
More than 60 minutes
7. From which of the following places you often used to buy tobacco products?
Specialized shops
Super market
Any other place (Please specify)____________
8. With Whom do you often use E-Cigarette products?
With Family
With friends
With the group
Alone
9. Does the E-Cigarette product satisfy your current smoke requirements?
Yes
No
10. Do you think that the prices of E-Cigarette are under your purchasing power?
Yes
No
11. Will you intend to buy the product in Future?
3 | P a g e
Yes
No
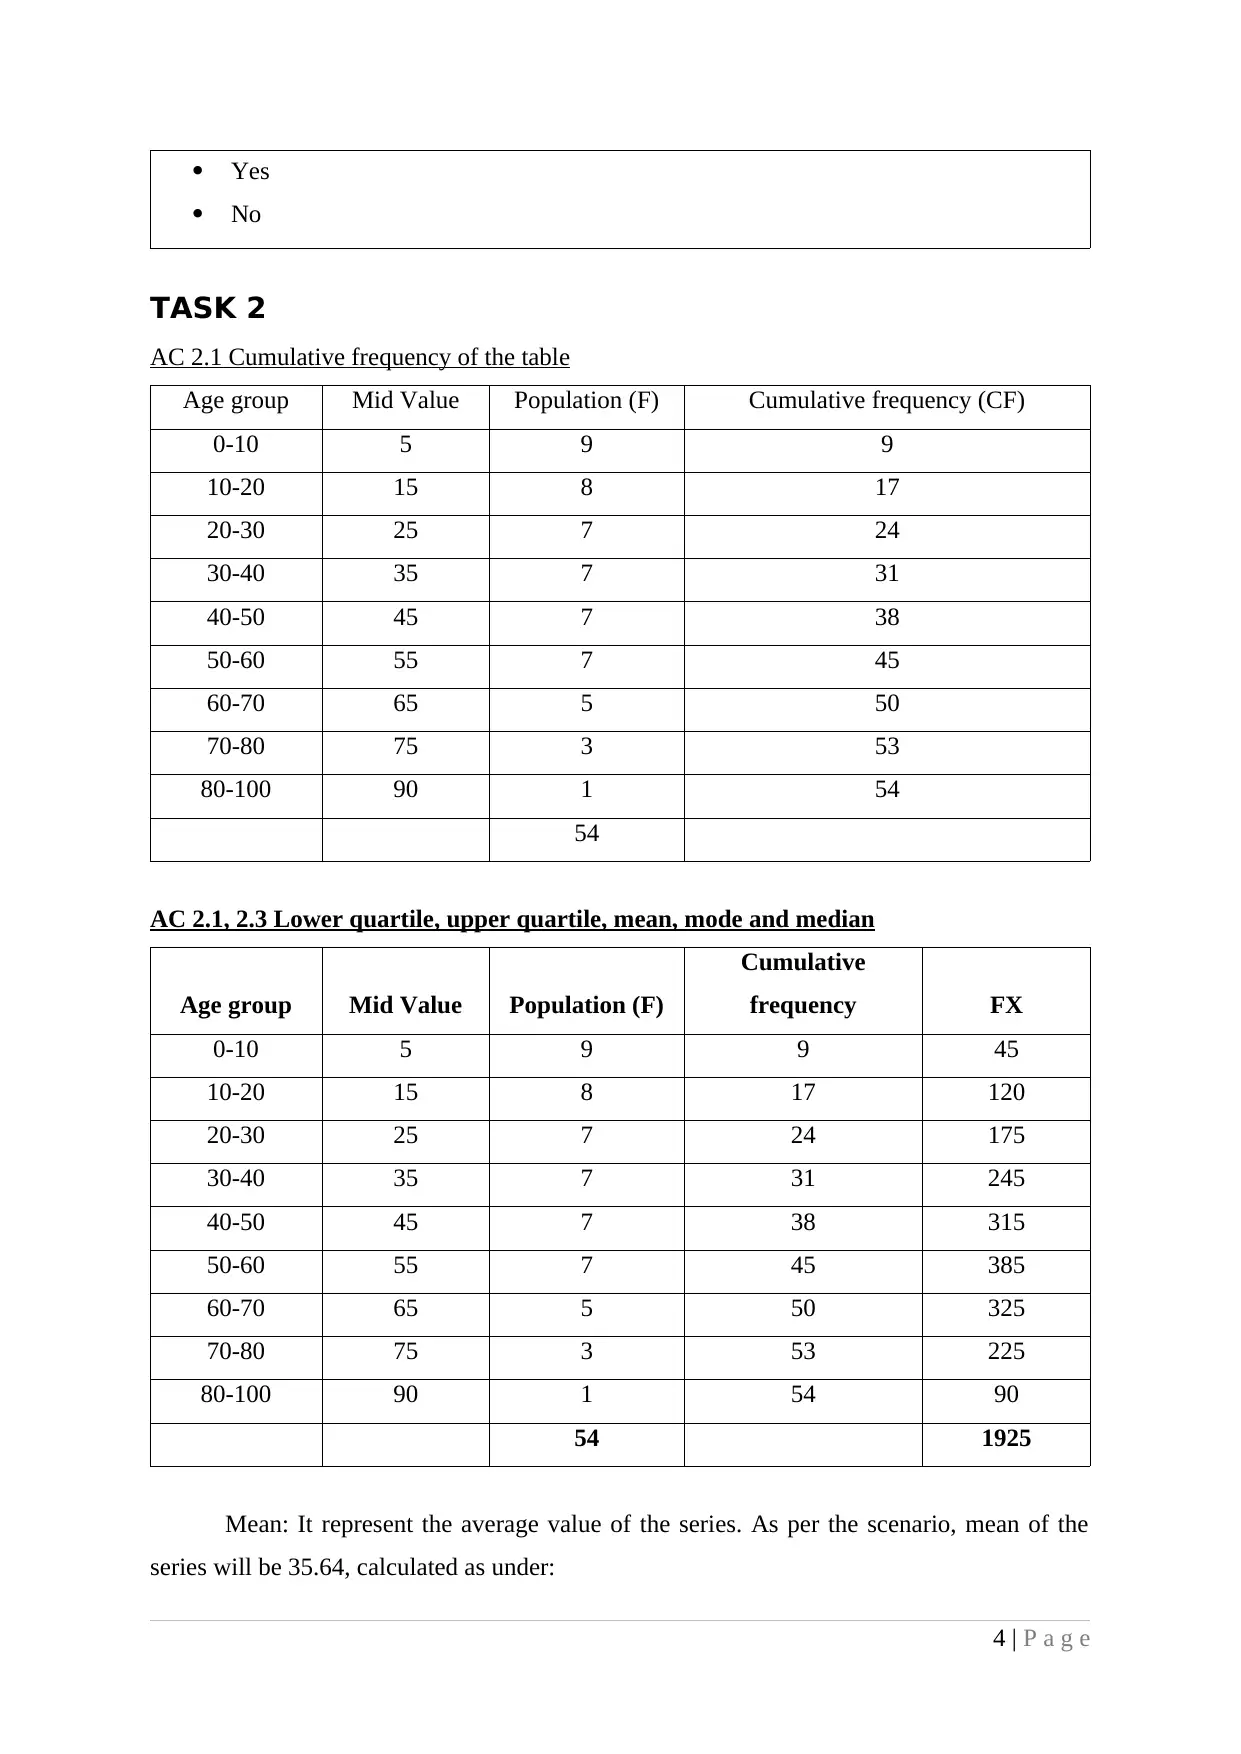
TASK 2
AC 2.1 Cumulative frequency of the table
Age group Mid Value Population (F) Cumulative frequency (CF)
0-10 5 9 9
10-20 15 8 17
20-30 25 7 24
30-40 35 7 31
40-50 45 7 38
50-60 55 7 45
60-70 65 5 50
70-80 75 3 53
80-100 90 1 54
54
AC 2.1, 2.3 Lower quartile, upper quartile, mean, mode and median
Age group Mid Value Population (F)
Cumulative
frequency FX
0-10 5 9 9 45
10-20 15 8 17 120
20-30 25 7 24 175
30-40 35 7 31 245
40-50 45 7 38 315
50-60 55 7 45 385
60-70 65 5 50 325
70-80 75 3 53 225
80-100 90 1 54 90
54 1925
Mean: It represent the average value of the series. As per the scenario, mean of the
series will be 35.64, calculated as under:
4 | P a g e
No
TASK 2
AC 2.1 Cumulative frequency of the table
Age group Mid Value Population (F) Cumulative frequency (CF)
0-10 5 9 9
10-20 15 8 17
20-30 25 7 24
30-40 35 7 31
40-50 45 7 38
50-60 55 7 45
60-70 65 5 50
70-80 75 3 53
80-100 90 1 54
54
AC 2.1, 2.3 Lower quartile, upper quartile, mean, mode and median
Age group Mid Value Population (F)
Cumulative
frequency FX
0-10 5 9 9 45
10-20 15 8 17 120
20-30 25 7 24 175
30-40 35 7 31 245
40-50 45 7 38 315
50-60 55 7 45 385
60-70 65 5 50 325
70-80 75 3 53 225
80-100 90 1 54 90
54 1925
Mean: It represent the average value of the series. As per the scenario, mean of the
series will be 35.64, calculated as under:
4 | P a g e
⊘ This is a preview!⊘
Do you want full access?
Subscribe today to unlock all pages.
Trusted by 1+ million students worldwide
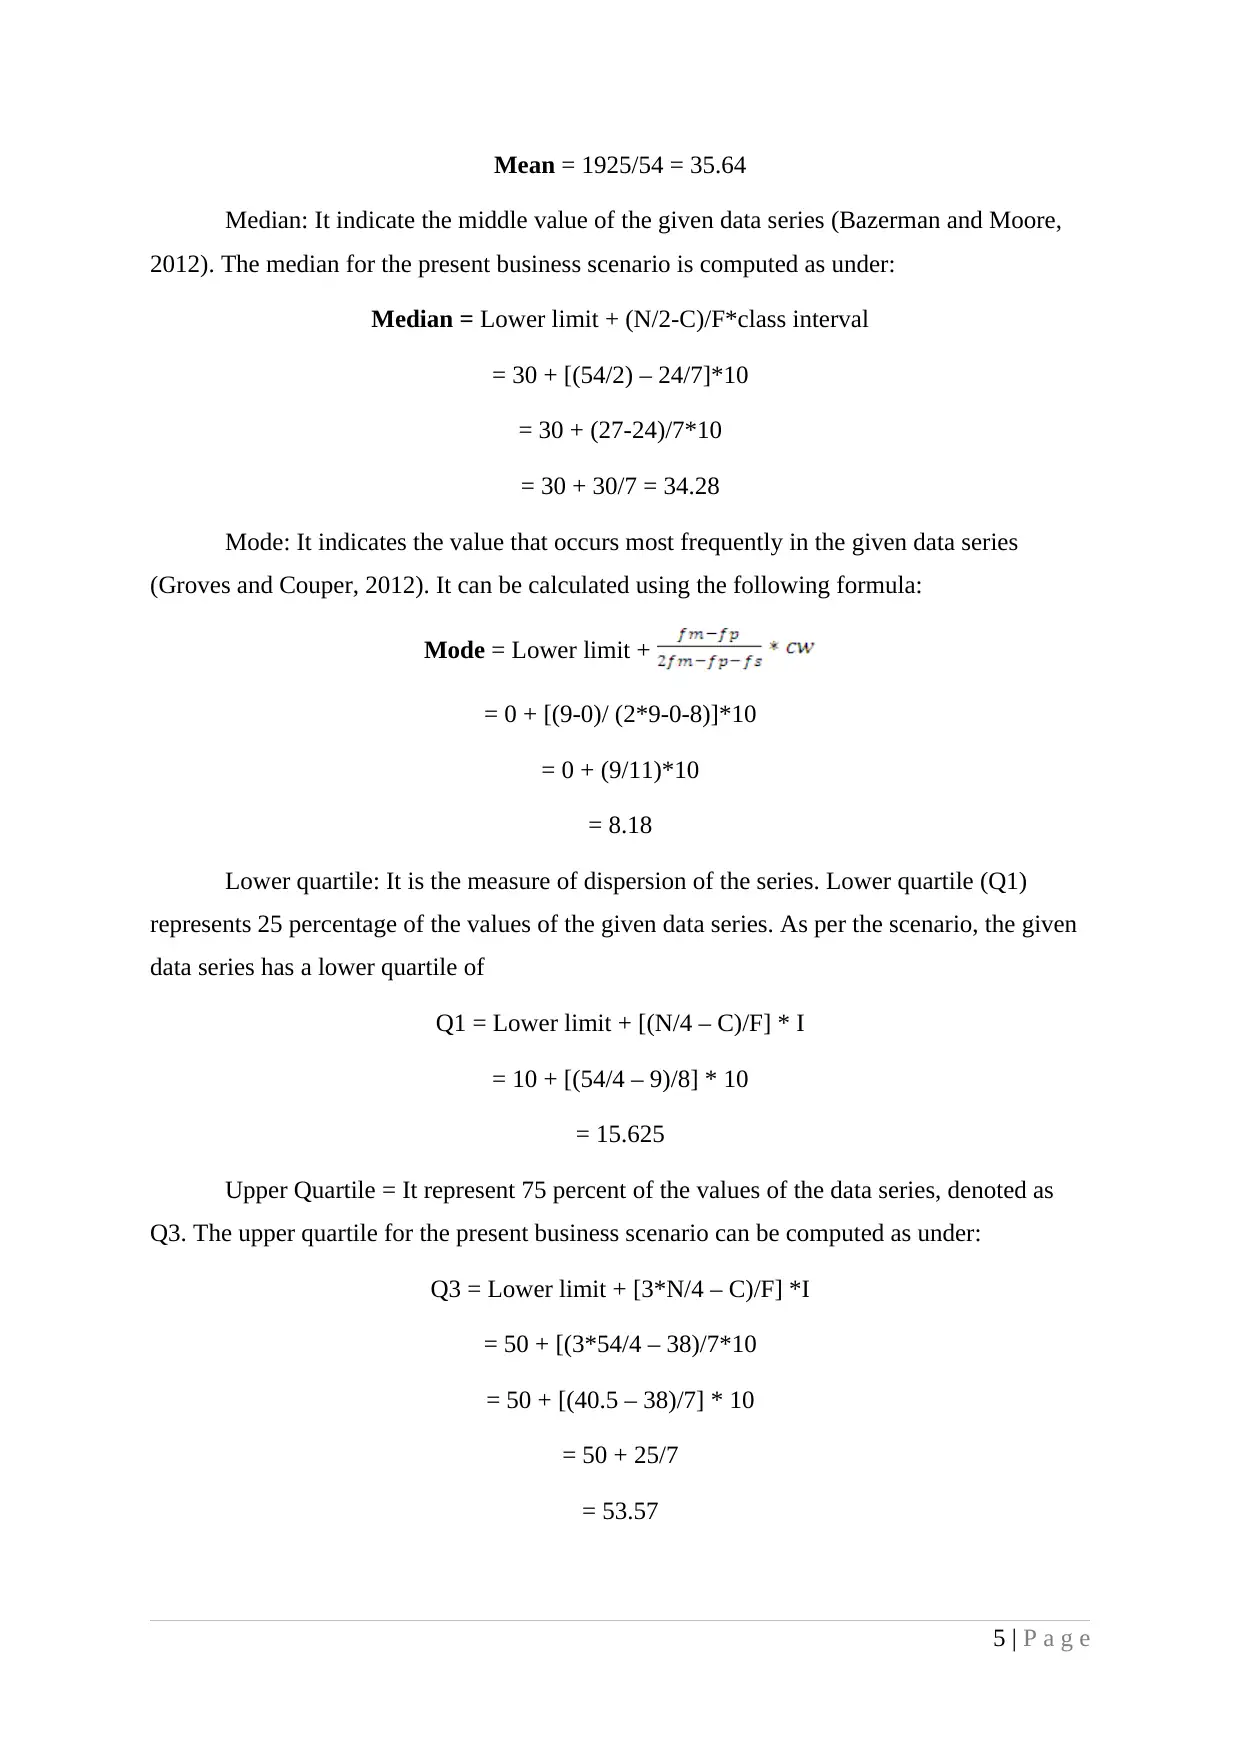
Mean = 1925/54 = 35.64
Median: It indicate the middle value of the given data series (Bazerman and Moore,
2012). The median for the present business scenario is computed as under:
Median = Lower limit + (N/2-C)/F*class interval
= 30 + [(54/2) – 24/7]*10
= 30 + (27-24)/7*10
= 30 + 30/7 = 34.28
Mode: It indicates the value that occurs most frequently in the given data series
(Groves and Couper, 2012). It can be calculated using the following formula:
Mode = Lower limit +
= 0 + [(9-0)/ (2*9-0-8)]*10
= 0 + (9/11)*10
= 8.18
Lower quartile: It is the measure of dispersion of the series. Lower quartile (Q1)
represents 25 percentage of the values of the given data series. As per the scenario, the given
data series has a lower quartile of
Q1 = Lower limit + [(N/4 – C)/F] * I
= 10 + [(54/4 – 9)/8] * 10
= 15.625
Upper Quartile = It represent 75 percent of the values of the data series, denoted as
Q3. The upper quartile for the present business scenario can be computed as under:
Q3 = Lower limit + [3*N/4 – C)/F] *I
= 50 + [(3*54/4 – 38)/7*10
= 50 + [(40.5 – 38)/7] * 10
= 50 + 25/7
= 53.57
5 | P a g e
Paraphrase This Document
Need a fresh take? Get an instant paraphrase of this document with our AI Paraphraser
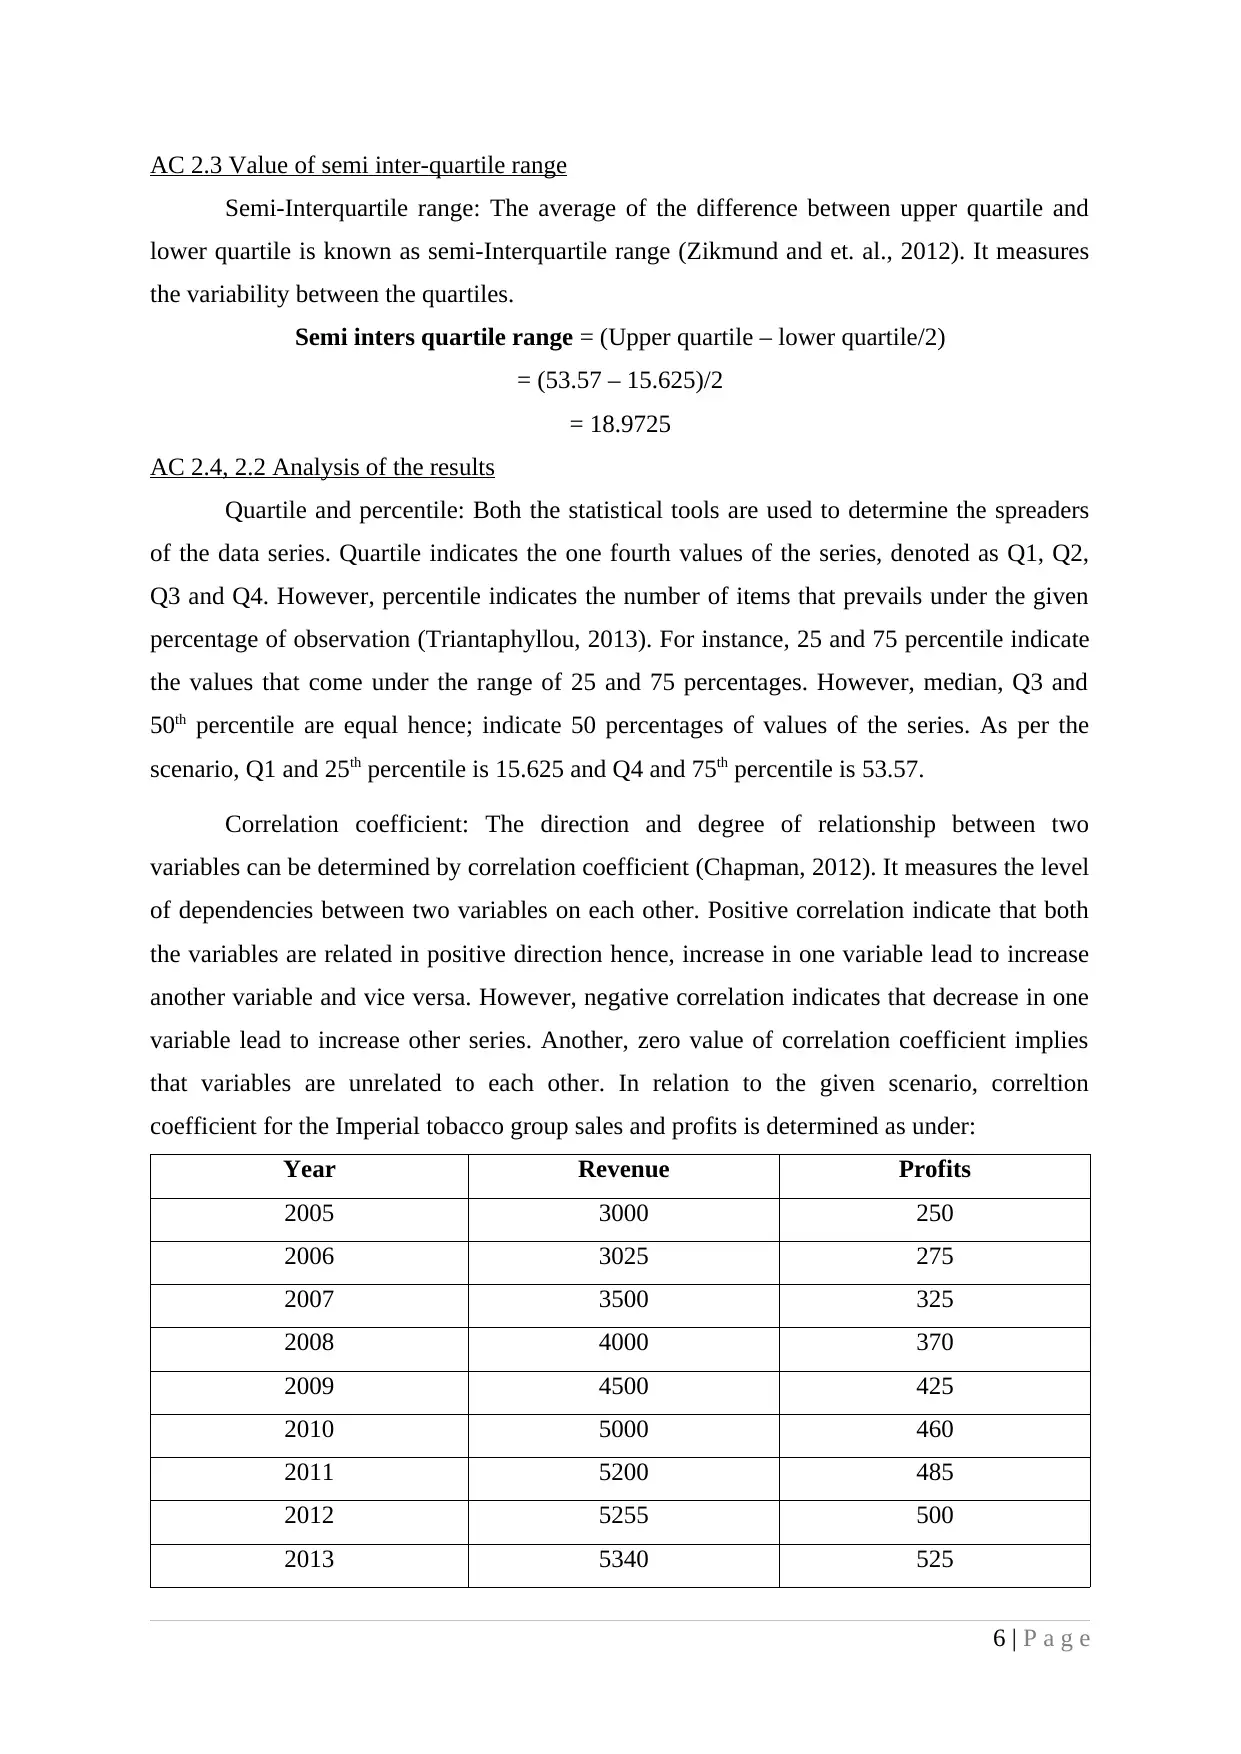
AC 2.3 Value of semi inter-quartile range
Semi-Interquartile range: The average of the difference between upper quartile and
lower quartile is known as semi-Interquartile range (Zikmund and et. al., 2012). It measures
the variability between the quartiles.
Semi inters quartile range = (Upper quartile – lower quartile/2)
= (53.57 – 15.625)/2
= 18.9725
AC 2.4, 2.2 Analysis of the results
Quartile and percentile: Both the statistical tools are used to determine the spreaders
of the data series. Quartile indicates the one fourth values of the series, denoted as Q1, Q2,
Q3 and Q4. However, percentile indicates the number of items that prevails under the given
percentage of observation (Triantaphyllou, 2013). For instance, 25 and 75 percentile indicate
the values that come under the range of 25 and 75 percentages. However, median, Q3 and
50th percentile are equal hence; indicate 50 percentages of values of the series. As per the
scenario, Q1 and 25th percentile is 15.625 and Q4 and 75th percentile is 53.57.
Correlation coefficient: The direction and degree of relationship between two
variables can be determined by correlation coefficient (Chapman, 2012). It measures the level
of dependencies between two variables on each other. Positive correlation indicate that both
the variables are related in positive direction hence, increase in one variable lead to increase
another variable and vice versa. However, negative correlation indicates that decrease in one
variable lead to increase other series. Another, zero value of correlation coefficient implies
that variables are unrelated to each other. In relation to the given scenario, correltion
coefficient for the Imperial tobacco group sales and profits is determined as under:
Year Revenue Profits
2005 3000 250
2006 3025 275
2007 3500 325
2008 4000 370
2009 4500 425
2010 5000 460
2011 5200 485
2012 5255 500
2013 5340 525
6 | P a g e
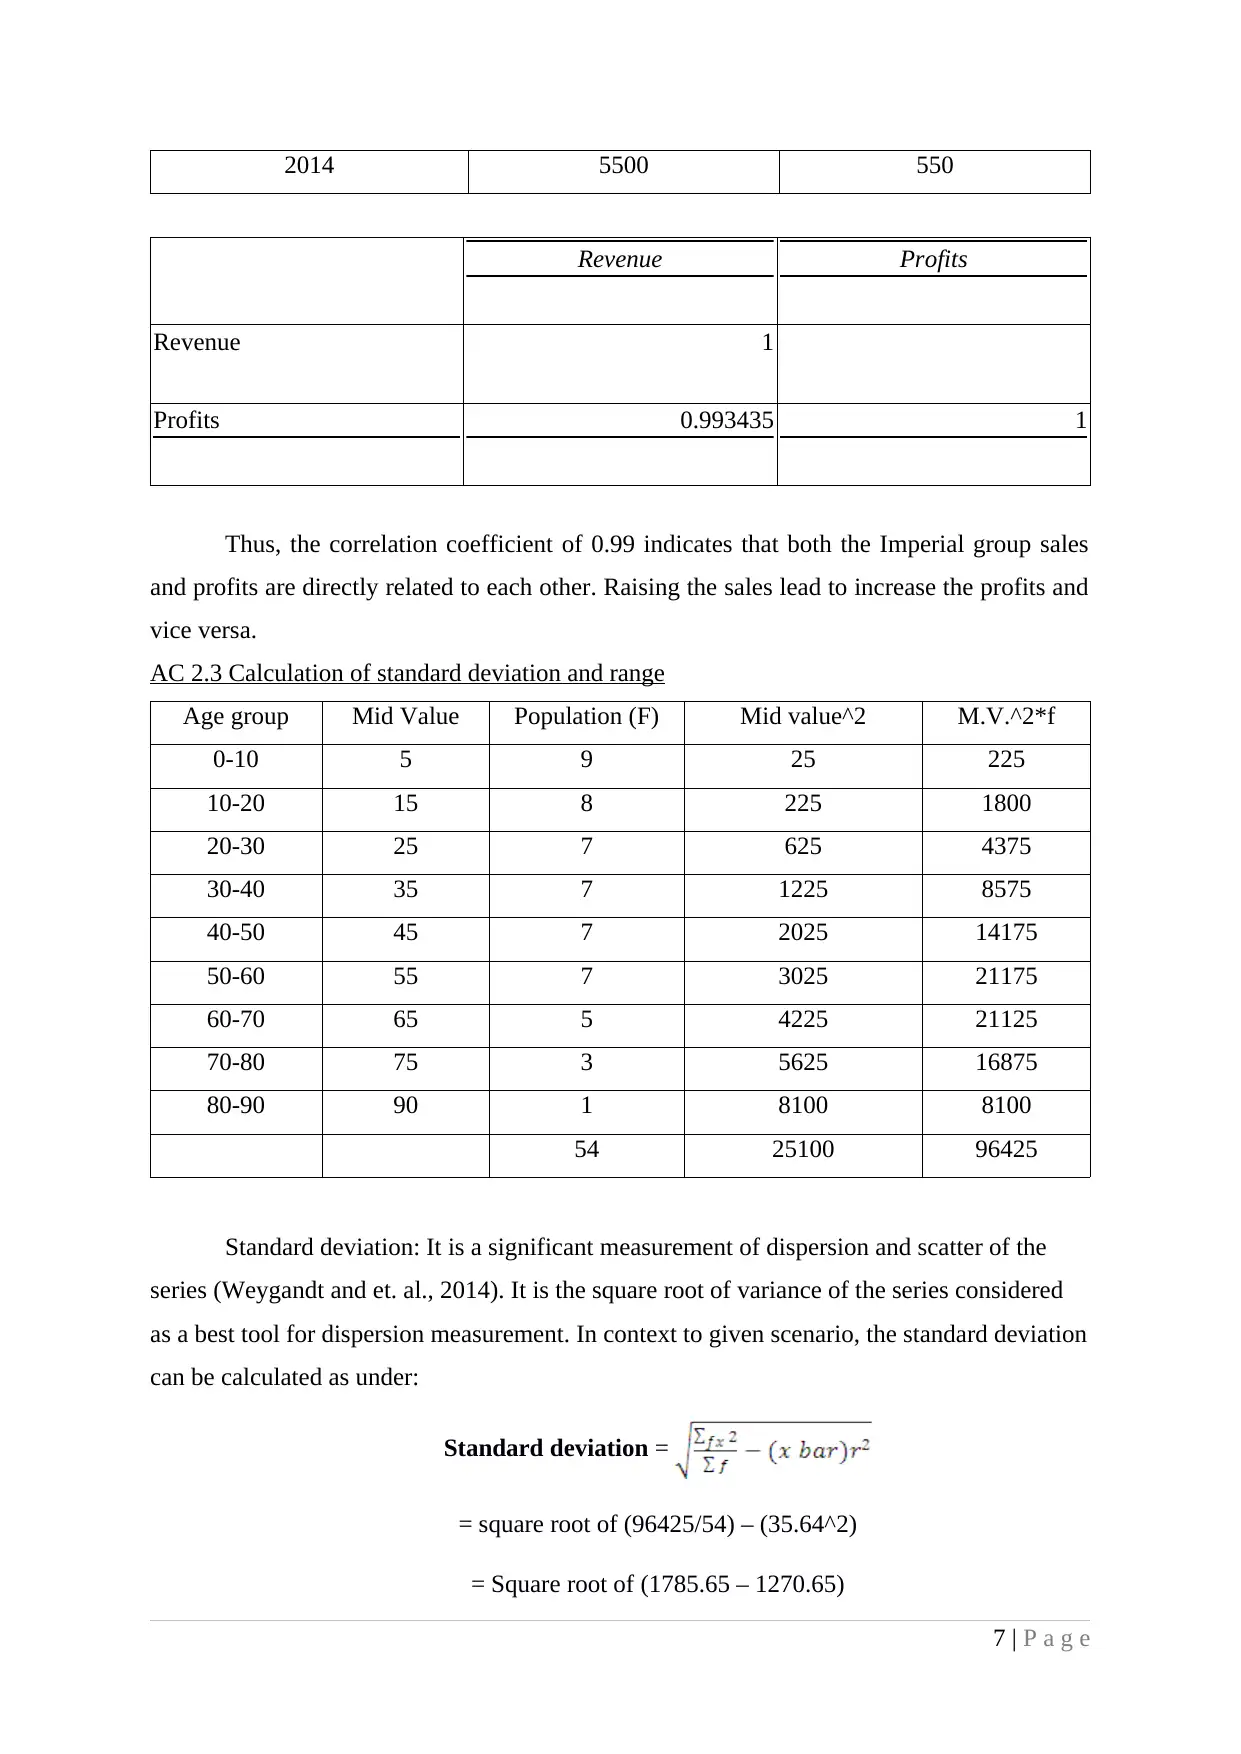
2014 5500 550
Revenue Profits
Revenue 1
Profits 0.993435 1
Thus, the correlation coefficient of 0.99 indicates that both the Imperial group sales
and profits are directly related to each other. Raising the sales lead to increase the profits and
vice versa.
AC 2.3 Calculation of standard deviation and range
Age group Mid Value Population (F) Mid value^2 M.V.^2*f
0-10 5 9 25 225
10-20 15 8 225 1800
20-30 25 7 625 4375
30-40 35 7 1225 8575
40-50 45 7 2025 14175
50-60 55 7 3025 21175
60-70 65 5 4225 21125
70-80 75 3 5625 16875
80-90 90 1 8100 8100
54 25100 96425
Standard deviation: It is a significant measurement of dispersion and scatter of the
series (Weygandt and et. al., 2014). It is the square root of variance of the series considered
as a best tool for dispersion measurement. In context to given scenario, the standard deviation
can be calculated as under:
Standard deviation =
= square root of (96425/54) – (35.64^2)
= Square root of (1785.65 – 1270.65)
7 | P a g e
⊘ This is a preview!⊘
Do you want full access?
Subscribe today to unlock all pages.
Trusted by 1+ million students worldwide
= Sq. root of 515
= 22.69
Range: The difference between greatest and lowest value is known as range of the
series (Hahs-Vaughn and Lomax, 2013). The range for given data series can be calculated as
under:
Range = Highest class interval – lowest class interval
= 100 – 0
= 100
TASK 3
AC 3.1 Graphical representation
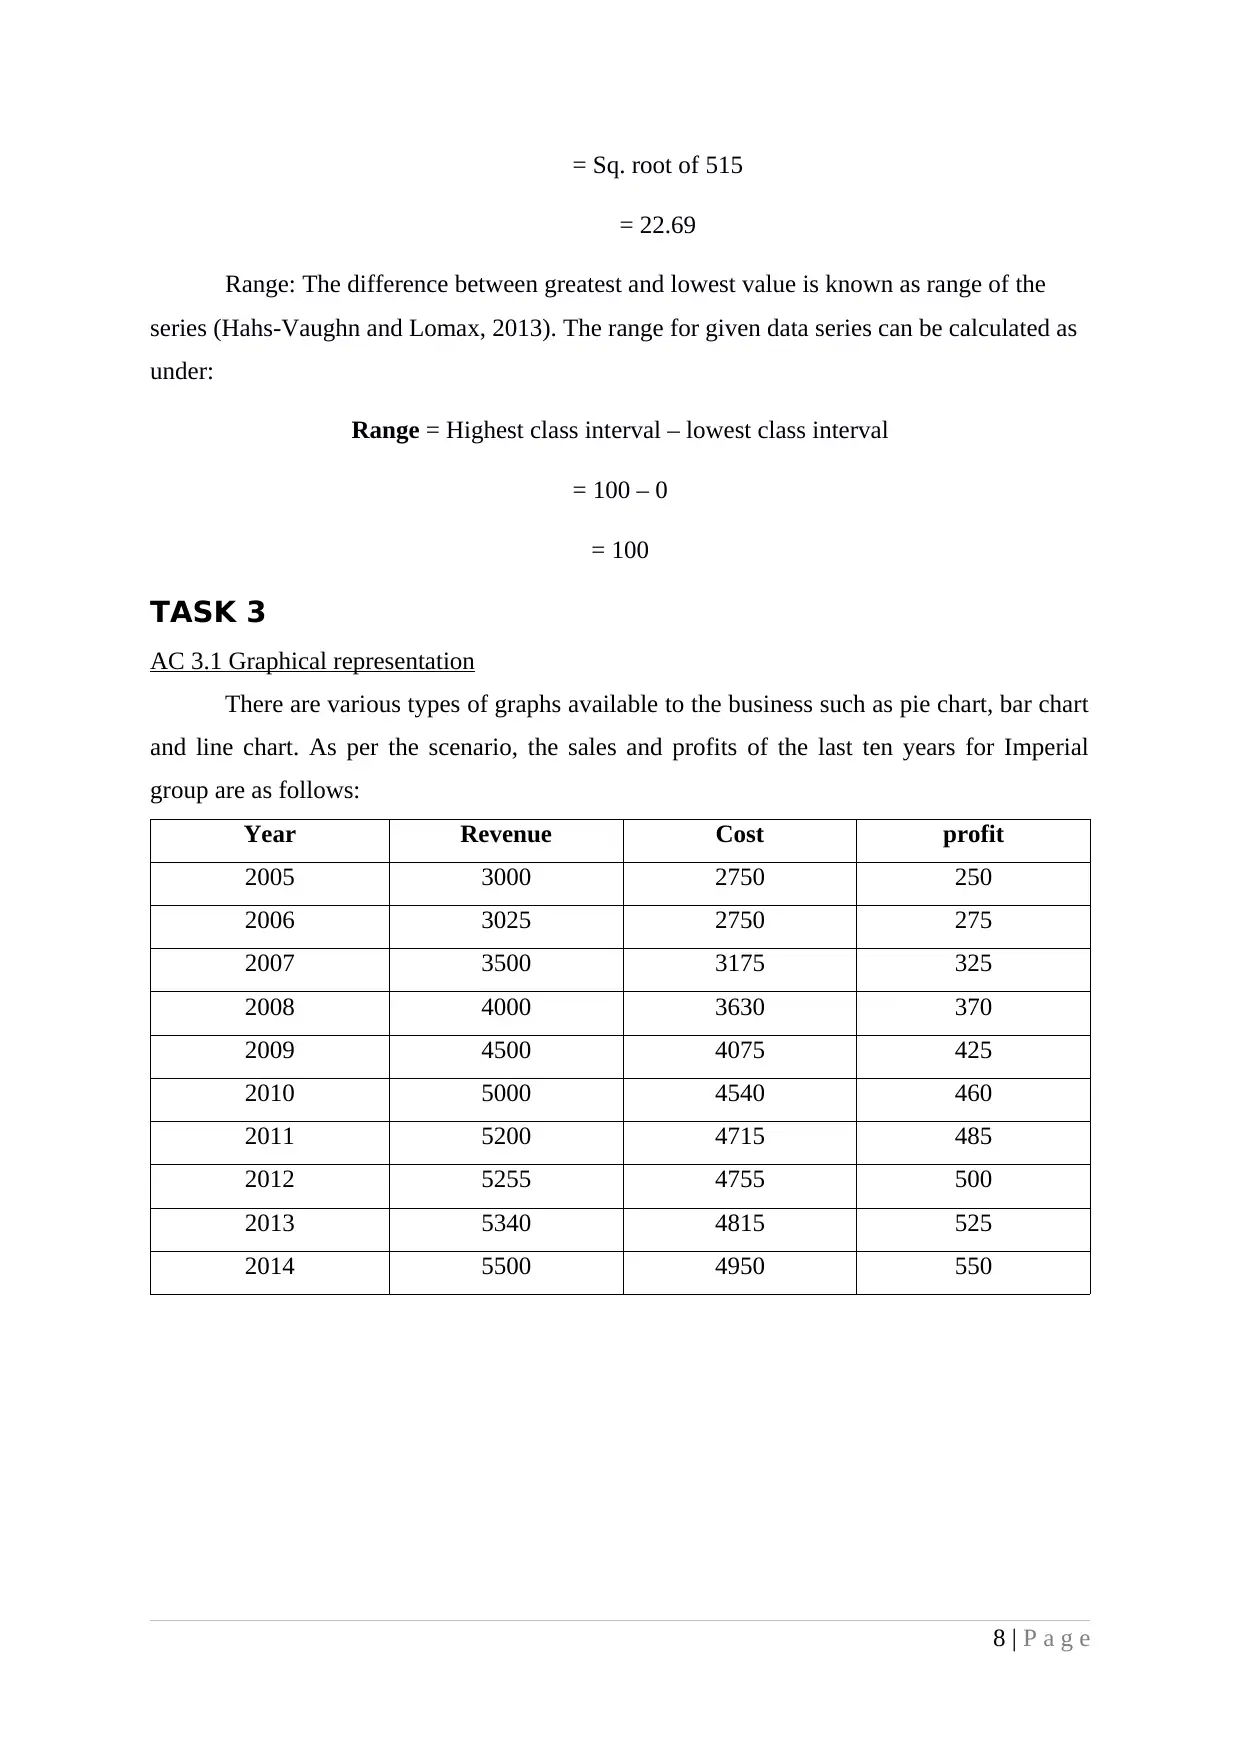
There are various types of graphs available to the business such as pie chart, bar chart
and line chart. As per the scenario, the sales and profits of the last ten years for Imperial
group are as follows:
Year Revenue Cost profit
2005 3000 2750 250
2006 3025 2750 275
2007 3500 3175 325
2008 4000 3630 370
2009 4500 4075 425
2010 5000 4540 460
2011 5200 4715 485
2012 5255 4755 500
2013 5340 4815 525
2014 5500 4950 550
8 | P a g e
= 22.69
Range: The difference between greatest and lowest value is known as range of the
series (Hahs-Vaughn and Lomax, 2013). The range for given data series can be calculated as
under:
Range = Highest class interval – lowest class interval
= 100 – 0
= 100
TASK 3
AC 3.1 Graphical representation
There are various types of graphs available to the business such as pie chart, bar chart
and line chart. As per the scenario, the sales and profits of the last ten years for Imperial
group are as follows:
Year Revenue Cost profit
2005 3000 2750 250
2006 3025 2750 275
2007 3500 3175 325
2008 4000 3630 370
2009 4500 4075 425
2010 5000 4540 460
2011 5200 4715 485
2012 5255 4755 500
2013 5340 4815 525
2014 5500 4950 550
8 | P a g e
Paraphrase This Document
Need a fresh take? Get an instant paraphrase of this document with our AI Paraphraser
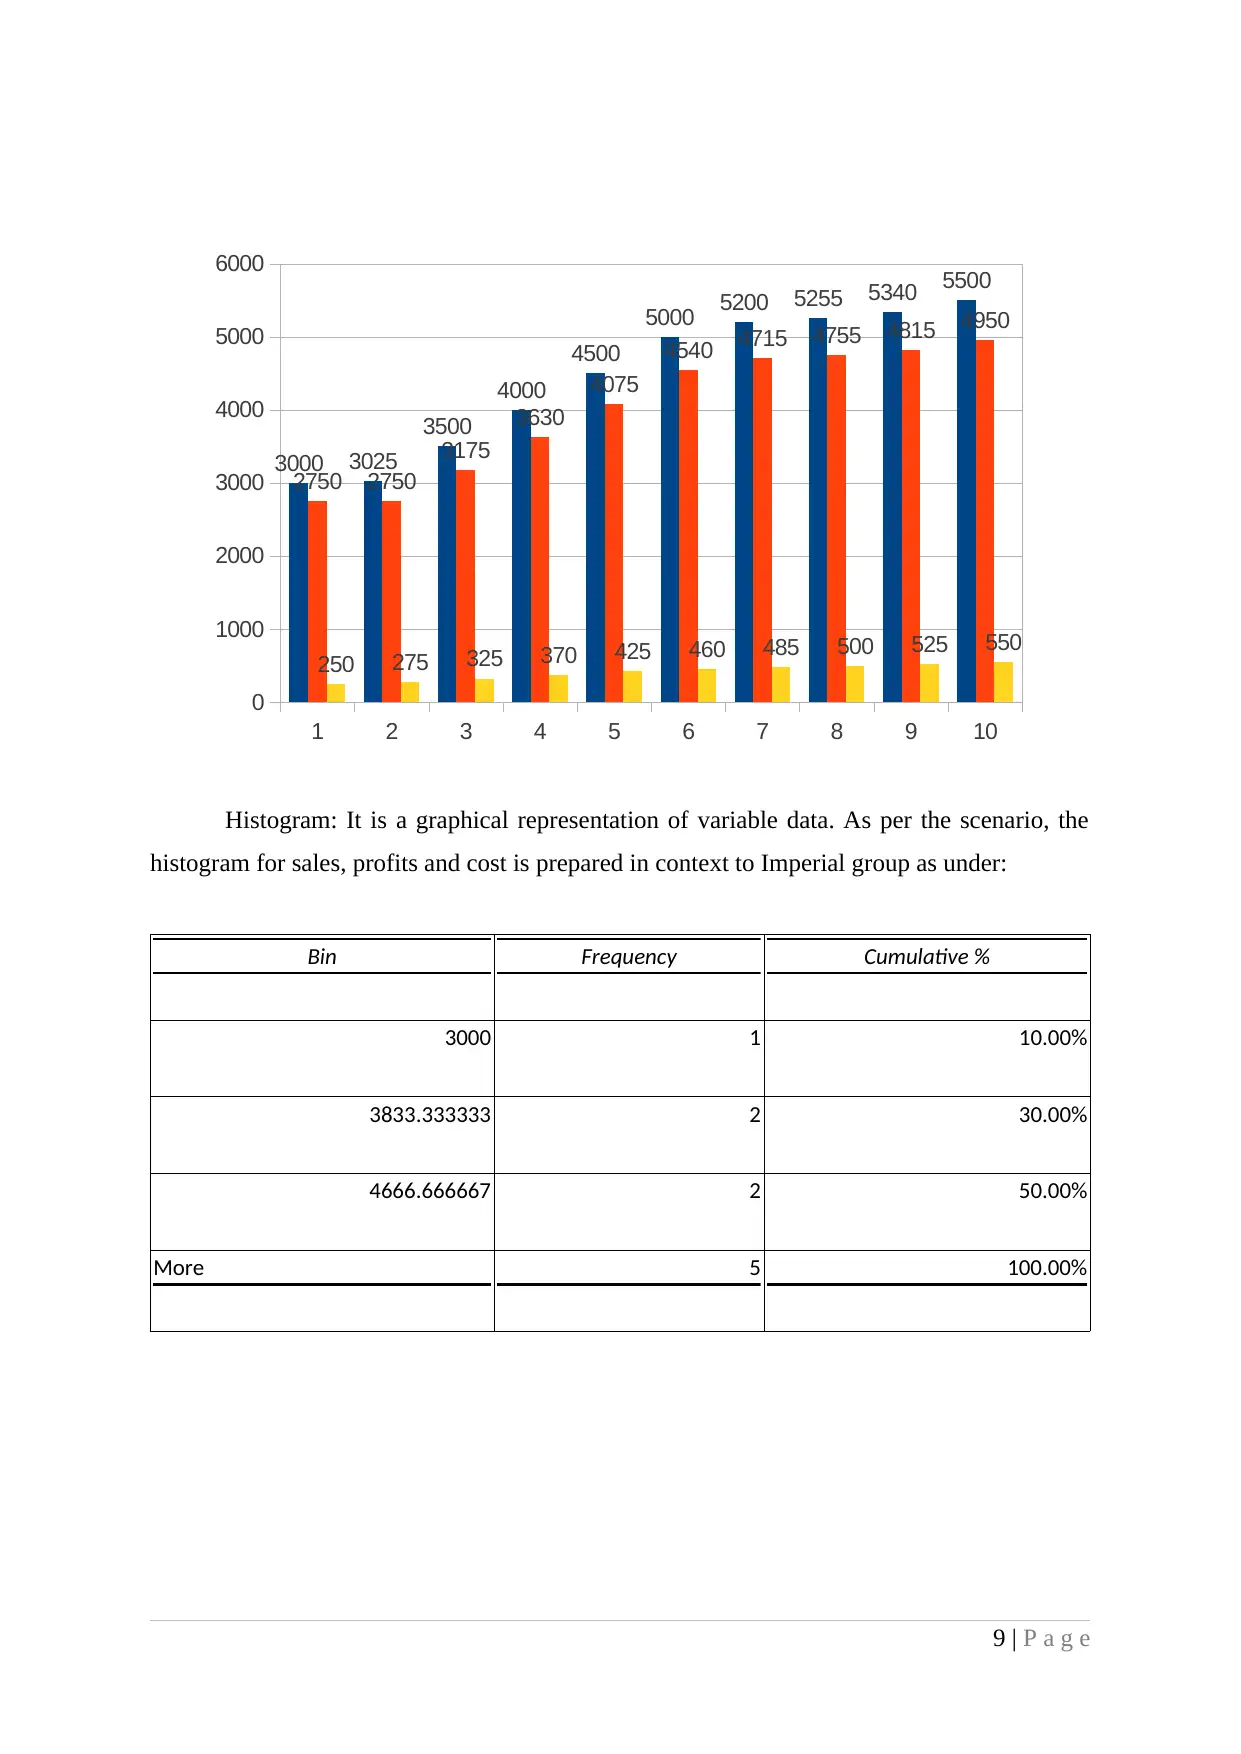
Histogram: It is a graphical representation of variable data. As per the scenario, the
histogram for sales, profits and cost is prepared in context to Imperial group as under:
Bin Frequency Cumulative %
3000 1 10.00%
3833.333333 2 30.00%
4666.666667 2 50.00%
More 5 100.00%
9 | P a g e
1 2 3 4 5 6 7 8 9 10
0
1000
2000
3000
4000
5000
6000
3000 3025
3500
4000
4500
5000 5200 5255 5340 5500
2750 2750
3175
3630
4075
4540 4715 4755 4815 4950
250 275 325 370 425 460 485 500 525 550
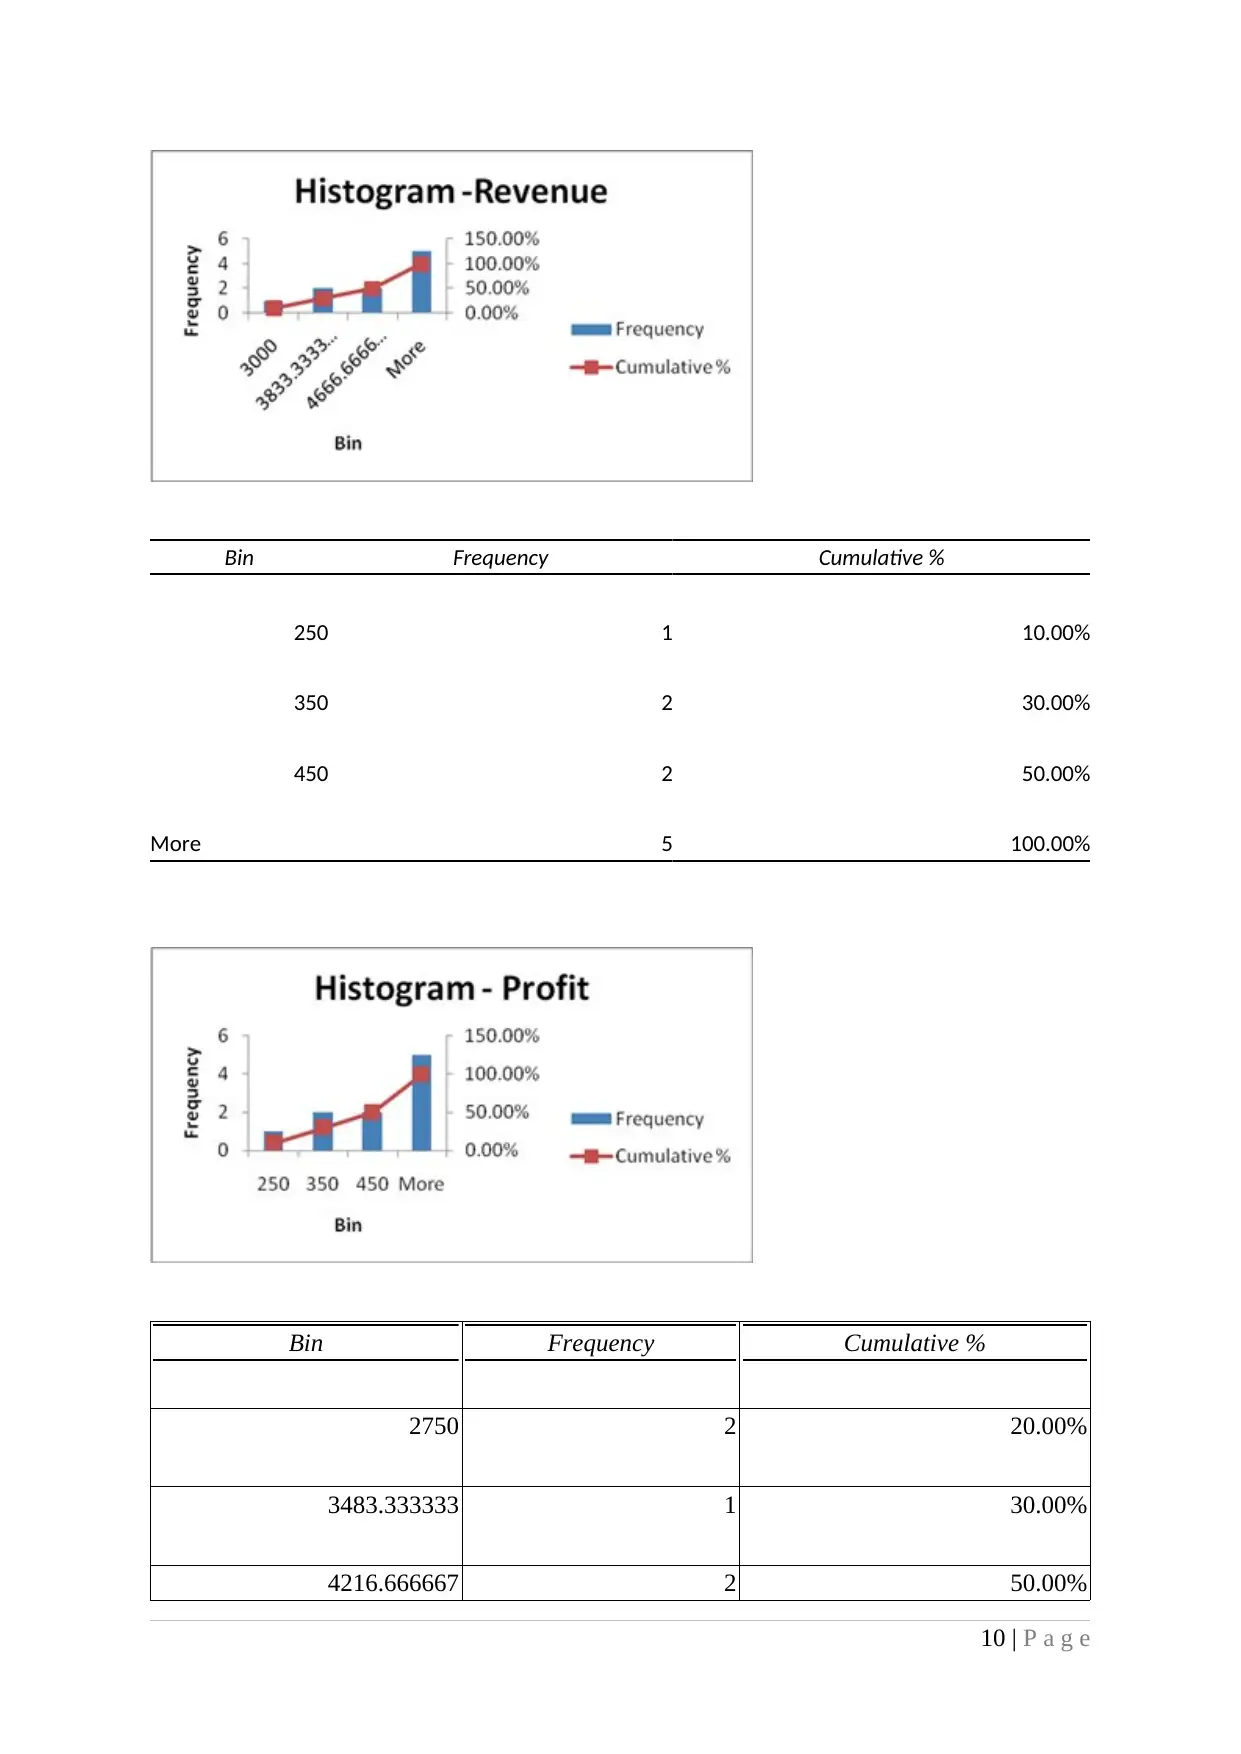
Bin Frequency Cumulative %
250 1 10.00%
350 2 30.00%
450 2 50.00%
More 5 100.00%
Bin Frequency Cumulative %
2750 2 20.00%
3483.333333 1 30.00%
4216.666667 2 50.00%
10 | P a g e
250 1 10.00%
350 2 30.00%
450 2 50.00%
More 5 100.00%
Bin Frequency Cumulative %
2750 2 20.00%
3483.333333 1 30.00%
4216.666667 2 50.00%
10 | P a g e
⊘ This is a preview!⊘
Do you want full access?
Subscribe today to unlock all pages.
Trusted by 1+ million students worldwide
1 out of 19
Related Documents


Your All-in-One AI-Powered Toolkit for Academic Success.
+13062052269
info@desklib.com
Available 24*7 on WhatsApp / Email
![[object Object]](/_next/static/media/star-bottom.7253800d.svg)
Unlock your academic potential
Copyright © 2020–2026 A2Z Services. All Rights Reserved. Developed and managed by ZUCOL.