Business Decision-Making Process Analysis Report for UKCBC
VerifiedAdded on 2021/02/20
|23
|4783
|32
Report
AI Summary
This report provides an in-depth analysis of business decision-making processes, focusing on data collection methods, survey methodology, and statistical analysis. The report begins by outlining the importance of decision-making in the business world and introduces the specific context of UKCBC College. It details the collection of both primary and secondary data, including the use of questionnaires and research methodologies. The report presents a survey methodology, sampling frame, and a sample questionnaire designed to assess student satisfaction with the college. The analysis involves calculating representative values (mean, median, mode) and evaluating data dispersion to draw valid conclusions about the college's performance. The report concludes with an evaluation of the data and provides insights that can be used to improve business operations and student experience at UKCBC College. The report's structure includes an introduction, methodology, data analysis, and conclusion.

Business decision-
making
making
Paraphrase This Document
Need a fresh take? Get an instant paraphrase of this document with our AI Paraphraser

⊘ This is a preview!⊘
Do you want full access?
Subscribe today to unlock all pages.
Trusted by 1+ million students worldwide
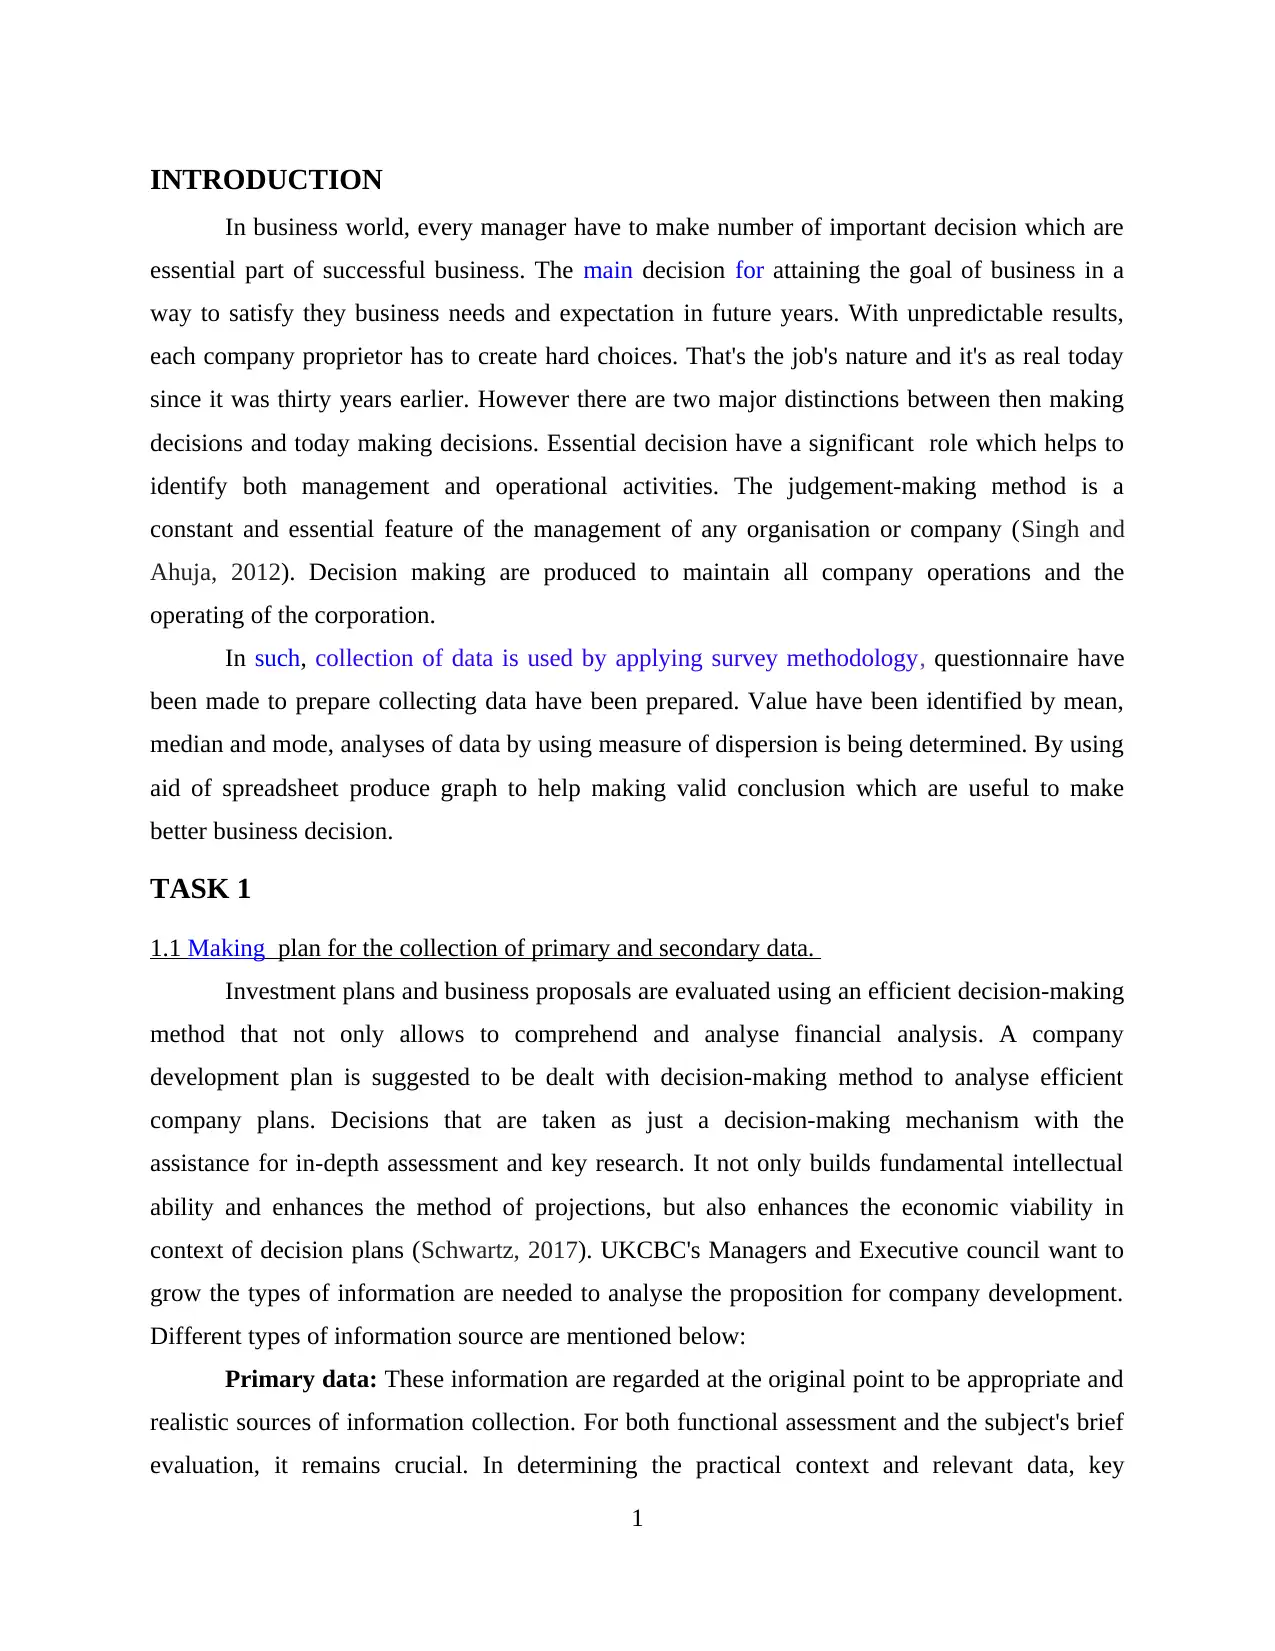
INTRODUCTION
In business world, every manager have to make number of important decision which are
essential part of successful business. The main decision for attaining the goal of business in a
way to satisfy they business needs and expectation in future years. With unpredictable results,
each company proprietor has to create hard choices. That's the job's nature and it's as real today
since it was thirty years earlier. However there are two major distinctions between then making
decisions and today making decisions. Essential decision have a significant role which helps to
identify both management and operational activities. The judgement-making method is a
constant and essential feature of the management of any organisation or company (Singh and
Ahuja, 2012). Decision making are produced to maintain all company operations and the
operating of the corporation.
In such, collection of data is used by applying survey methodology, questionnaire have
been made to prepare collecting data have been prepared. Value have been identified by mean,
median and mode, analyses of data by using measure of dispersion is being determined. By using
aid of spreadsheet produce graph to help making valid conclusion which are useful to make
better business decision.
TASK 1
1.1 Making plan for the collection of primary and secondary data.
Investment plans and business proposals are evaluated using an efficient decision-making
method that not only allows to comprehend and analyse financial analysis. A company
development plan is suggested to be dealt with decision-making method to analyse efficient
company plans. Decisions that are taken as just a decision-making mechanism with the
assistance for in-depth assessment and key research. It not only builds fundamental intellectual
ability and enhances the method of projections, but also enhances the economic viability in
context of decision plans (Schwartz, 2017). UKCBC's Managers and Executive council want to
grow the types of information are needed to analyse the proposition for company development.
Different types of information source are mentioned below:
Primary data: These information are regarded at the original point to be appropriate and
realistic sources of information collection. For both functional assessment and the subject's brief
evaluation, it remains crucial. In determining the practical context and relevant data, key
1
Paraphrase This Document
Need a fresh take? Get an instant paraphrase of this document with our AI Paraphraser
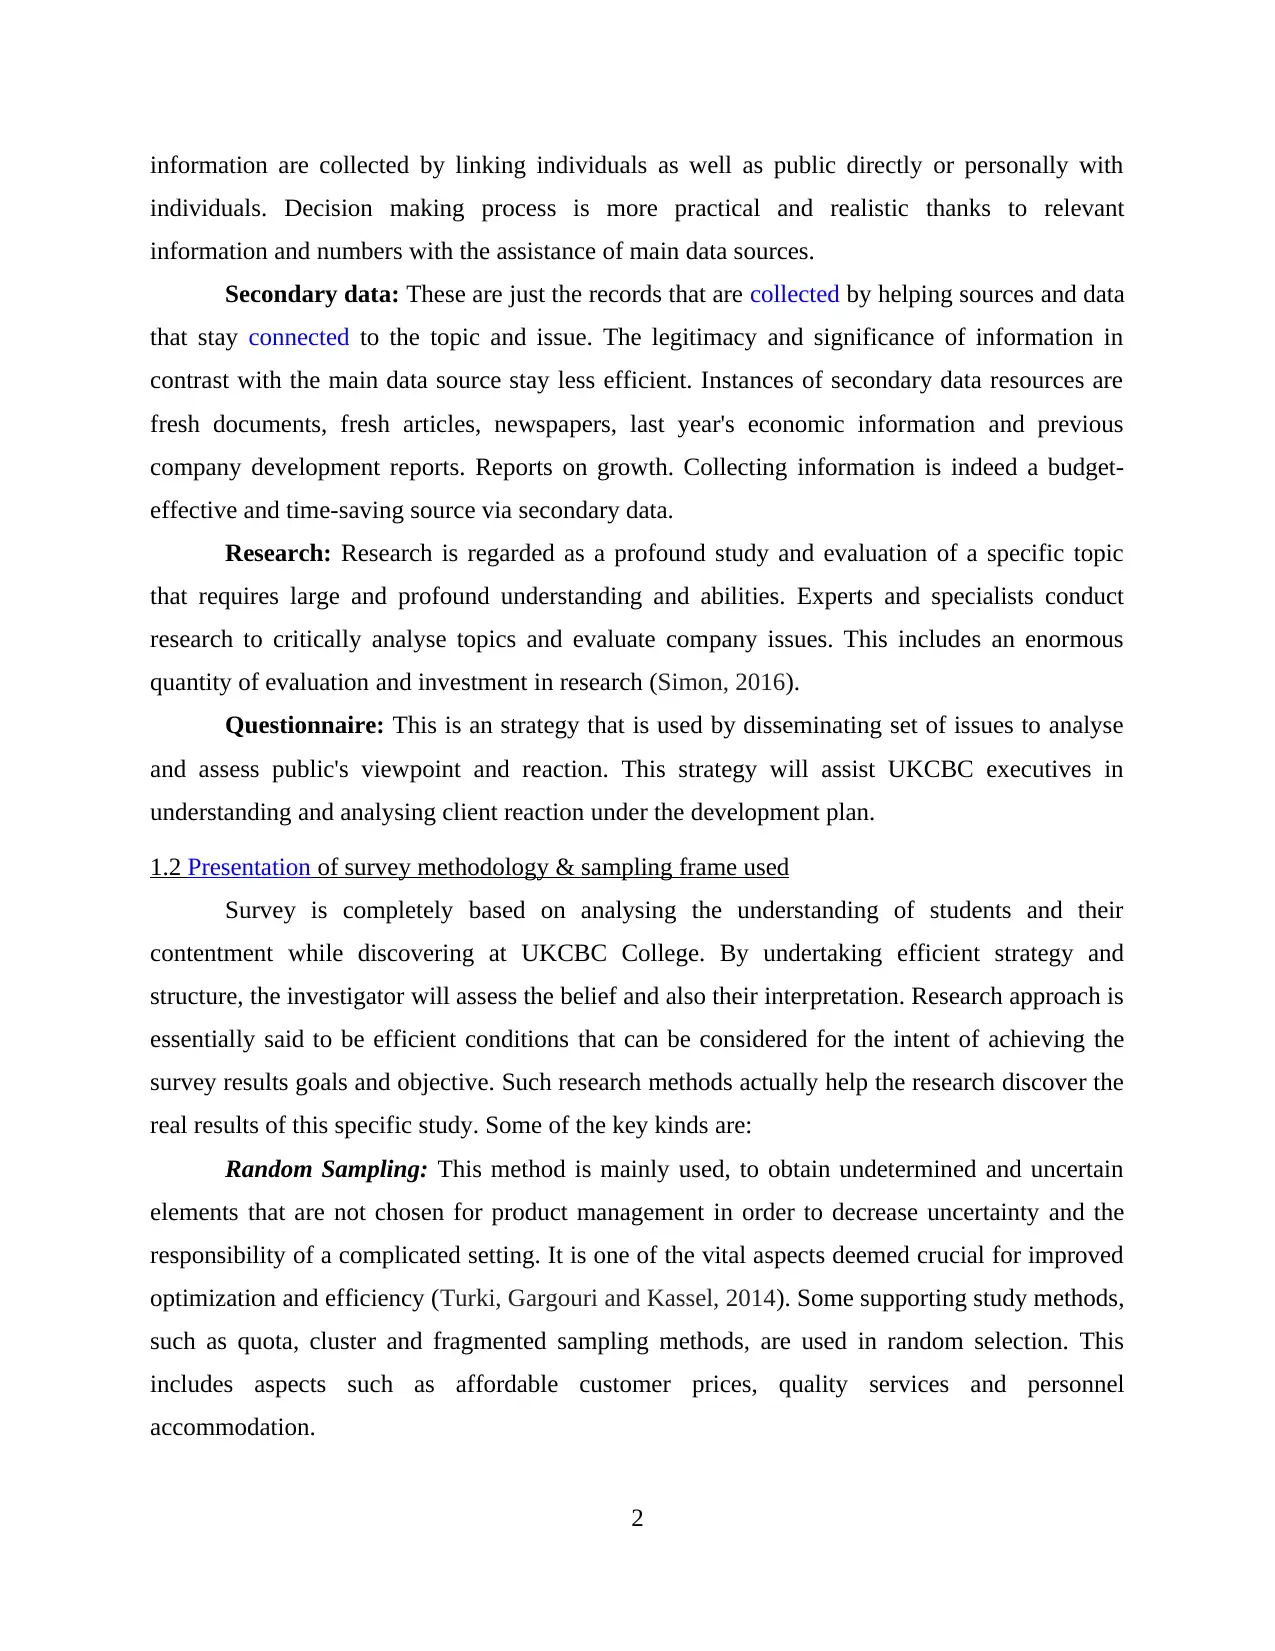
information are collected by linking individuals as well as public directly or personally with
individuals. Decision making process is more practical and realistic thanks to relevant
information and numbers with the assistance of main data sources.
Secondary data: These are just the records that are collected by helping sources and data
that stay connected to the topic and issue. The legitimacy and significance of information in
contrast with the main data source stay less efficient. Instances of secondary data resources are
fresh documents, fresh articles, newspapers, last year's economic information and previous
company development reports. Reports on growth. Collecting information is indeed a budget-
effective and time-saving source via secondary data.
Research: Research is regarded as a profound study and evaluation of a specific topic
that requires large and profound understanding and abilities. Experts and specialists conduct
research to critically analyse topics and evaluate company issues. This includes an enormous
quantity of evaluation and investment in research (Simon, 2016).
Questionnaire: This is an strategy that is used by disseminating set of issues to analyse
and assess public's viewpoint and reaction. This strategy will assist UKCBC executives in
understanding and analysing client reaction under the development plan.
1.2 Presentation of survey methodology & sampling frame used
Survey is completely based on analysing the understanding of students and their
contentment while discovering at UKCBC College. By undertaking efficient strategy and
structure, the investigator will assess the belief and also their interpretation. Research approach is
essentially said to be efficient conditions that can be considered for the intent of achieving the
survey results goals and objective. Such research methods actually help the research discover the
real results of this specific study. Some of the key kinds are:
Random Sampling: This method is mainly used, to obtain undetermined and uncertain
elements that are not chosen for product management in order to decrease uncertainty and the
responsibility of a complicated setting. It is one of the vital aspects deemed crucial for improved
optimization and efficiency (Turki, Gargouri and Kassel, 2014). Some supporting study methods,
such as quota, cluster and fragmented sampling methods, are used in random selection. This
includes aspects such as affordable customer prices, quality services and personnel
accommodation.
2
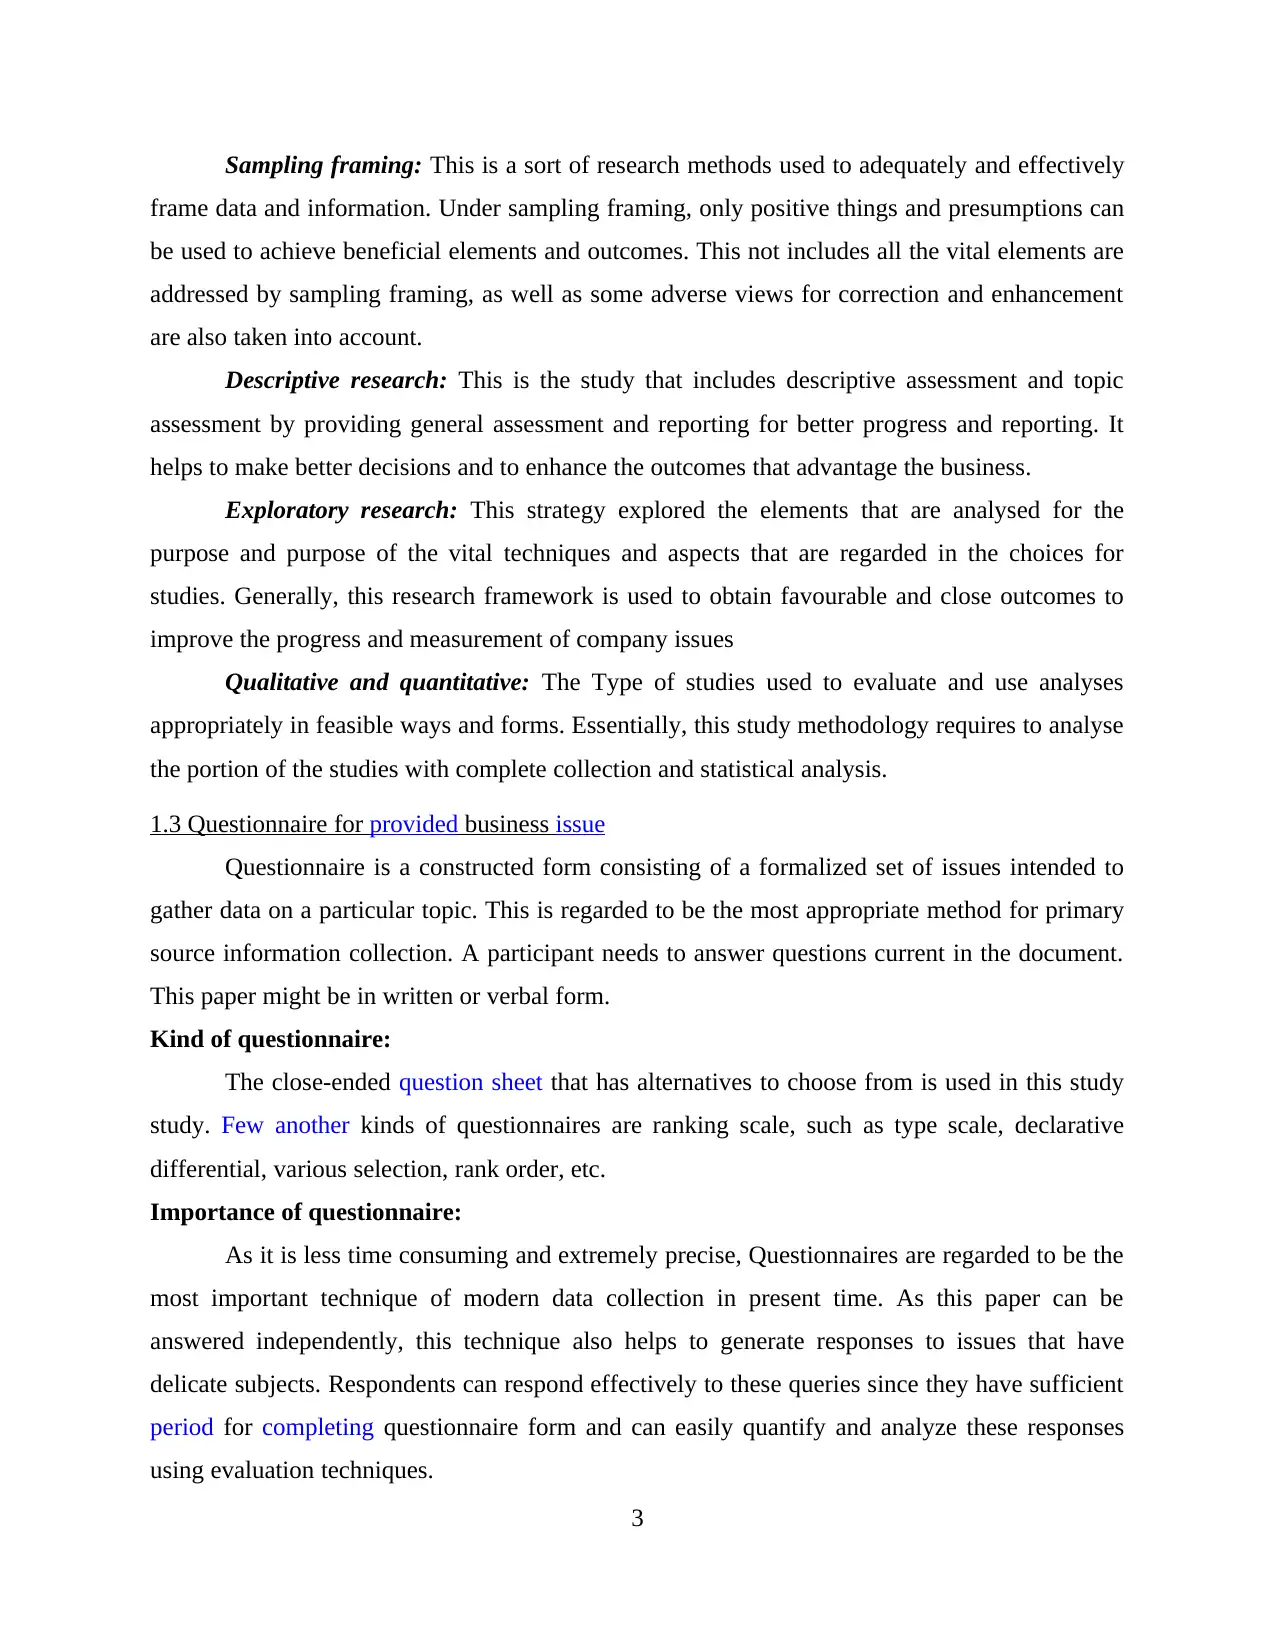
Sampling framing: This is a sort of research methods used to adequately and effectively
frame data and information. Under sampling framing, only positive things and presumptions can
be used to achieve beneficial elements and outcomes. This not includes all the vital elements are
addressed by sampling framing, as well as some adverse views for correction and enhancement
are also taken into account.
Descriptive research: This is the study that includes descriptive assessment and topic
assessment by providing general assessment and reporting for better progress and reporting. It
helps to make better decisions and to enhance the outcomes that advantage the business.
Exploratory research: This strategy explored the elements that are analysed for the
purpose and purpose of the vital techniques and aspects that are regarded in the choices for
studies. Generally, this research framework is used to obtain favourable and close outcomes to
improve the progress and measurement of company issues
Qualitative and quantitative: The Type of studies used to evaluate and use analyses
appropriately in feasible ways and forms. Essentially, this study methodology requires to analyse
the portion of the studies with complete collection and statistical analysis.
1.3 Questionnaire for provided business issue
Questionnaire is a constructed form consisting of a formalized set of issues intended to
gather data on a particular topic. This is regarded to be the most appropriate method for primary
source information collection. A participant needs to answer questions current in the document.
This paper might be in written or verbal form.
Kind of questionnaire:
The close-ended question sheet that has alternatives to choose from is used in this study
study. Few another kinds of questionnaires are ranking scale, such as type scale, declarative
differential, various selection, rank order, etc.
Importance of questionnaire:
As it is less time consuming and extremely precise, Questionnaires are regarded to be the
most important technique of modern data collection in present time. As this paper can be
answered independently, this technique also helps to generate responses to issues that have
delicate subjects. Respondents can respond effectively to these queries since they have sufficient
period for completing questionnaire form and can easily quantify and analyze these responses
using evaluation techniques.
3
⊘ This is a preview!⊘
Do you want full access?
Subscribe today to unlock all pages.
Trusted by 1+ million students worldwide
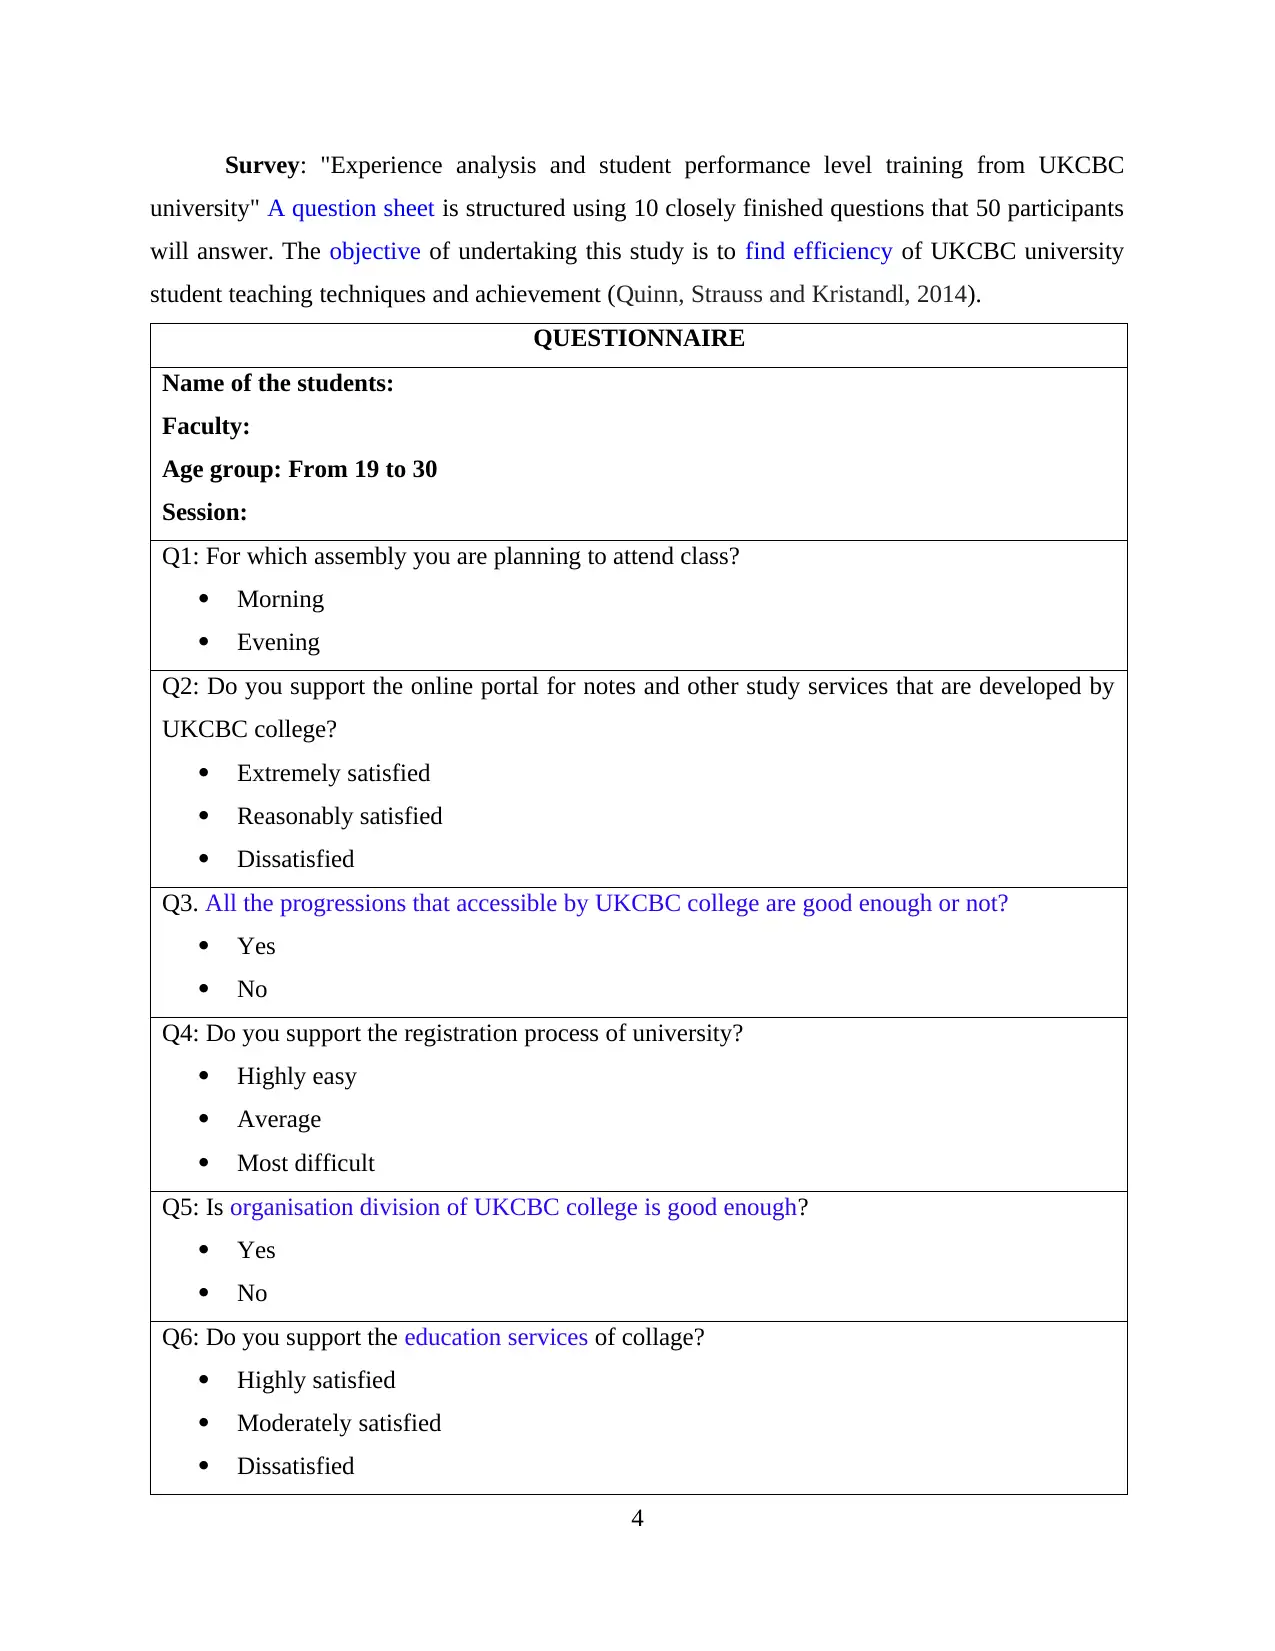
Survey: "Experience analysis and student performance level training from UKCBC
university" A question sheet is structured using 10 closely finished questions that 50 participants
will answer. The objective of undertaking this study is to find efficiency of UKCBC university
student teaching techniques and achievement (Quinn, Strauss and Kristandl, 2014).
QUESTIONNAIRE
Name of the students:
Faculty:
Age group: From 19 to 30
Session:
Q1: For which assembly you are planning to attend class?
Morning
Evening
Q2: Do you support the online portal for notes and other study services that are developed by
UKCBC college?
Extremely satisfied
Reasonably satisfied
Dissatisfied
Q3. All the progressions that accessible by UKCBC college are good enough or not?
Yes
No
Q4: Do you support the registration process of university?
Highly easy
Average
Most difficult
Q5: Is organisation division of UKCBC college is good enough?
Yes
No
Q6: Do you support the education services of collage?
Highly satisfied
Moderately satisfied
Dissatisfied
4
Paraphrase This Document
Need a fresh take? Get an instant paraphrase of this document with our AI Paraphraser
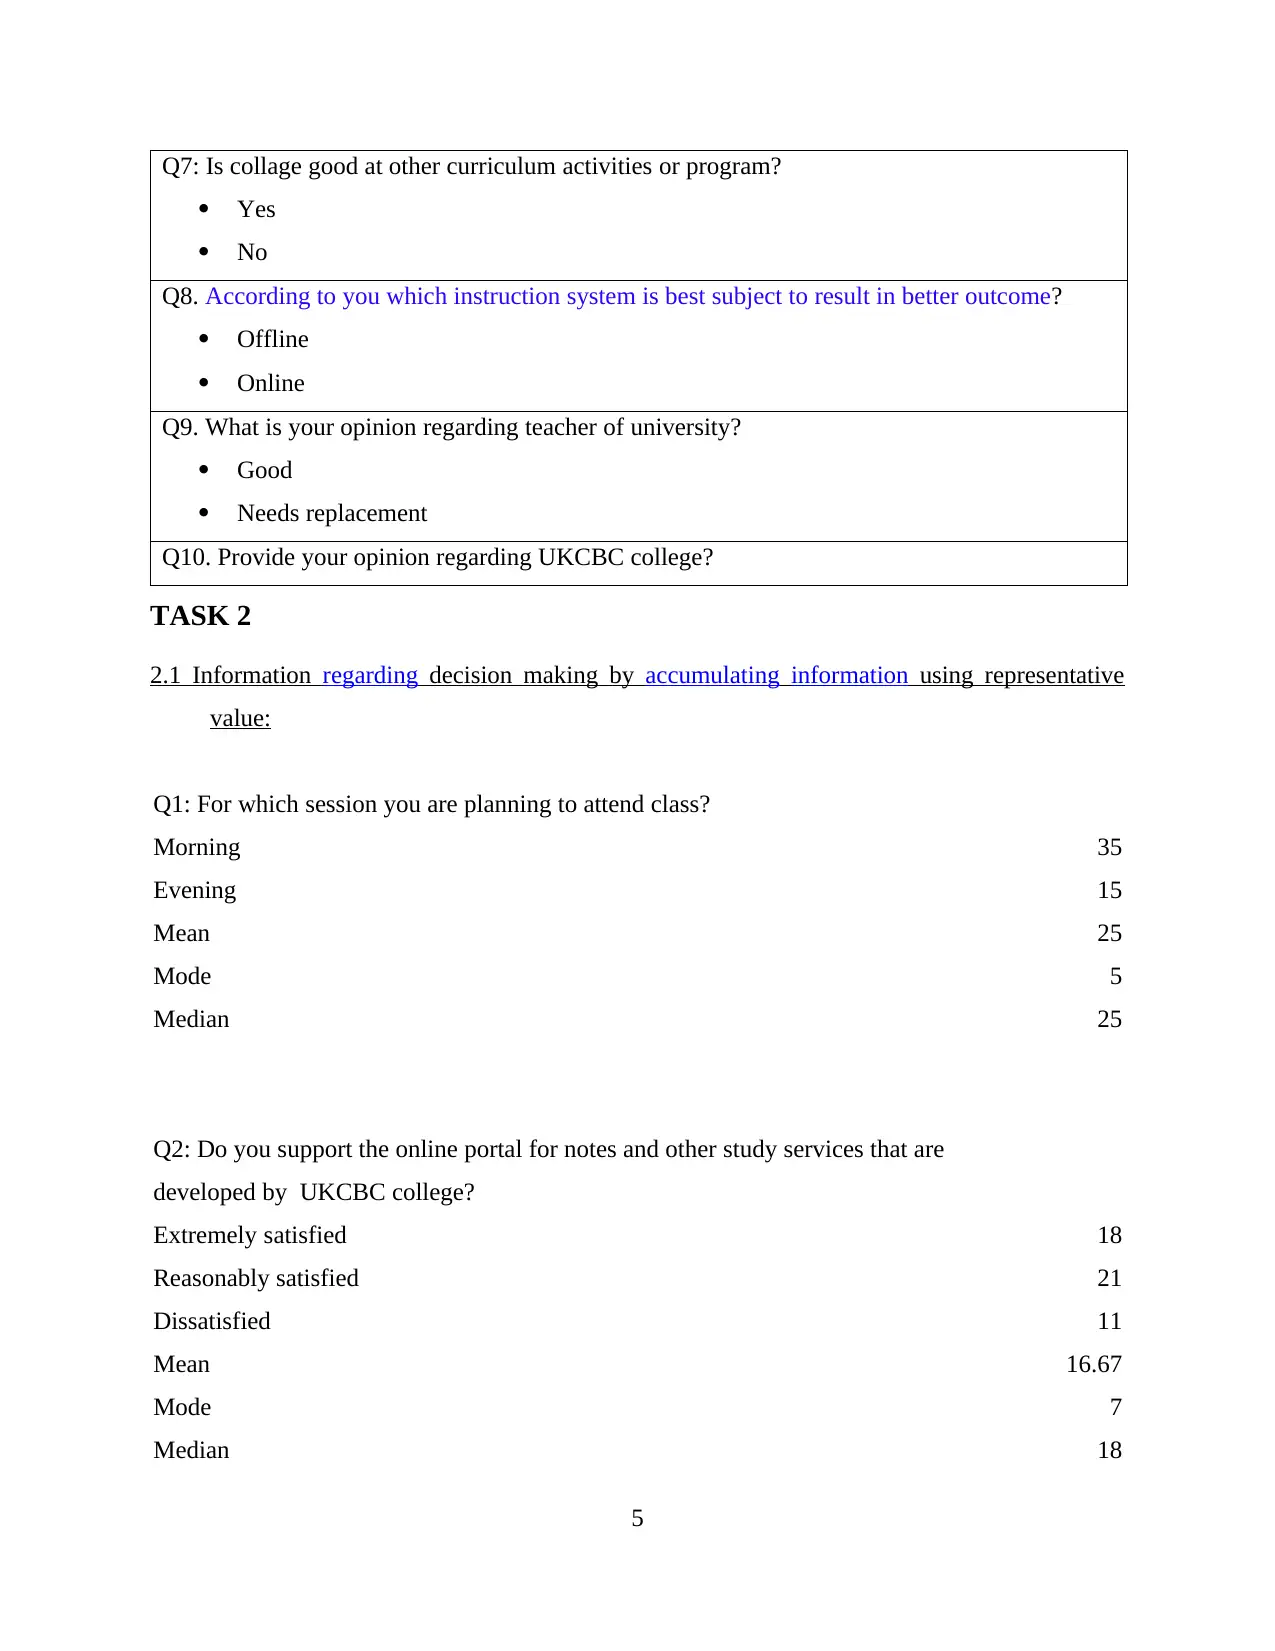
Q7: Is collage good at other curriculum activities or program?
Yes
No
Q8. According to you which instruction system is best subject to result in better outcome?
Offline
Online
Q9. What is your opinion regarding teacher of university?
Good
Needs replacement
Q10. Provide your opinion regarding UKCBC college?
TASK 2
2.1 Information regarding decision making by accumulating information using representative
value:
Q1: For which session you are planning to attend class?
Morning 35
Evening 15
Mean 25
Mode 5
Median 25
Q2: Do you support the online portal for notes and other study services that are
developed by UKCBC college?
Extremely satisfied 18
Reasonably satisfied 21
Dissatisfied 11
Mean 16.67
Mode 7
Median 18
5
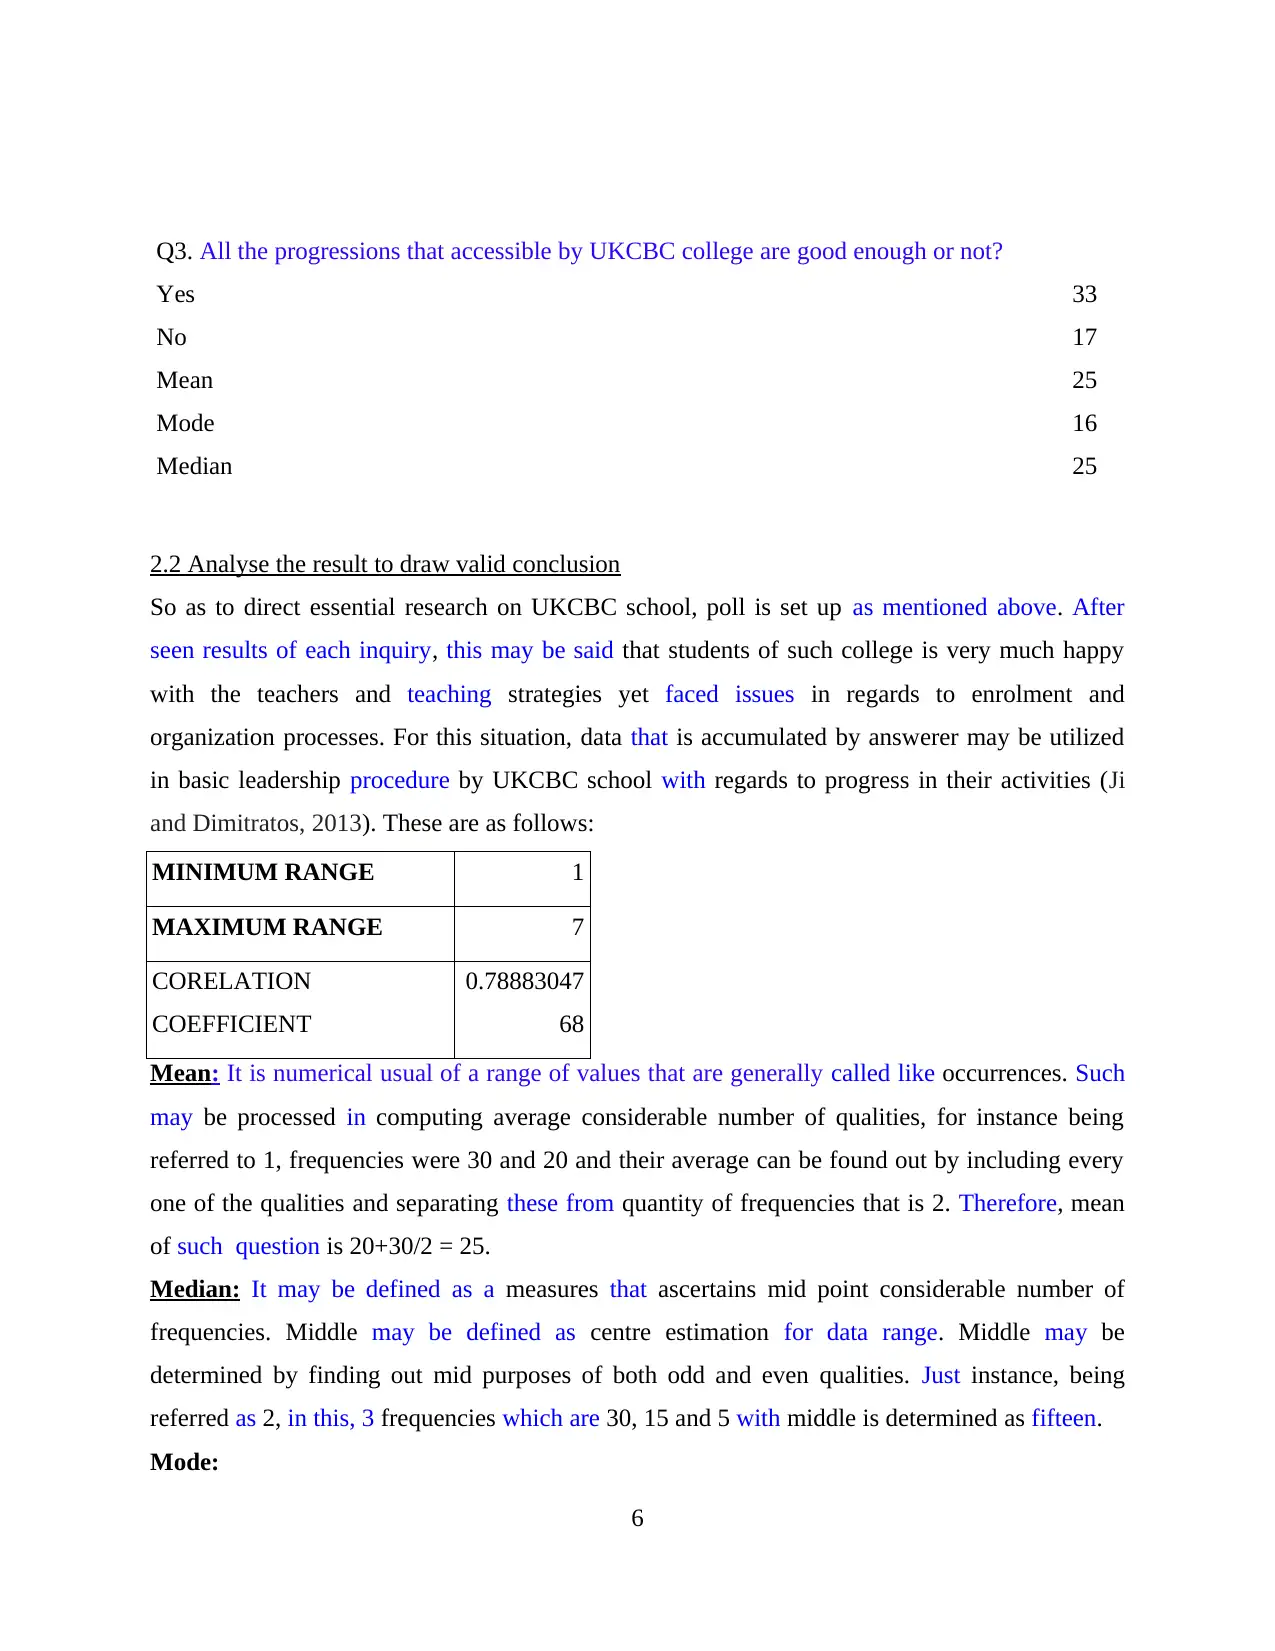
Q3. All the progressions that accessible by UKCBC college are good enough or not?
Yes 33
No 17
Mean 25
Mode 16
Median 25
2.2 Analyse the result to draw valid conclusion
So as to direct essential research on UKCBC school, poll is set up as mentioned above. After
seen results of each inquiry, this may be said that students of such college is very much happy
with the teachers and teaching strategies yet faced issues in regards to enrolment and
organization processes. For this situation, data that is accumulated by answerer may be utilized
in basic leadership procedure by UKCBC school with regards to progress in their activities (Ji
and Dimitratos, 2013). These are as follows:
MINIMUM RANGE 1
MAXIMUM RANGE 7
CORELATION
COEFFICIENT
0.78883047
68
Mean: It is numerical usual of a range of values that are generally called like occurrences. Such
may be processed in computing average considerable number of qualities, for instance being
referred to 1, frequencies were 30 and 20 and their average can be found out by including every
one of the qualities and separating these from quantity of frequencies that is 2. Therefore, mean
of such question is 20+30/2 = 25.
Median: It may be defined as a measures that ascertains mid point considerable number of
frequencies. Middle may be defined as centre estimation for data range. Middle may be
determined by finding out mid purposes of both odd and even qualities. Just instance, being
referred as 2, in this, 3 frequencies which are 30, 15 and 5 with middle is determined as fifteen.
Mode:
6
⊘ This is a preview!⊘
Do you want full access?
Subscribe today to unlock all pages.
Trusted by 1+ million students worldwide
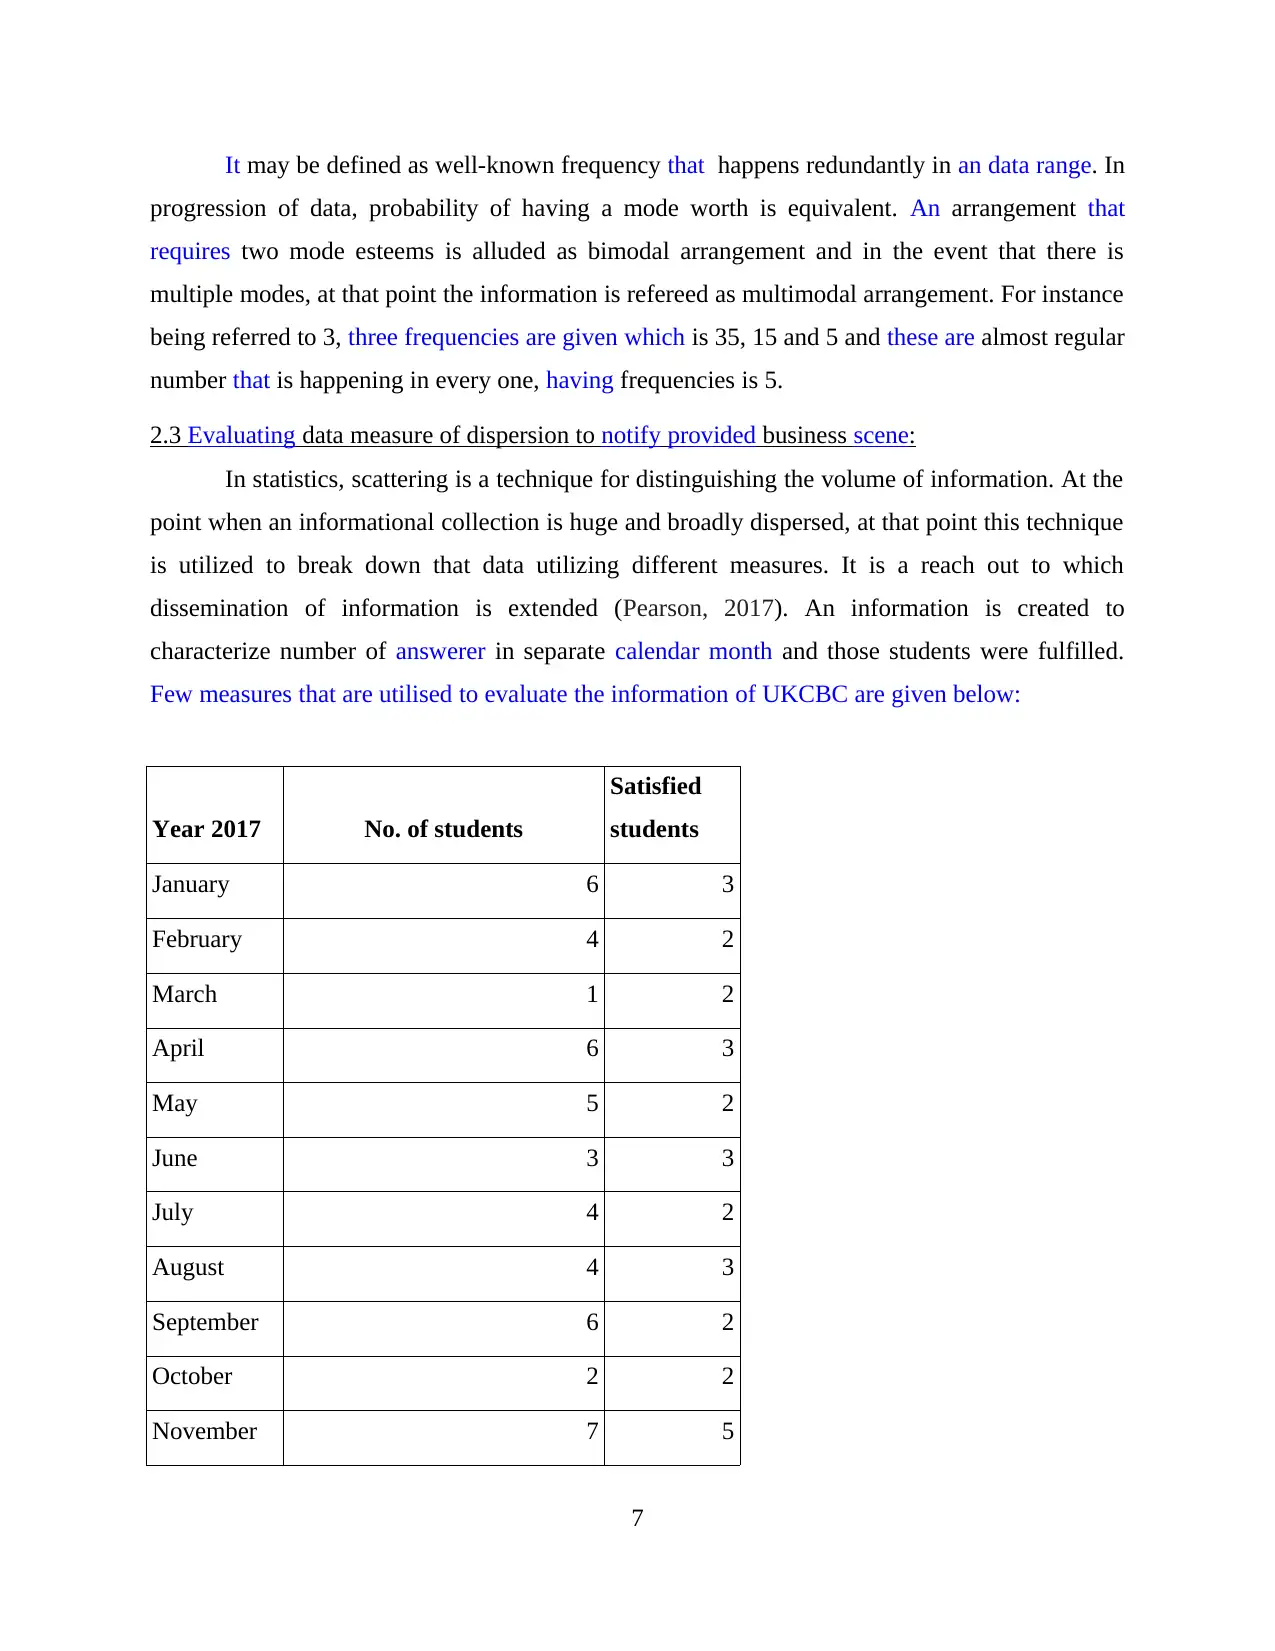
It may be defined as well-known frequency that happens redundantly in an data range. In
progression of data, probability of having a mode worth is equivalent. An arrangement that
requires two mode esteems is alluded as bimodal arrangement and in the event that there is
multiple modes, at that point the information is refereed as multimodal arrangement. For instance
being referred to 3, three frequencies are given which is 35, 15 and 5 and these are almost regular
number that is happening in every one, having frequencies is 5.
2.3 Evaluating data measure of dispersion to notify provided business scene:
In statistics, scattering is a technique for distinguishing the volume of information. At the
point when an informational collection is huge and broadly dispersed, at that point this technique
is utilized to break down that data utilizing different measures. It is a reach out to which
dissemination of information is extended (Pearson, 2017). An information is created to
characterize number of answerer in separate calendar month and those students were fulfilled.
Few measures that are utilised to evaluate the information of UKCBC are given below:
Year 2017 No. of students
Satisfied
students
January 6 3
February 4 2
March 1 2
April 6 3
May 5 2
June 3 3
July 4 2
August 4 3
September 6 2
October 2 2
November 7 5
7
Paraphrase This Document
Need a fresh take? Get an instant paraphrase of this document with our AI Paraphraser
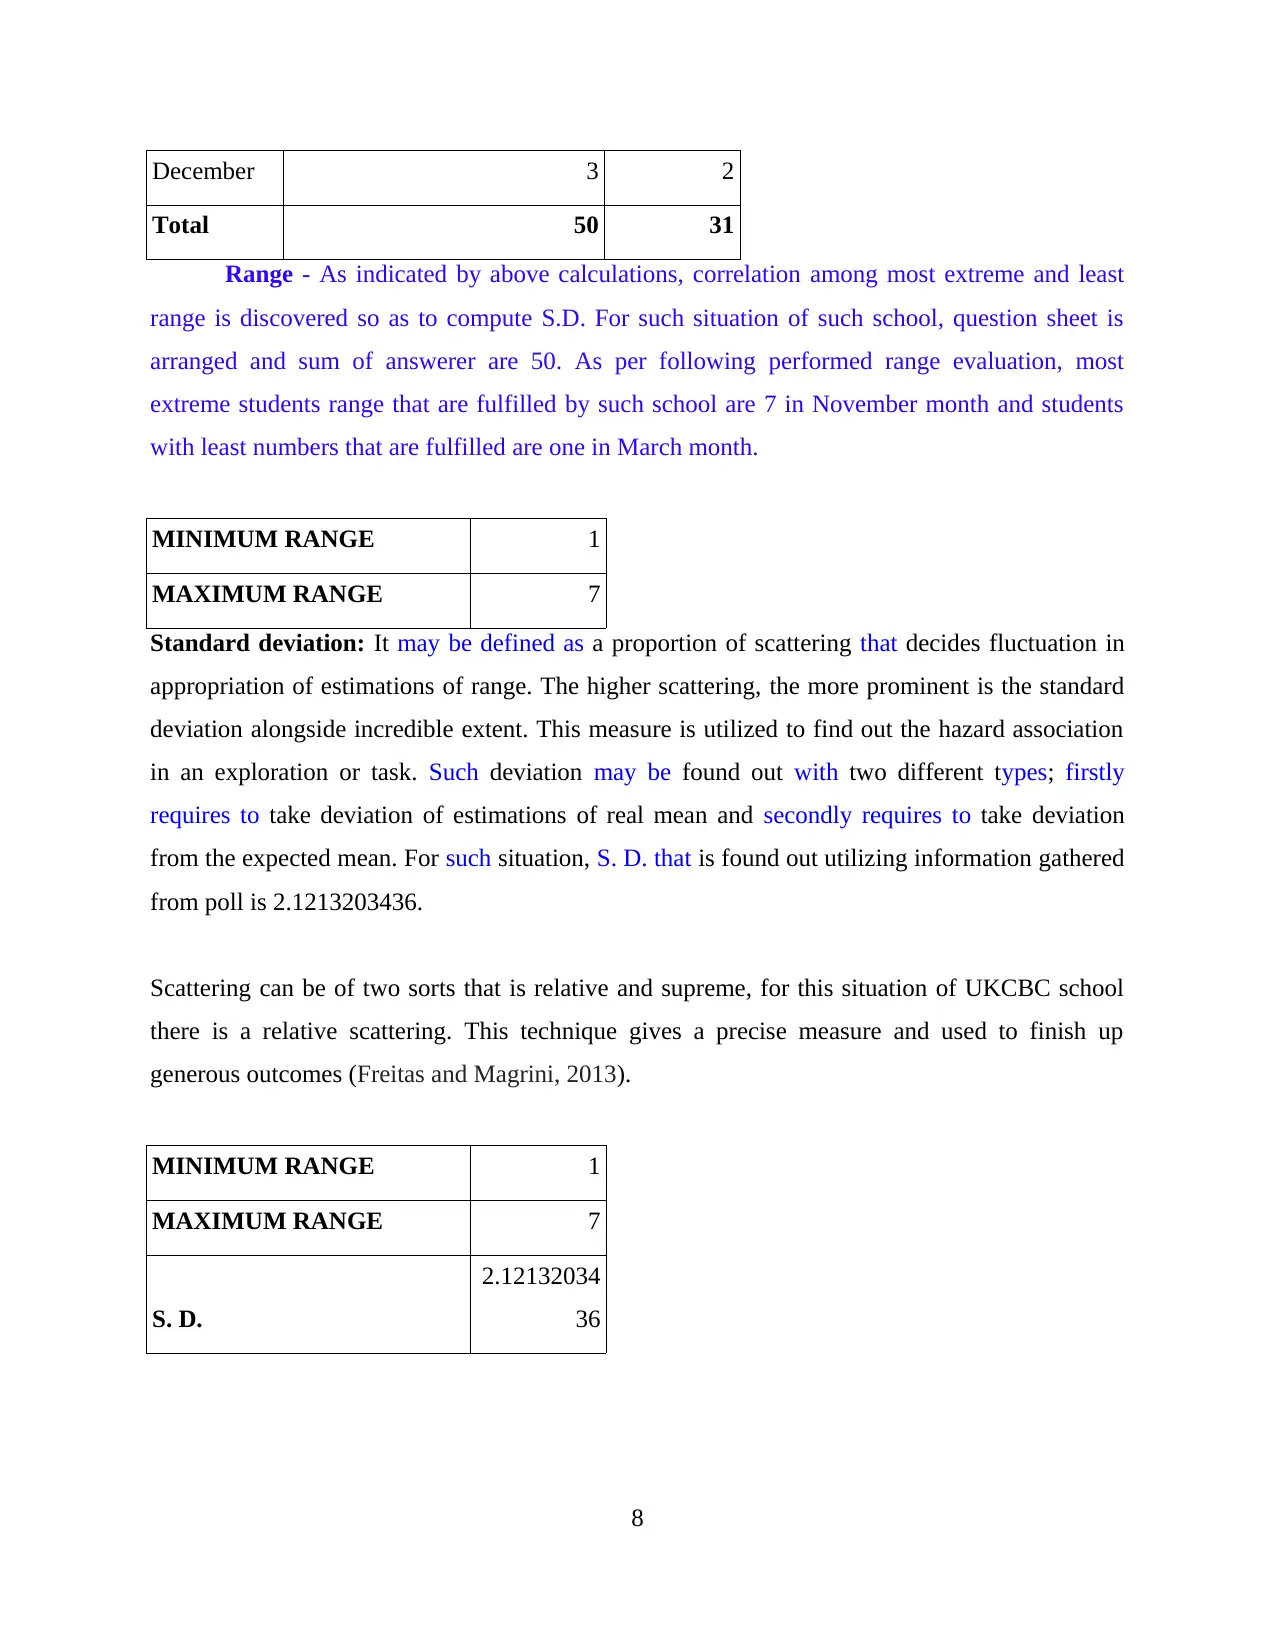
December 3 2
Total 50 31
Range - As indicated by above calculations, correlation among most extreme and least
range is discovered so as to compute S.D. For such situation of such school, question sheet is
arranged and sum of answerer are 50. As per following performed range evaluation, most
extreme students range that are fulfilled by such school are 7 in November month and students
with least numbers that are fulfilled are one in March month.
MINIMUM RANGE 1
MAXIMUM RANGE 7
Standard deviation: It may be defined as a proportion of scattering that decides fluctuation in
appropriation of estimations of range. The higher scattering, the more prominent is the standard
deviation alongside incredible extent. This measure is utilized to find out the hazard association
in an exploration or task. Such deviation may be found out with two different types; firstly
requires to take deviation of estimations of real mean and secondly requires to take deviation
from the expected mean. For such situation, S. D. that is found out utilizing information gathered
from poll is 2.1213203436.
Scattering can be of two sorts that is relative and supreme, for this situation of UKCBC school
there is a relative scattering. This technique gives a precise measure and used to finish up
generous outcomes (Freitas and Magrini, 2013).
MINIMUM RANGE 1
MAXIMUM RANGE 7
S. D.
2.12132034
36
8
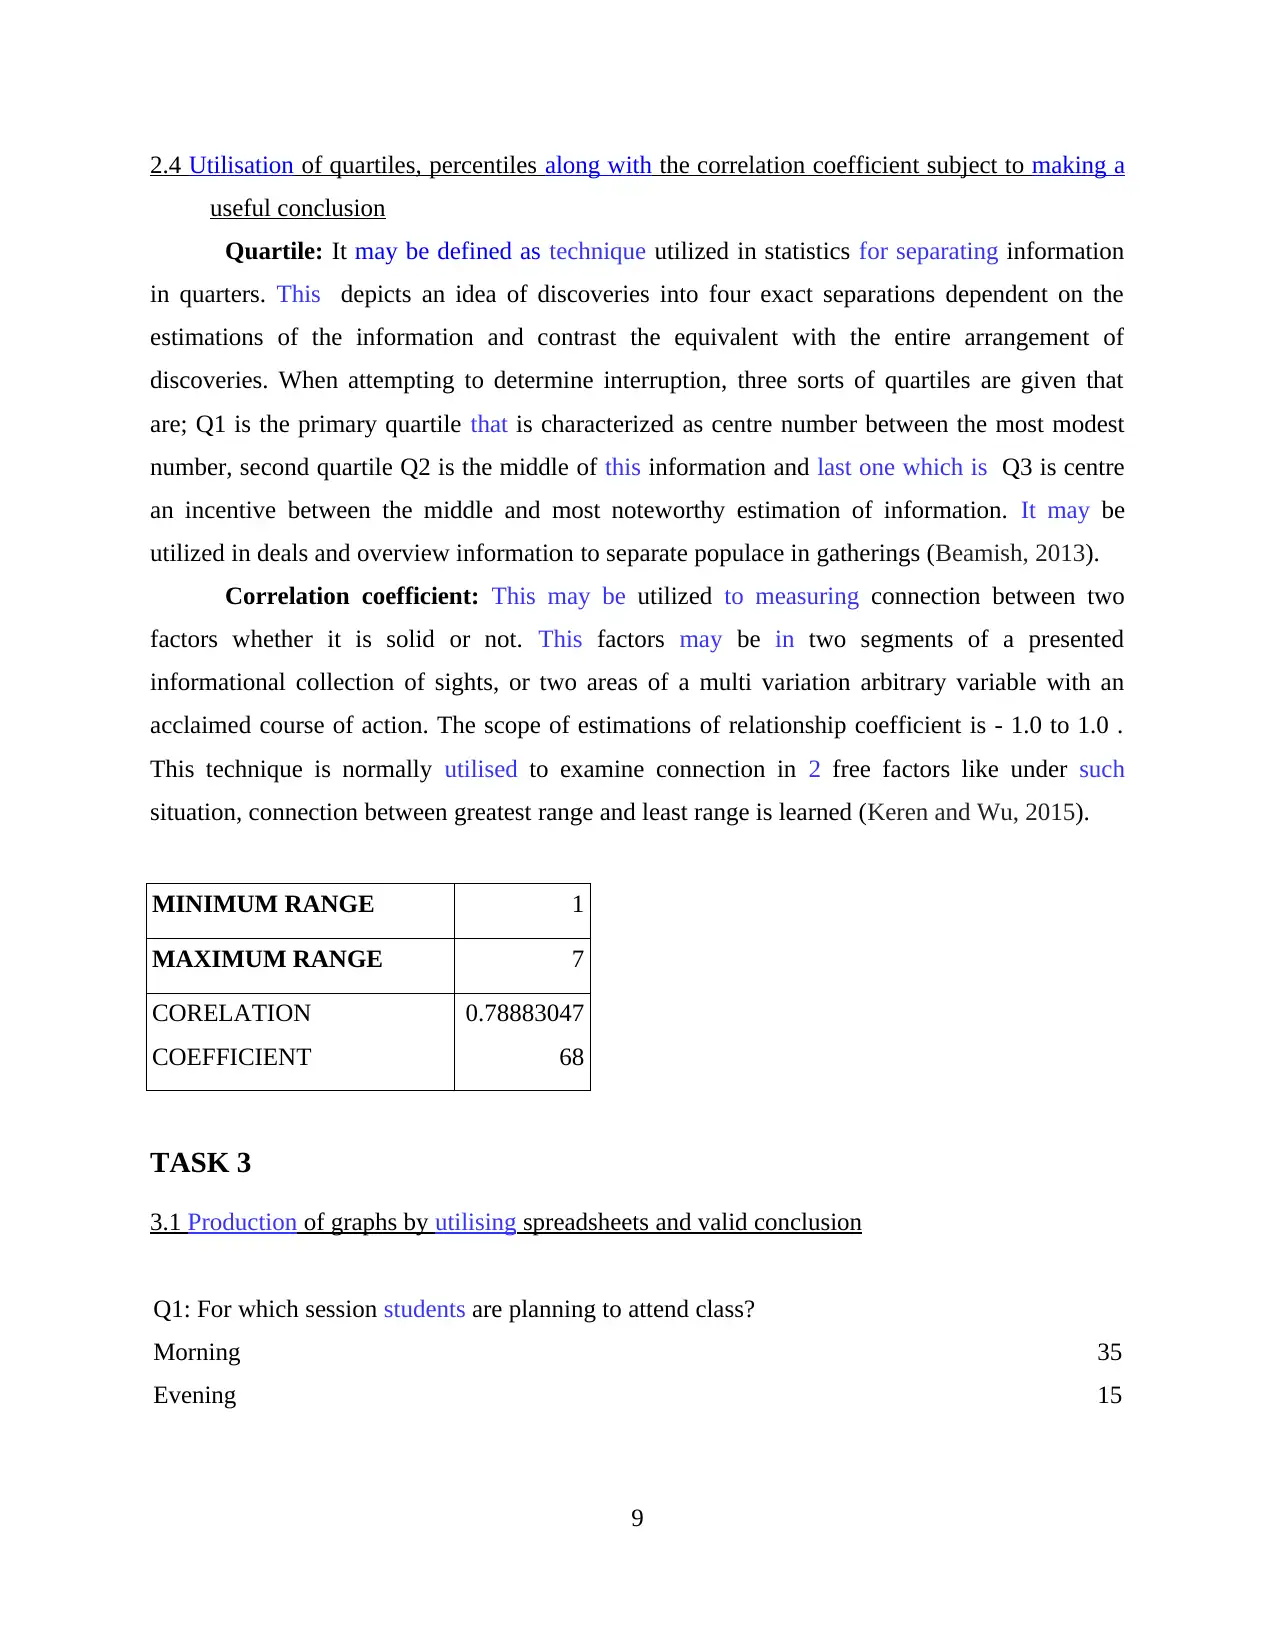
2.4 Utilisation of quartiles, percentiles along with the correlation coefficient subject to making a
useful conclusion
Quartile: It may be defined as technique utilized in statistics for separating information
in quarters. This depicts an idea of discoveries into four exact separations dependent on the
estimations of the information and contrast the equivalent with the entire arrangement of
discoveries. When attempting to determine interruption, three sorts of quartiles are given that
are; Q1 is the primary quartile that is characterized as centre number between the most modest
number, second quartile Q2 is the middle of this information and last one which is Q3 is centre
an incentive between the middle and most noteworthy estimation of information. It may be
utilized in deals and overview information to separate populace in gatherings (Beamish, 2013).
Correlation coefficient: This may be utilized to measuring connection between two
factors whether it is solid or not. This factors may be in two segments of a presented
informational collection of sights, or two areas of a multi variation arbitrary variable with an
acclaimed course of action. The scope of estimations of relationship coefficient is - 1.0 to 1.0 .
This technique is normally utilised to examine connection in 2 free factors like under such
situation, connection between greatest range and least range is learned (Keren and Wu, 2015).
MINIMUM RANGE 1
MAXIMUM RANGE 7
CORELATION
COEFFICIENT
0.78883047
68
TASK 3
3.1 Production of graphs by utilising spreadsheets and valid conclusion
Q1: For which session students are planning to attend class?
Morning 35
Evening 15
9
⊘ This is a preview!⊘
Do you want full access?
Subscribe today to unlock all pages.
Trusted by 1+ million students worldwide
1 out of 23
Related Documents


Your All-in-One AI-Powered Toolkit for Academic Success.
+13062052269
info@desklib.com
Available 24*7 on WhatsApp / Email
![[object Object]](/_next/static/media/star-bottom.7253800d.svg)
Unlock your academic potential
Copyright © 2020–2026 A2Z Services. All Rights Reserved. Developed and managed by ZUCOL.