Report on Business Decision Making for Faith Limited (London Market)
VerifiedAdded on 2020/01/16
|40
|5067
|174
Report
AI Summary
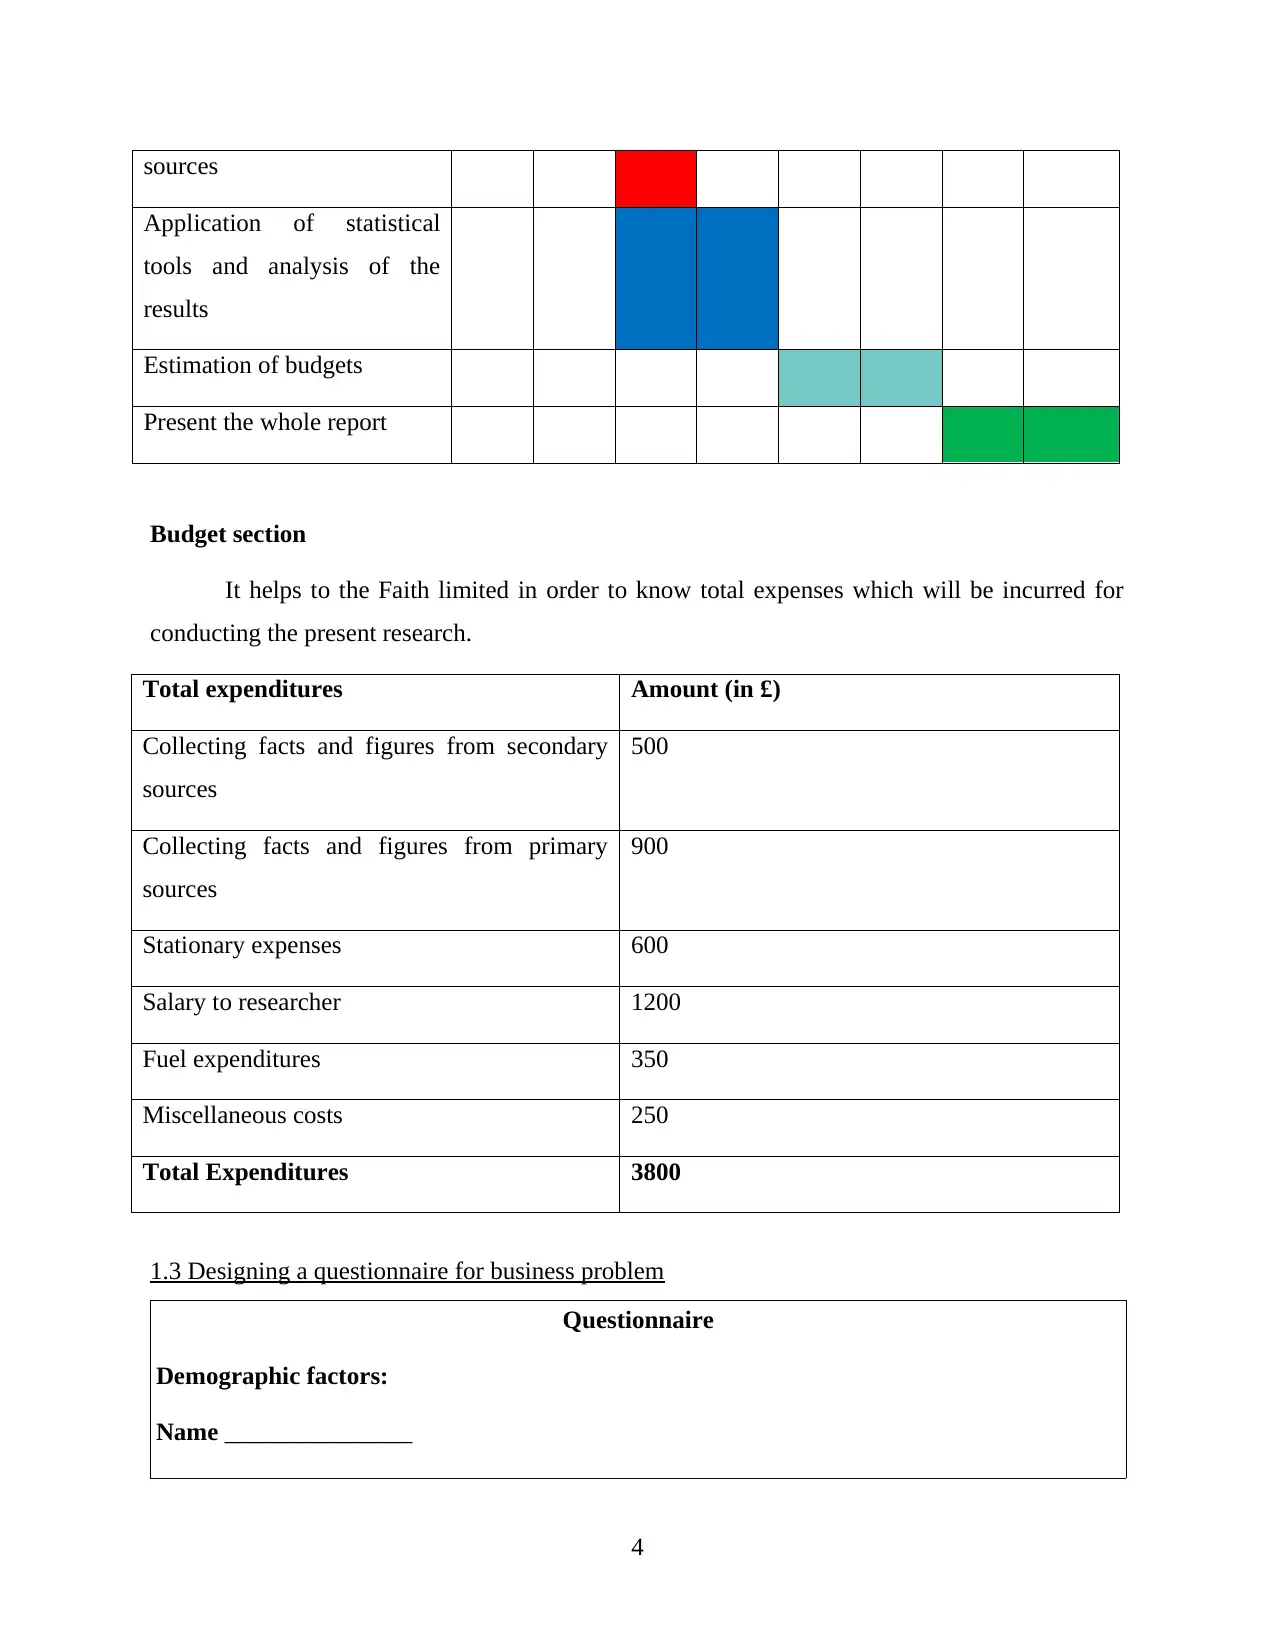
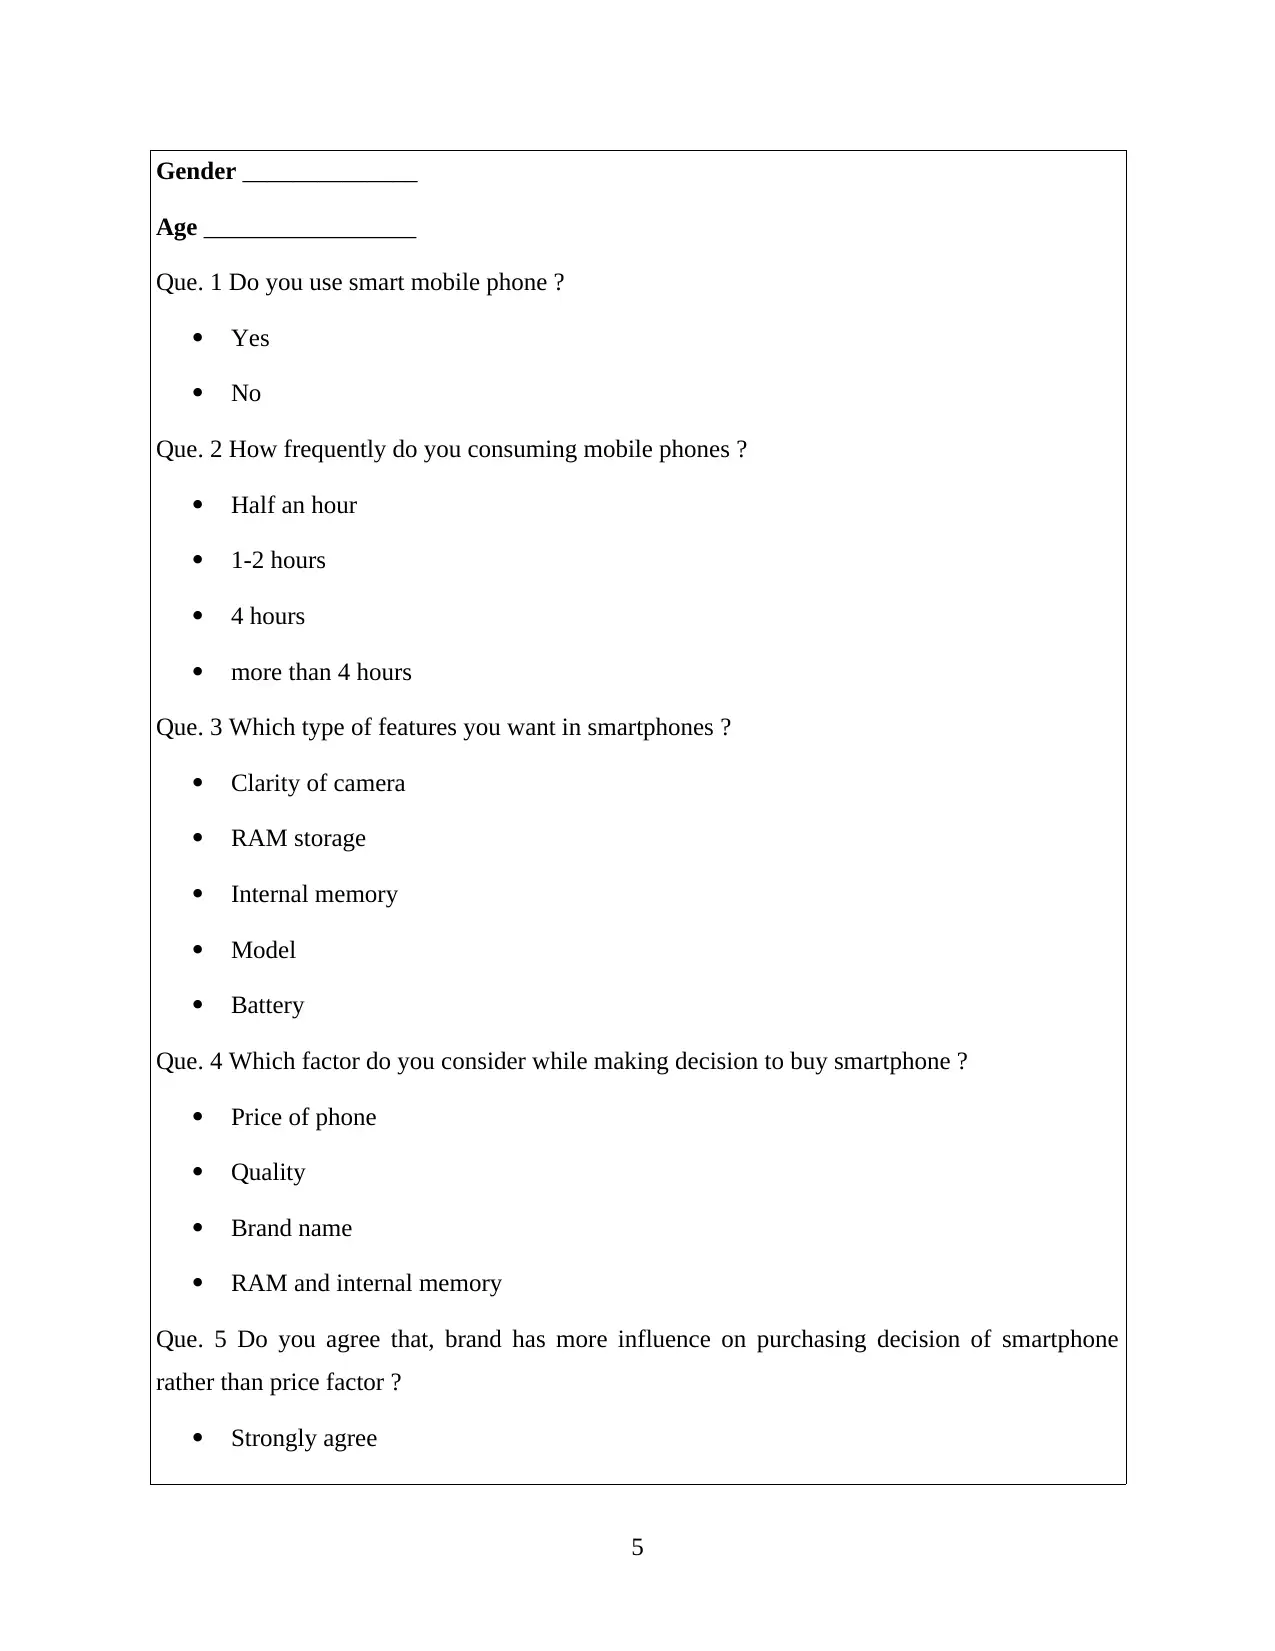
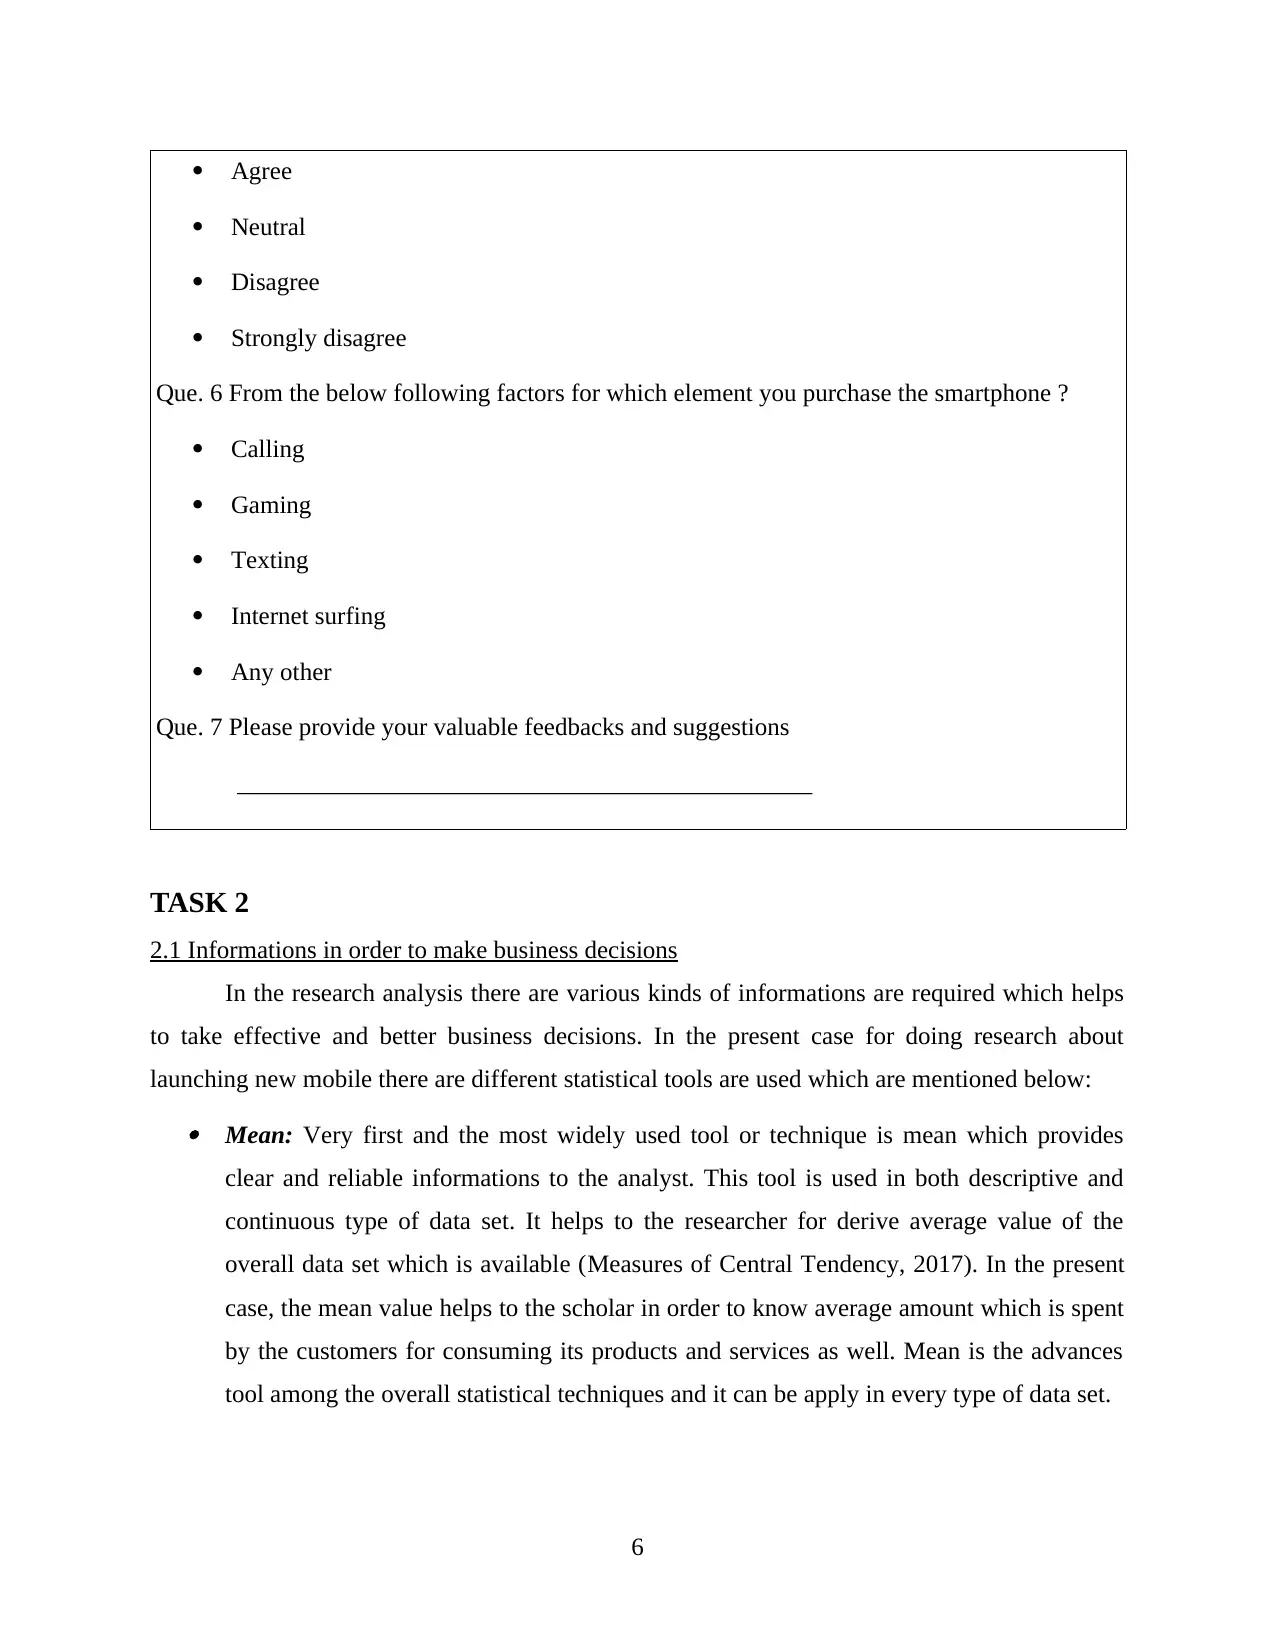
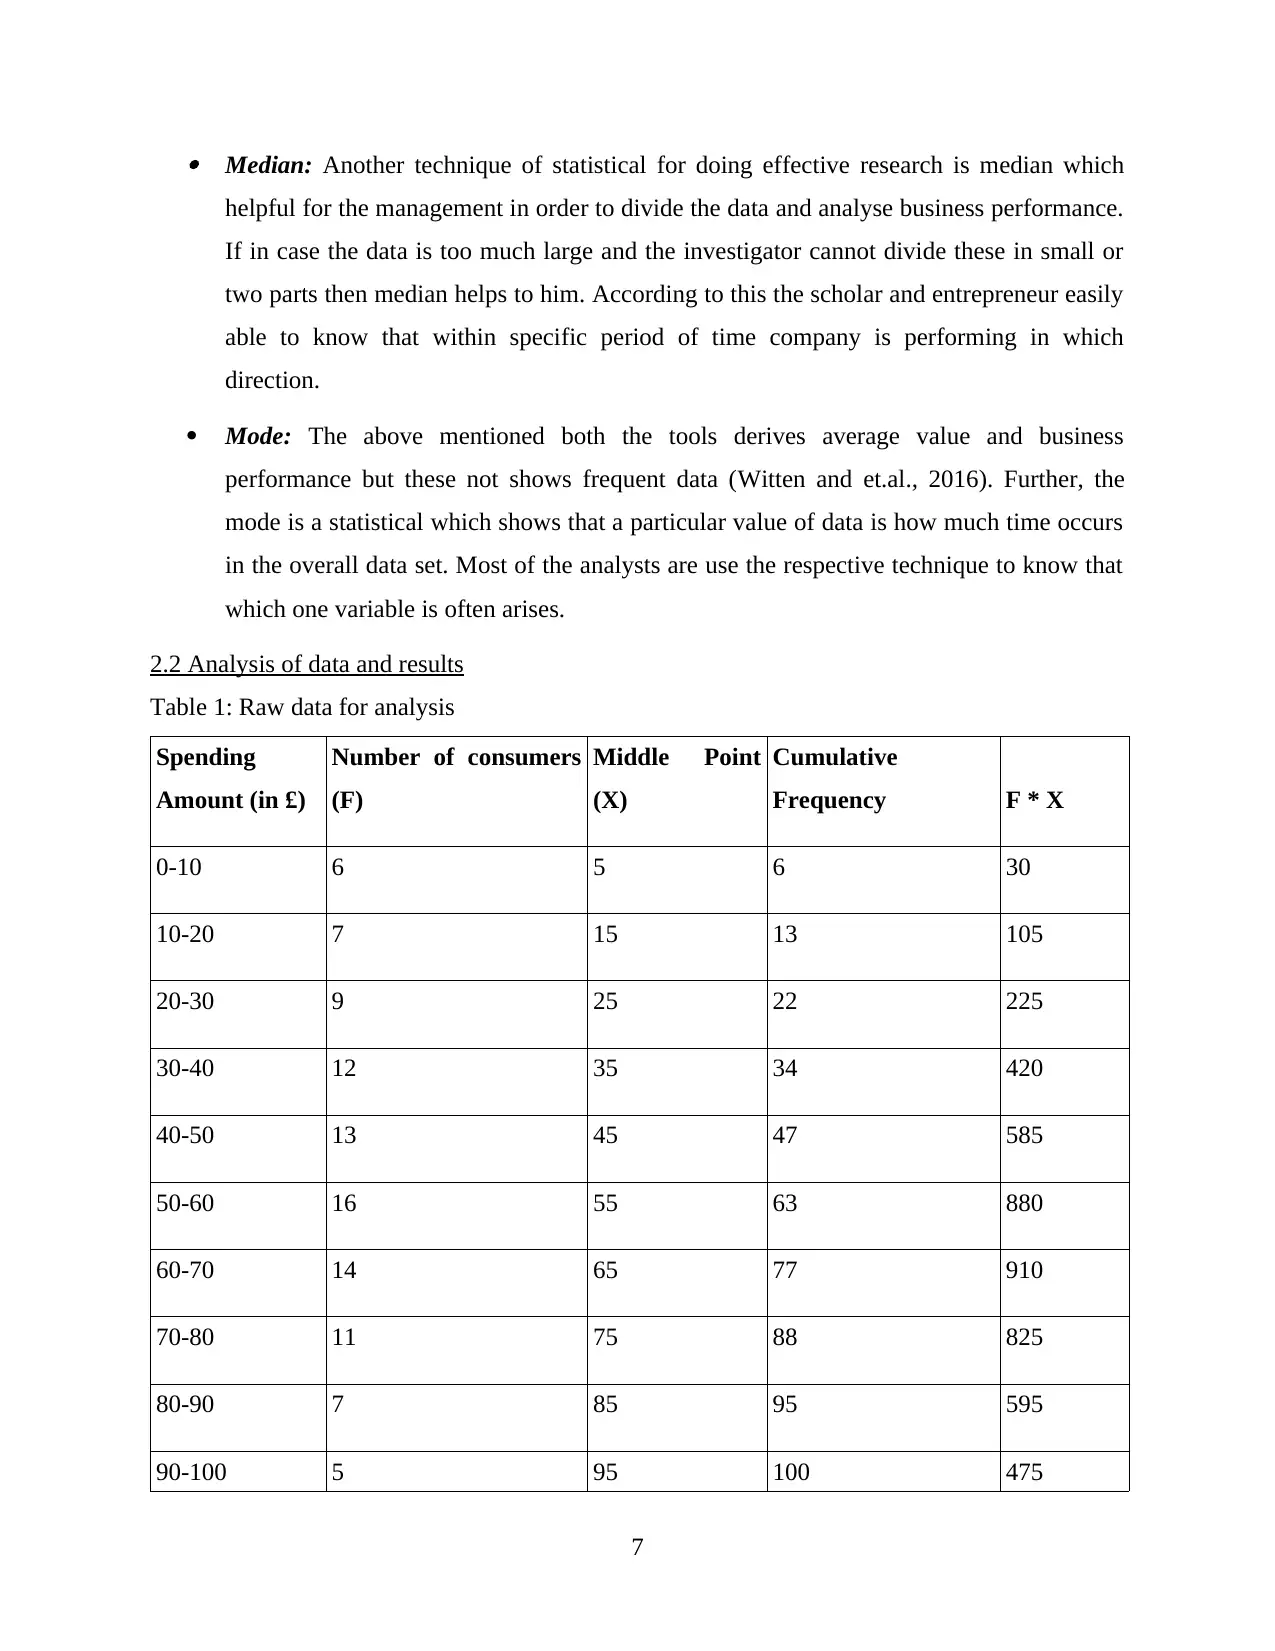
This report provides a comprehensive analysis of business decision-making strategies for Faith Limited, focusing on the launch of a new mobile phone in the London market. The report begins with an introduction outlining the importance of effective business decisions and the role of research in achieving profitability. It then details the use of primary and secondary data, including survey methodologies and questionnaire design, to understand consumer demand. The report further explores various statistical tools such as mean, median, and mode to analyze sales, costs, and profit variables. Additionally, it covers project management tools like network diagrams and financial tools to support investment decisions. The findings are presented through tables, graphs, and detailed calculations, offering insights into market trends and consumer behavior. The report concludes with recommendations for Faith Limited to optimize its business strategies and improve its performance within the competitive telecommunications industry, and is available on Desklib for student reference.

BUSINESS DECISION
MAKING
MAKING
Paraphrase This Document
Need a fresh take? Get an instant paraphrase of this document with our AI Paraphraser


1
⊘ This is a preview!⊘
Do you want full access?
Subscribe today to unlock all pages.

Trusted by 1+ million students worldwide

INTRODUCTION
In the corporate world, it is important to take effective and beneficial business decisions
which help the entrepreneur to earn higher profit. Further, for making effective business
decision, research is to be required as well as there are another tools also available which used by
researcher. In the present report, there is a Faith limited company which is going to launch a new
mobile phone in the London market. For doing research in the present case primary as well as
secondary data are to be used. It shows different statistical tools and techniques which can help
the Faith limited in taking beneficial business decisions. Beside this, the report presents various
graphs and charts on the basis of sales, cost and profit variables. At the last, it focuses on project
management tools such as network diagram as well as different financial tools for taking
effective investment decisions.
TASK 1
1.1 Plan for primary and secondary data collection
Background
In the technological sector, there are various techniques are came up with new and
innovative features which are helpful for the people. In the mobile world, there are numerous
smartphones launched by the firms with the highly innovative features. The present research is
conducted by the scholar to know demand of customers and to analyse that which features are to
be added in the new mobile phone (Schulam and Saria, 2015). In the present research, primary
data are collected from the questionnaire and survey while secondary data are derived from
annual report of Faith limited enterprise.
Rationale
Research is to be conducted for analyzing the needs and wants of consumers. In the
present case, the management of Faith limited doing the research in order to know that the new
smartphone will be beneficial for the local community or not after launching it. Further, due to
this, the firm can know about wide opportunities which are available in the industry of
telecommunication.
Objective of research
2
Paraphrase This Document
Need a fresh take? Get an instant paraphrase of this document with our AI Paraphraser

Due to conducting respective research, the main objective is to know the demand of local
community of London in terms of features of smartphones. Further, another objective is that, to
identify that the new mobile phone will be beneficial and useful for the customers or not.
1.2 Presenting survey methodology and sampling frame
Survey methodology
In order to do present research, both qualitative and quantitative techniques are used.
Qualitative research is based on thematic data where questionnaire, interview survey etc. are
considered. Further, another method i.e. quantitative is based on secondary data where different
mathematical and statistical tools are used (Indiveri and Liu, 2015). In the present case for doing
research, questionnaire will be framed and will be distributed among the 50 people of London
using online survey. Feedbacks from the people are also taken through online because it is time
saving method and provide clear data set. Sample of 50 people is derived from local community
of London with help of simple random sampling method. In order collect secondary data, annual
report of Faith limited is used.
Data analysis
For doing the primary research, thematic analysis is used which is appropriate for the
Faith limited. Further, for analysing secondary data various statistical tools or measure of
dispersion are used like as mean, median, mode, standard deviation, correlation etc.
Time frame
With the time frame management of Faith limited, it is able to know that how many days
will be taken for completing the overall research (Anderson and Whitcomb, 2016).
Activities / duration in days 3 5 7 6 9 11 16 18
Analysis of the contextual
Preparation of objectives for
the present research
Making the plan for research
Collection of data from
primary and secondary
3

sources
Application of statistical
tools and analysis of the
results
Estimation of budgets
Present the whole report
Budget section
It helps to the Faith limited in order to know total expenses which will be incurred for
conducting the present research.
Total expenditures Amount (in £)
Collecting facts and figures from secondary
sources
500
Collecting facts and figures from primary
sources
900
Stationary expenses 600
Salary to researcher 1200
Fuel expenditures 350
Miscellaneous costs 250
Total Expenditures 3800
1.3 Designing a questionnaire for business problem
Questionnaire
Demographic factors:
Name _______________
4
⊘ This is a preview!⊘
Do you want full access?
Subscribe today to unlock all pages.

Trusted by 1+ million students worldwide

Gender ______________
Age _________________
Que. 1 Do you use smart mobile phone ?
Yes
No
Que. 2 How frequently do you consuming mobile phones ?
Half an hour
1-2 hours
4 hours
more than 4 hours
Que. 3 Which type of features you want in smartphones ?
Clarity of camera
RAM storage
Internal memory
Model
Battery
Que. 4 Which factor do you consider while making decision to buy smartphone ?
Price of phone
Quality
Brand name
RAM and internal memory
Que. 5 Do you agree that, brand has more influence on purchasing decision of smartphone
rather than price factor ?
Strongly agree
5
Paraphrase This Document
Need a fresh take? Get an instant paraphrase of this document with our AI Paraphraser

Agree
Neutral
Disagree
Strongly disagree
Que. 6 From the below following factors for which element you purchase the smartphone ?
Calling
Gaming
Texting
Internet surfing
Any other
Que. 7 Please provide your valuable feedbacks and suggestions
______________________________________________
TASK 2
2.1 Informations in order to make business decisions
In the research analysis there are various kinds of informations are required which helps
to take effective and better business decisions. In the present case for doing research about
launching new mobile there are different statistical tools are used which are mentioned below: Mean: Very first and the most widely used tool or technique is mean which provides
clear and reliable informations to the analyst. This tool is used in both descriptive and
continuous type of data set. It helps to the researcher for derive average value of the
overall data set which is available (Measures of Central Tendency, 2017). In the present
case, the mean value helps to the scholar in order to know average amount which is spent
by the customers for consuming its products and services as well. Mean is the advances
tool among the overall statistical techniques and it can be apply in every type of data set.
6

Median: Another technique of statistical for doing effective research is median which
helpful for the management in order to divide the data and analyse business performance.
If in case the data is too much large and the investigator cannot divide these in small or
two parts then median helps to him. According to this the scholar and entrepreneur easily
able to know that within specific period of time company is performing in which
direction.
Mode: The above mentioned both the tools derives average value and business
performance but these not shows frequent data (Witten and et.al., 2016). Further, the
mode is a statistical which shows that a particular value of data is how much time occurs
in the overall data set. Most of the analysts are use the respective technique to know that
which one variable is often arises.
2.2 Analysis of data and results
Table 1: Raw data for analysis
Spending
Amount (in £)
Number of consumers
(F)
Middle Point
(X)
Cumulative
Frequency F * X
0-10 6 5 6 30
10-20 7 15 13 105
20-30 9 25 22 225
30-40 12 35 34 420
40-50 13 45 47 585
50-60 16 55 63 880
60-70 14 65 77 910
70-80 11 75 88 825
80-90 7 85 95 595
90-100 5 95 100 475
7
⊘ This is a preview!⊘
Do you want full access?
Subscribe today to unlock all pages.

Trusted by 1+ million students worldwide

Total 100 5050
Table 2: Computation of mean, median and mode
Formula Value
Mean ∑FX/∑F = 5050/100
= £50.5
Median Lower limit + (∑F/2-
Cumulative Frequency of
previous CI)/Frequency * i
50+(50-47)/16*10
= £51.9
Mode lower limit + (F1 – F0) / (2 *
F1 – F0 – F2) * Class Interval
= 50+(13-16)/(2*13-16-14)*10
= £51.8
Analysis Mean: It can be analysed from the above mentioned calculation that at the shop of Faith
limited there is average amount spent of worth £50.5. At the respective amount there are
only 16 customers are purchasing its goods and services. After this number of buyers is
continuously reducing i.e. 14, 11, 7 and 5. Hence, it can be said that the management of
Faith limited needs to offer attractive discounts and offers for increase sales and number
of consumers (Varmuza and Filzmoser, 2016). Median: According to the median tool it can be interpreted that in the business of Faith
limited there are middle value is £51.9. At this level there is 16 customers are spending
on it and consuming products and services offered by the respective entity. Above the
middle level customers are increases from the start. On the other side after this attraction
of buyers is continuously reduced. In order to overcome such situation management
requires to use effective strategies which lead to increase customers and sales as well.
8
Paraphrase This Document
Need a fresh take? Get an instant paraphrase of this document with our AI Paraphraser

Mode: On the basis of value of mode it can be interpreted that there are only 16 number
of users are frequently purchasing goods and services which are offered by the Faith
limited. Moreover, most frequent amount spent by these 16 customers is of worth £51.8
in its firm (Sprent and Smeeton, 2016). The company needs to take corrective action in
order to improve its performance in the industry.
2.3 Analysis of data with help of measures of dispersion
Amount spent
(in £)
Number of
consumers (F)
Middle
Point (X) F*X
Cumulative
Frequency X^2 F*X^2
0-10 6 5 30 6 225 900
10-20 7 15 105 13 225 11025
20-30 9 25 225 22 625 50625
30-40 12 35 420 34 1225 176400
40-50 13 45 585 47 169 342225
50-60 16 55 880 63 3025 774400
60-70 14 65 910 77 4225 828100
70-80 11 75 825 88 5625 680625
80-90 7 85 595 95 7225 354025
90-100 5 95 475 100 9025 225625
Total 100 31594 3443950
Table 3: Computation of Standard deviation
9

Formula Value
Range Higher value – lower value = 100-0
= £100
Standard deviation (S) √Variance = ∑Fx2 – ((∑Fx) 2 /
n) / n – 1
= √32211.36
= £179.46
Analysis Range: It is a tool which shows different between the highest as well as lowest value
from the overall amount spent by customers. In the present case difference of highest and
lowest value (100-0) is £100.
Standard deviation: The tool which shows difference among the actual value and mean
or average value is known as standard deviation. The tool is mostly used by the
researcher in order to analyse gap among the mean as well as final outcome of the data
set. Lower the value of standard deviation lead to reduce performance of the firm such as
Faith limited because it declines difference among both the values (Weise and Chiong,
2015). In the present case standard deviation value is £179.46 which is far from the
average value that is £50.5. It shows that there is higher difference and deviate up to
greater extent from the mean value. It can be said that customers of the business entity
are increases and their level of purchase as well.
2.4 Quartiles, percentiles and correlation coefficient
In order to do research there are different measure of dispersions are helpful for the
scholar in order to do effective analysis. The measures are such as quartile, percentile and
correlation are calculated as below:
Table 4: Computation of quartile
Quartiles Value
Lower Quartile (Q1) = £32.5
10
⊘ This is a preview!⊘
Do you want full access?
Subscribe today to unlock all pages.

Trusted by 1+ million students worldwide
1 out of 40
Related Documents

Your All-in-One AI-Powered Toolkit for Academic Success.
+13062052269
info@desklib.com
Available 24*7 on WhatsApp / Email
Unlock your academic potential
Copyright © 2020–2025 A2Z Services. All Rights Reserved. Developed and managed by ZUCOL.