Business Decisions: Financial Analysis of Sainsbury and Tesco
VerifiedAdded on 2020/01/23
|28
|5940
|232
Report
AI Summary
This report provides a comprehensive financial analysis of the business decisions made by Sainsbury and Tesco, two leading UK retail organizations. It begins with an introduction to business decision-making and its impact on company performance. The report examines primary data collection methods, including questionnaires, and details the survey methodology and sampling frame used. Statistical tools are applied to summarize and analyze financial data, including sales and operating profit, using representative values, measures of dispersion, quartile, percentile, and correlation results. The report includes graphical representations of sales and operating profit trends for both companies, as well as an analysis of consumer purchase decisions. Furthermore, it explores investment appraisal tools, such as payback period, accounting rate of return, net present value, and internal rate of return, used for decision-making. The report concludes with a critical path method analysis and a discussion of the findings in a formal business report format.
BUSINESS DECISIONS
MAKING
MAKING
Paraphrase This Document
Need a fresh take? Get an instant paraphrase of this document with our AI Paraphraser
Table of Contents
INTRODUCTION...........................................................................................................................1
TASK 1............................................................................................................................................1
1.1 Plan for the collection of primary data.............................................................................1
1.2 Survey methodology and sampling frame used................................................................2
1.3 Questionnaire on Sainsbury..............................................................................................3
TASK 2............................................................................................................................................4
2.1 Summarize the data by using representative values and measures of dispersion.............4
2.2 & 2.3 Analysis of data......................................................................................................6
2.4 Analysis of quartile, percentile and correlation results....................................................7
4.1 Appropriate information processing tools........................................................................8
TASK 3............................................................................................................................................9
3.1 Graph of Sainsbury and Tesco sales and operating profit and primary data....................9
3.2 & 4.1 Trend lines of Sainsbury and Tesco in respect to sales........................................17
3.3 Covered in PPT...............................................................................................................18
3.4 Formal business report...................................................................................................18
TASK 4..........................................................................................................................................19
4.2 Critical path method.......................................................................................................19
4.3 Use of financial tools for decisions making...................................................................20
CONCLUSION..............................................................................................................................24
REFERENCES..............................................................................................................................26
Index of Tables
Table 1: Sainsbury’s sale and operating profit................................................................................4
Table 2: Statistical measurement of Sainsbury sales and operating profit......................................5
Table 3: Tesco sales and operating profit from FY 1997- FY 2012................................................5
Table 4: Statistical measurement of Tesco sales and operating profit.............................................6
Table 5: Quartile of Sainsbury in sales and operating profit...........................................................7
Table 6: Quartile of Tesco in sales and operating profit.................................................................7
Table 7: Correlation of Tesco and Sainsbury between sales and operating profit..........................8
Table 8: Calculation of payback period method............................................................................20
Table 9: Calculation of ARR method............................................................................................21
Table 10: Calculation of NPV.......................................................................................................22
Table 11: Calculation of IRR.........................................................................................................23
Illustration Index
Illustration 1: Sainsbury sales........................................................................................................13
Illustration 2: Sainsbury operating profit.......................................................................................14
Illustration 3: Tesco sales chart......................................................................................................15
Illustration 4: Tesco operating profit.............................................................................................16
Illustration 5: Which factor given below mostly affects your purchase decisions?......................17
Illustration 6: Do you think that employees of Sainsbury treat customers in proper manner.......17
Illustration 7: Do you think that employees of Sainsbury treat customers in proper manner.......19
Illustration 8: Sales trend line of Tesco.........................................................................................20
⊘ This is a preview!⊘
Do you want full access?
Subscribe today to unlock all pages.
Trusted by 1+ million students worldwide
INTRODUCTION
Business decision making is termed as most crucial aspect of business management that
is having direct impact on the performance and growth of company. For taking appropriate
business decision such as business expansion, cost control, sales management etc., several
elements are considered by managers of organization in the form of current business
performance, potential growth within business environment etc. In addition to that success of
management decision is greatly depending on appropriateness of business decisions. In order to
survive in highly competitive market, an efficient decision making system helps managers in
identification of new sources of funds, expansion of business within new emerging market and
reduction in expenses of organization. The present report is going to examine different aspects of
strategic decisions and tools with reference to management operations of Sainsbury. It is one of
the leading retail organizations of UK. It reports also determines the use of primary data
associated with views of consumers in order to evaluate quality of different product and services.
This report applies different kinds of statistical tools and concept in evaluation of profitability of
company along with current financial position of company. The study also evaluates the
application of different investment appraisal tools through which business entity is able to take
appropriate investment decisions.
TASK 1
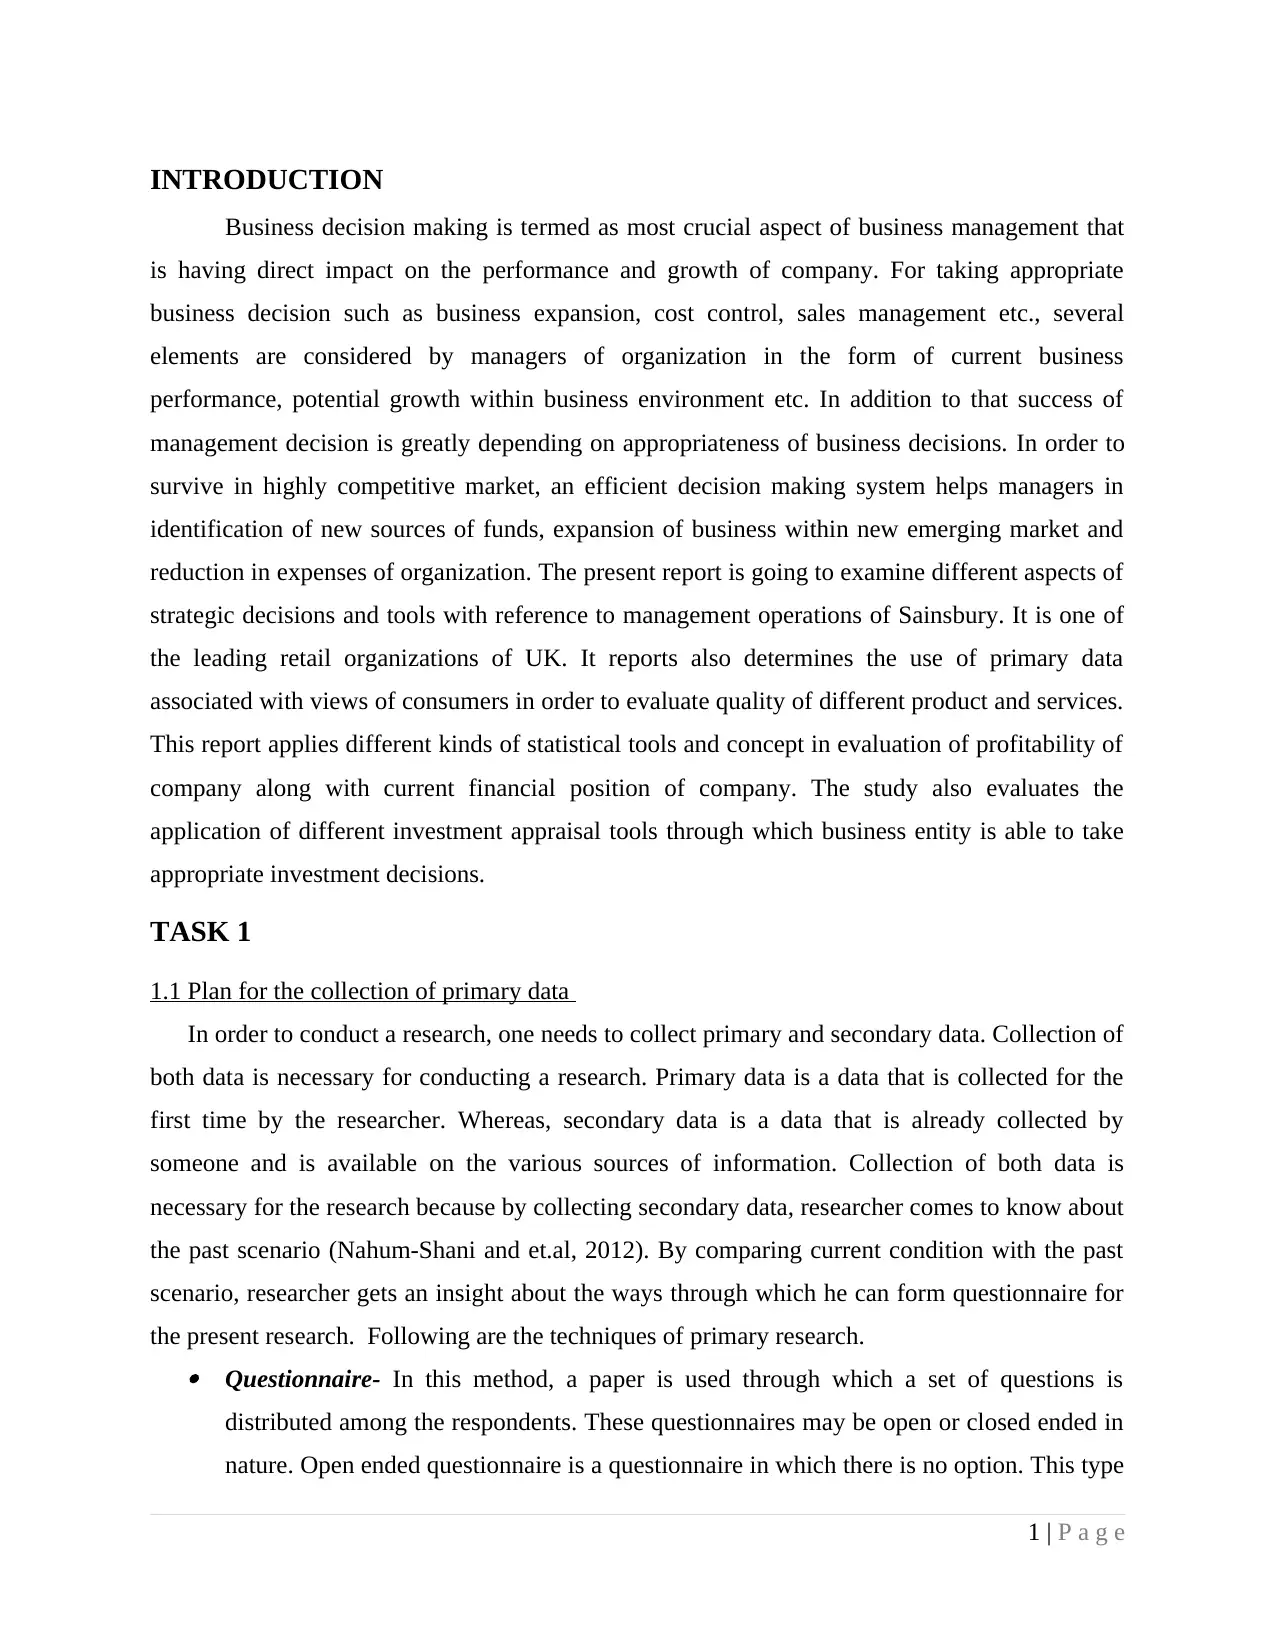
1.1 Plan for the collection of primary data
In order to conduct a research, one needs to collect primary and secondary data. Collection of
both data is necessary for conducting a research. Primary data is a data that is collected for the
first time by the researcher. Whereas, secondary data is a data that is already collected by
someone and is available on the various sources of information. Collection of both data is
necessary for the research because by collecting secondary data, researcher comes to know about
the past scenario (Nahum-Shani and et.al, 2012). By comparing current condition with the past
scenario, researcher gets an insight about the ways through which he can form questionnaire for
the present research. Following are the techniques of primary research. Questionnaire- In this method, a paper is used through which a set of questions is
distributed among the respondents. These questionnaires may be open or closed ended in
nature. Open ended questionnaire is a questionnaire in which there is no option. This type
1 | P a g e
Business decision making is termed as most crucial aspect of business management that
is having direct impact on the performance and growth of company. For taking appropriate
business decision such as business expansion, cost control, sales management etc., several
elements are considered by managers of organization in the form of current business
performance, potential growth within business environment etc. In addition to that success of
management decision is greatly depending on appropriateness of business decisions. In order to
survive in highly competitive market, an efficient decision making system helps managers in
identification of new sources of funds, expansion of business within new emerging market and
reduction in expenses of organization. The present report is going to examine different aspects of
strategic decisions and tools with reference to management operations of Sainsbury. It is one of
the leading retail organizations of UK. It reports also determines the use of primary data
associated with views of consumers in order to evaluate quality of different product and services.
This report applies different kinds of statistical tools and concept in evaluation of profitability of
company along with current financial position of company. The study also evaluates the
application of different investment appraisal tools through which business entity is able to take
appropriate investment decisions.
TASK 1
1.1 Plan for the collection of primary data
In order to conduct a research, one needs to collect primary and secondary data. Collection of
both data is necessary for conducting a research. Primary data is a data that is collected for the
first time by the researcher. Whereas, secondary data is a data that is already collected by
someone and is available on the various sources of information. Collection of both data is
necessary for the research because by collecting secondary data, researcher comes to know about
the past scenario (Nahum-Shani and et.al, 2012). By comparing current condition with the past
scenario, researcher gets an insight about the ways through which he can form questionnaire for
the present research. Following are the techniques of primary research. Questionnaire- In this method, a paper is used through which a set of questions is
distributed among the respondents. These questionnaires may be open or closed ended in
nature. Open ended questionnaire is a questionnaire in which there is no option. This type
1 | P a g e
Paraphrase This Document
Need a fresh take? Get an instant paraphrase of this document with our AI Paraphraser
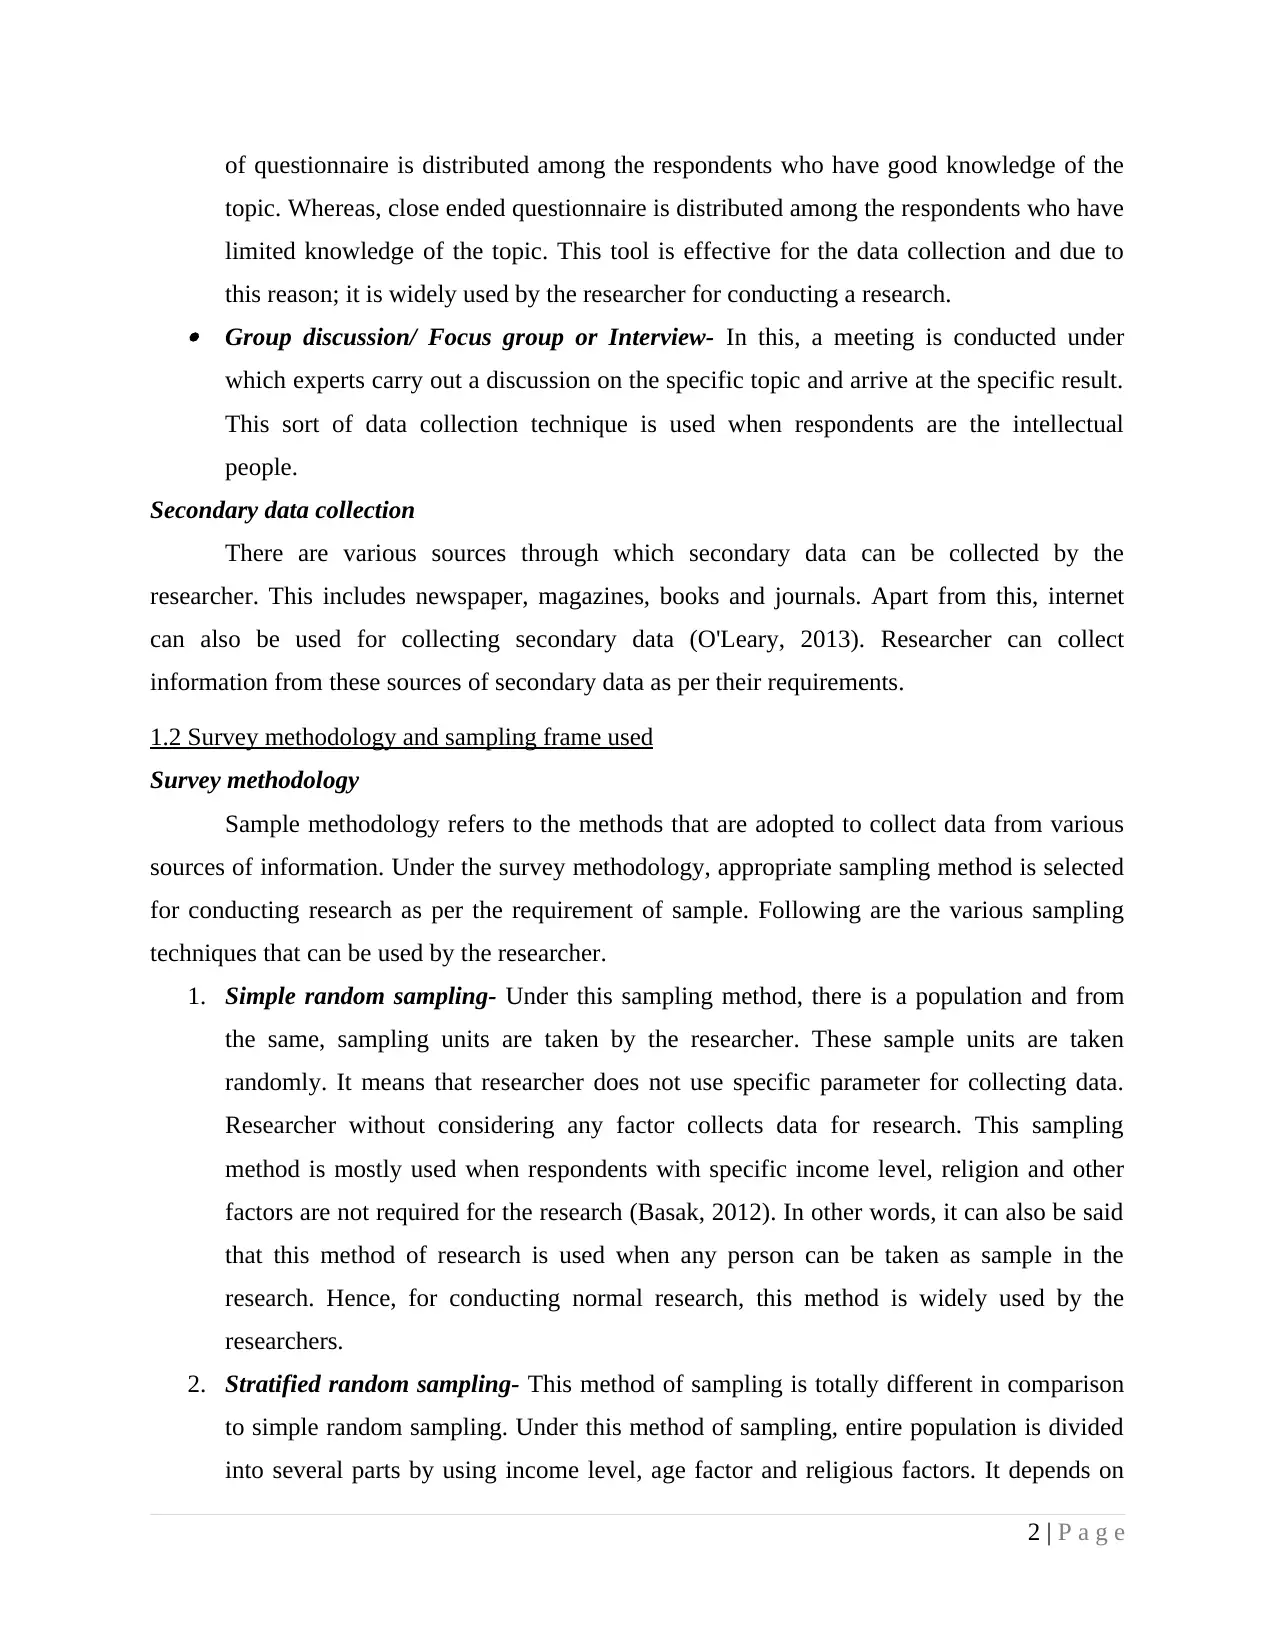
of questionnaire is distributed among the respondents who have good knowledge of the
topic. Whereas, close ended questionnaire is distributed among the respondents who have
limited knowledge of the topic. This tool is effective for the data collection and due to
this reason; it is widely used by the researcher for conducting a research. Group discussion/ Focus group or Interview- In this, a meeting is conducted under
which experts carry out a discussion on the specific topic and arrive at the specific result.
This sort of data collection technique is used when respondents are the intellectual
people.
Secondary data collection
There are various sources through which secondary data can be collected by the
researcher. This includes newspaper, magazines, books and journals. Apart from this, internet
can also be used for collecting secondary data (O'Leary, 2013). Researcher can collect
information from these sources of secondary data as per their requirements.
1.2 Survey methodology and sampling frame used
Survey methodology
Sample methodology refers to the methods that are adopted to collect data from various
sources of information. Under the survey methodology, appropriate sampling method is selected
for conducting research as per the requirement of sample. Following are the various sampling
techniques that can be used by the researcher.
1. Simple random sampling- Under this sampling method, there is a population and from
the same, sampling units are taken by the researcher. These sample units are taken
randomly. It means that researcher does not use specific parameter for collecting data.
Researcher without considering any factor collects data for research. This sampling
method is mostly used when respondents with specific income level, religion and other
factors are not required for the research (Basak, 2012). In other words, it can also be said
that this method of research is used when any person can be taken as sample in the
research. Hence, for conducting normal research, this method is widely used by the
researchers.
2. Stratified random sampling- This method of sampling is totally different in comparison
to simple random sampling. Under this method of sampling, entire population is divided
into several parts by using income level, age factor and religious factors. It depends on
2 | P a g e
the researcher that on the basis of which factor he divides entire population into various
strata. This method is suitable when data is needed to be collected from various types of
people in order to collect information about the consumer behavior (Marjudi and et.al,
2012). Like simple random sampling, this method of sampling is also widely used by the
researcher.
1.3 Questionnaire on Sainsbury
Name-
Age
20-30 years
30- 40 years
40-50 years 50-60 years
Gender
Male
Female
Up to what time period, you are the customer of Sainsbury’s?
1-2 years
2-5 years
6-10 years
More than 10 years
How was your experience while you make a purchase from Sainsbury’s?
Excellent
Good
Somewhat
Bad
Very bad
Which factor mostly affects your purchase decision?
Price
Quality
Do you think that employees of Sainsbury treat customers in a proper manner?
Excellent
3 | P a g e
⊘ This is a preview!⊘
Do you want full access?
Subscribe today to unlock all pages.
Trusted by 1+ million students worldwide
Poor
Good
Average
Sainsbury provides its products at reasonable price?
Strongly agree
Agree
Somewhat agree
Disagree
Highly disagree
Do you think that Sainsbury needs to bring improvement in its services?
Yes
No
Please give suggestions regarding improvements
TASK 2
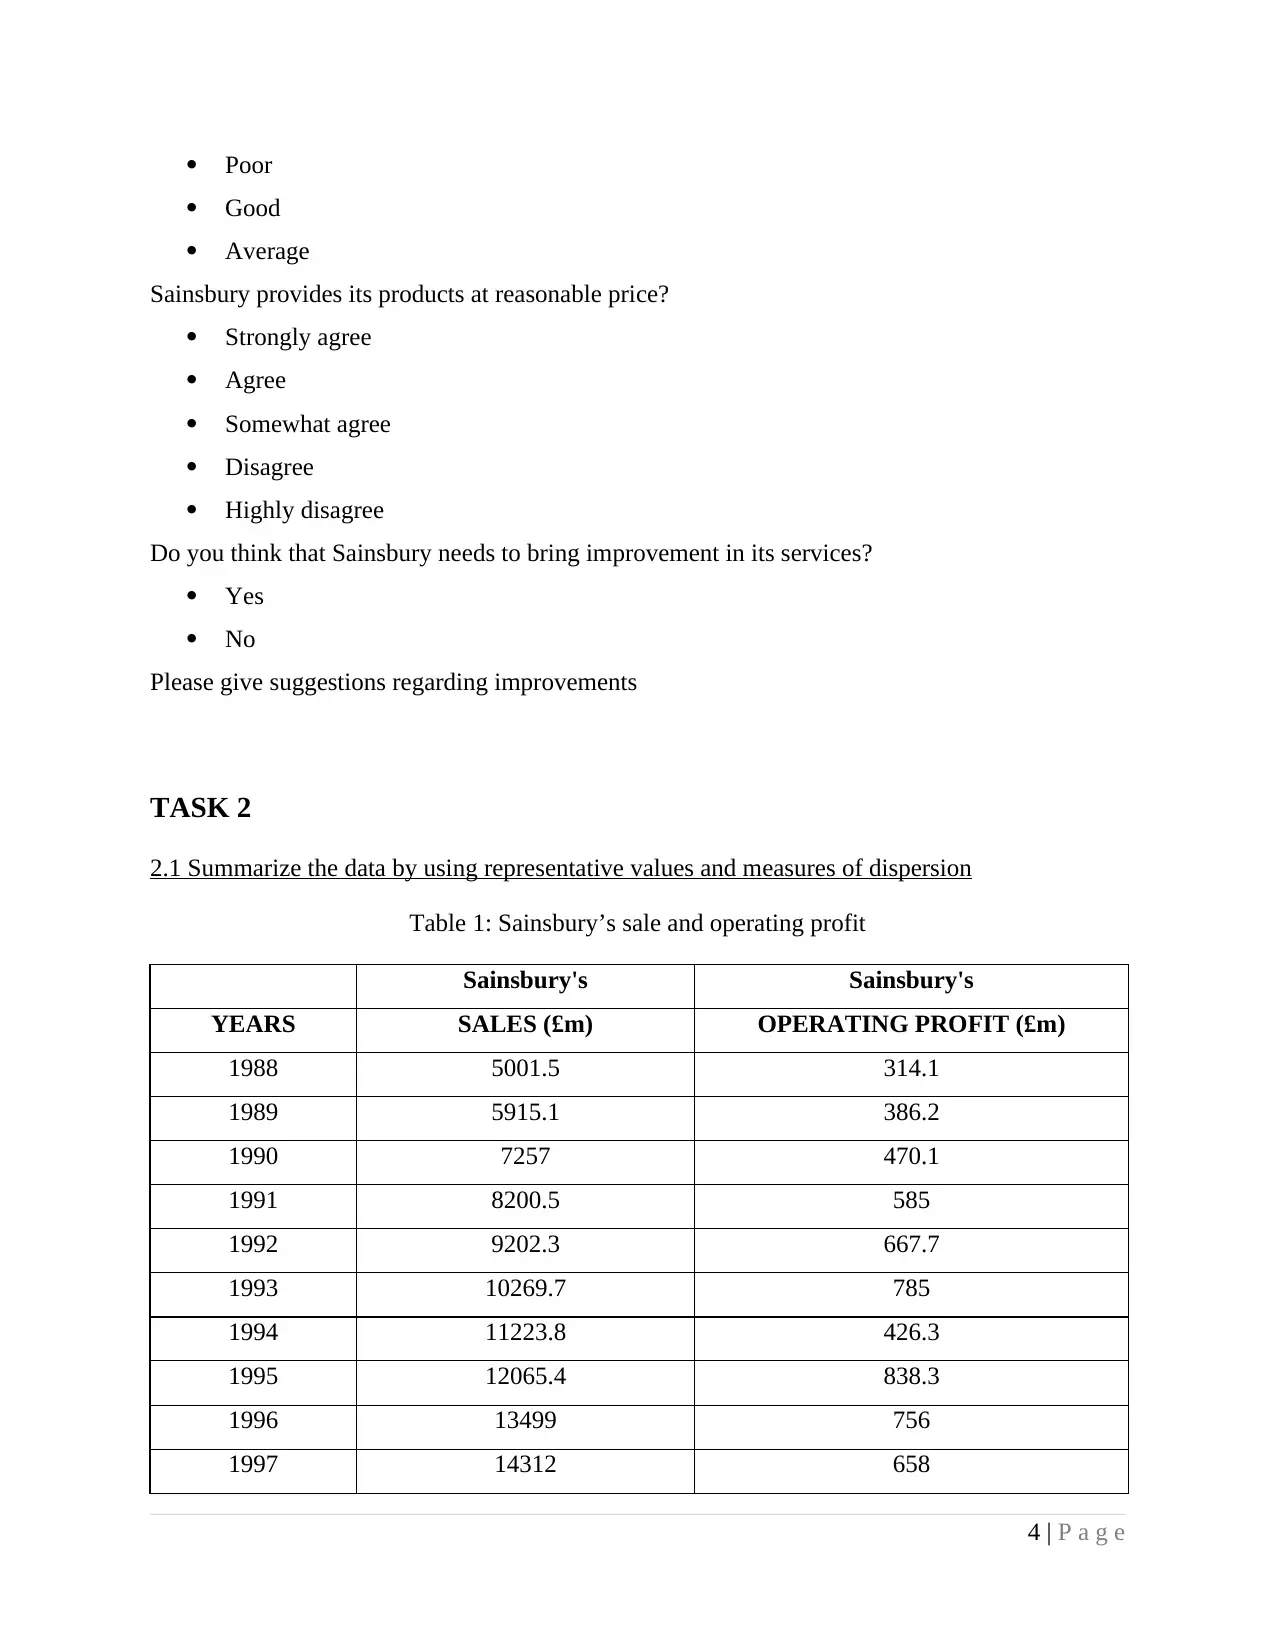
2.1 Summarize the data by using representative values and measures of dispersion
Table 1: Sainsbury’s sale and operating profit
Sainsbury's Sainsbury's
YEARS SALES (£m) OPERATING PROFIT (£m)
1988 5001.5 314.1
1989 5915.1 386.2
1990 7257 470.1
1991 8200.5 585
1992 9202.3 667.7
1993 10269.7 785
1994 11223.8 426.3
1995 12065.4 838.3
1996 13499 756
1997 14312 658
4 | P a g e
Good
Average
Sainsbury provides its products at reasonable price?
Strongly agree
Agree
Somewhat agree
Disagree
Highly disagree
Do you think that Sainsbury needs to bring improvement in its services?
Yes
No
Please give suggestions regarding improvements
TASK 2
2.1 Summarize the data by using representative values and measures of dispersion
Table 1: Sainsbury’s sale and operating profit
Sainsbury's Sainsbury's
YEARS SALES (£m) OPERATING PROFIT (£m)
1988 5001.5 314.1
1989 5915.1 386.2
1990 7257 470.1
1991 8200.5 585
1992 9202.3 667.7
1993 10269.7 785
1994 11223.8 426.3
1995 12065.4 838.3
1996 13499 756
1997 14312 658
4 | P a g e
Paraphrase This Document
Need a fresh take? Get an instant paraphrase of this document with our AI Paraphraser
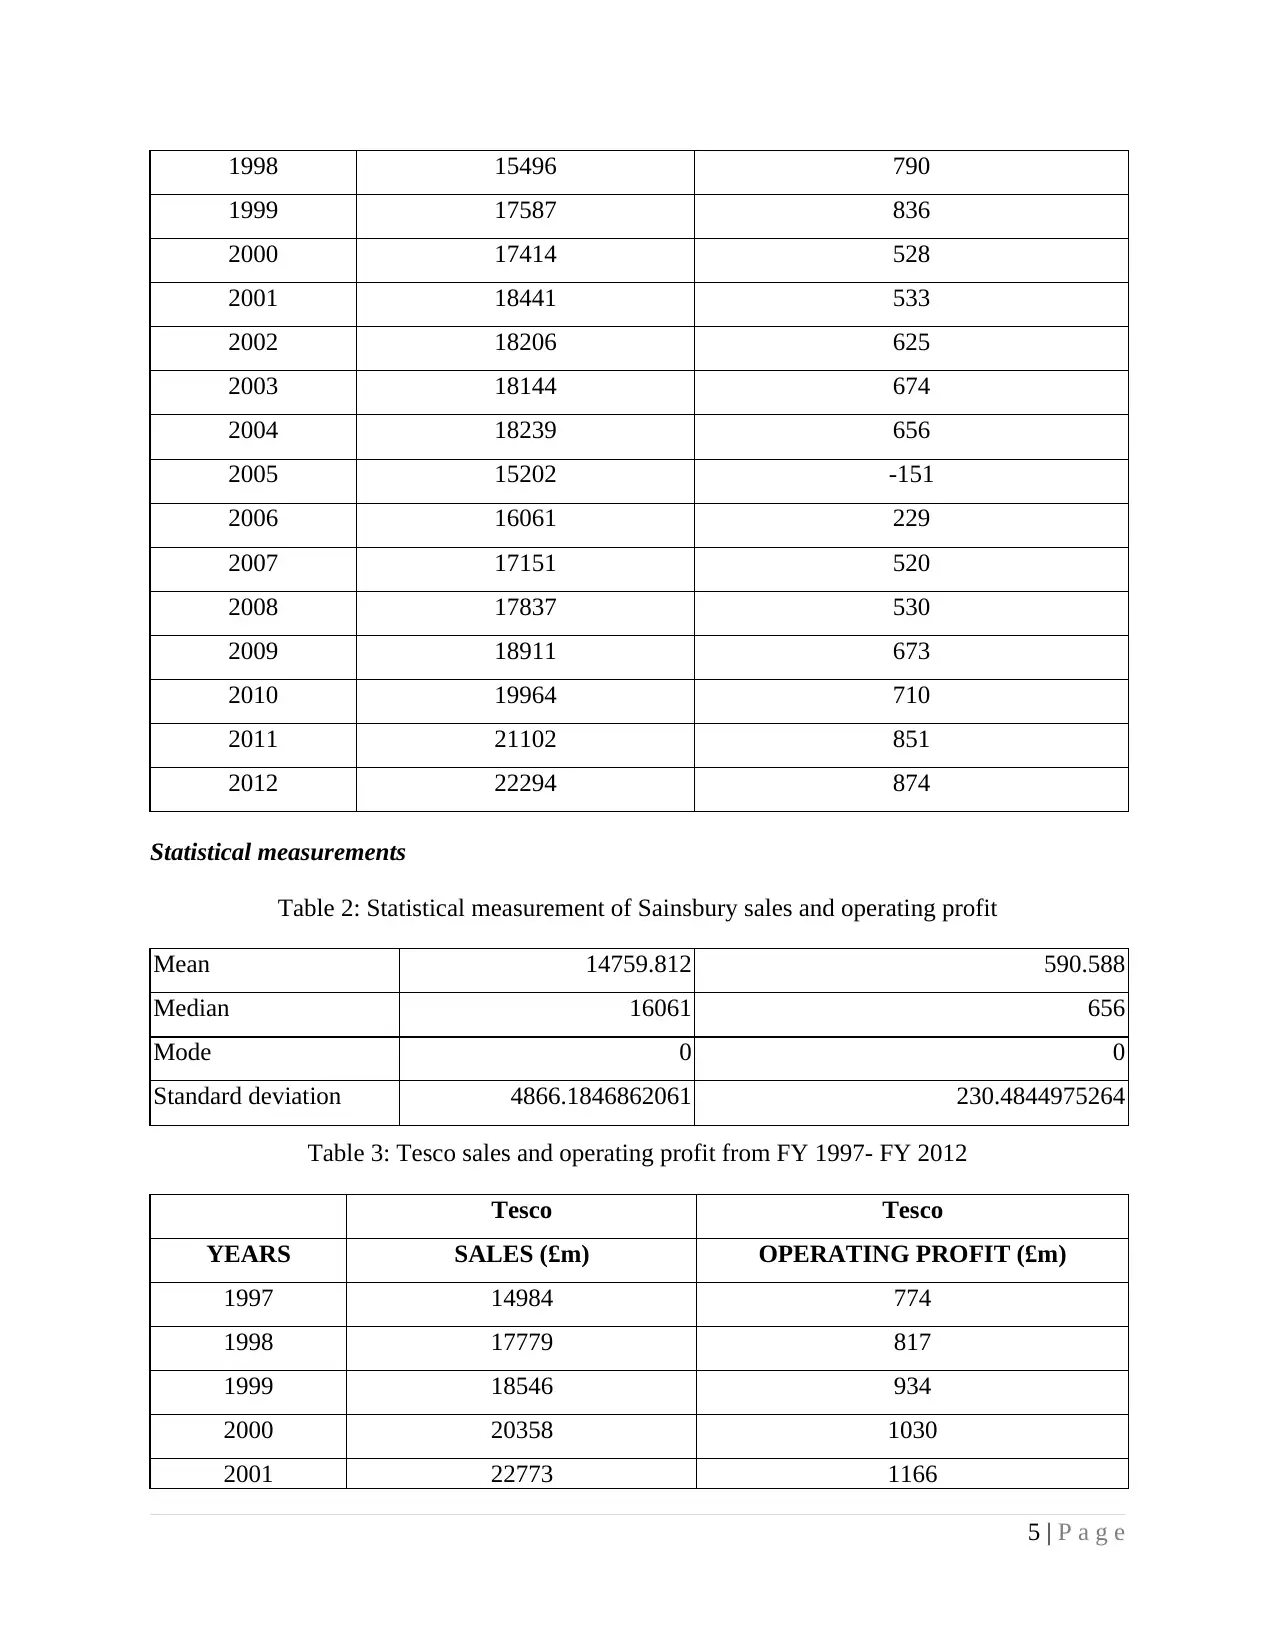
1998 15496 790
1999 17587 836
2000 17414 528
2001 18441 533
2002 18206 625
2003 18144 674
2004 18239 656
2005 15202 -151
2006 16061 229
2007 17151 520
2008 17837 530
2009 18911 673
2010 19964 710
2011 21102 851
2012 22294 874
Statistical measurements
Table 2: Statistical measurement of Sainsbury sales and operating profit
Mean 14759.812 590.588
Median 16061 656
Mode 0 0
Standard deviation 4866.1846862061 230.4844975264
Table 3: Tesco sales and operating profit from FY 1997- FY 2012
Tesco Tesco
YEARS SALES (£m) OPERATING PROFIT (£m)
1997 14984 774
1998 17779 817
1999 18546 934
2000 20358 1030
2001 22773 1166
5 | P a g e
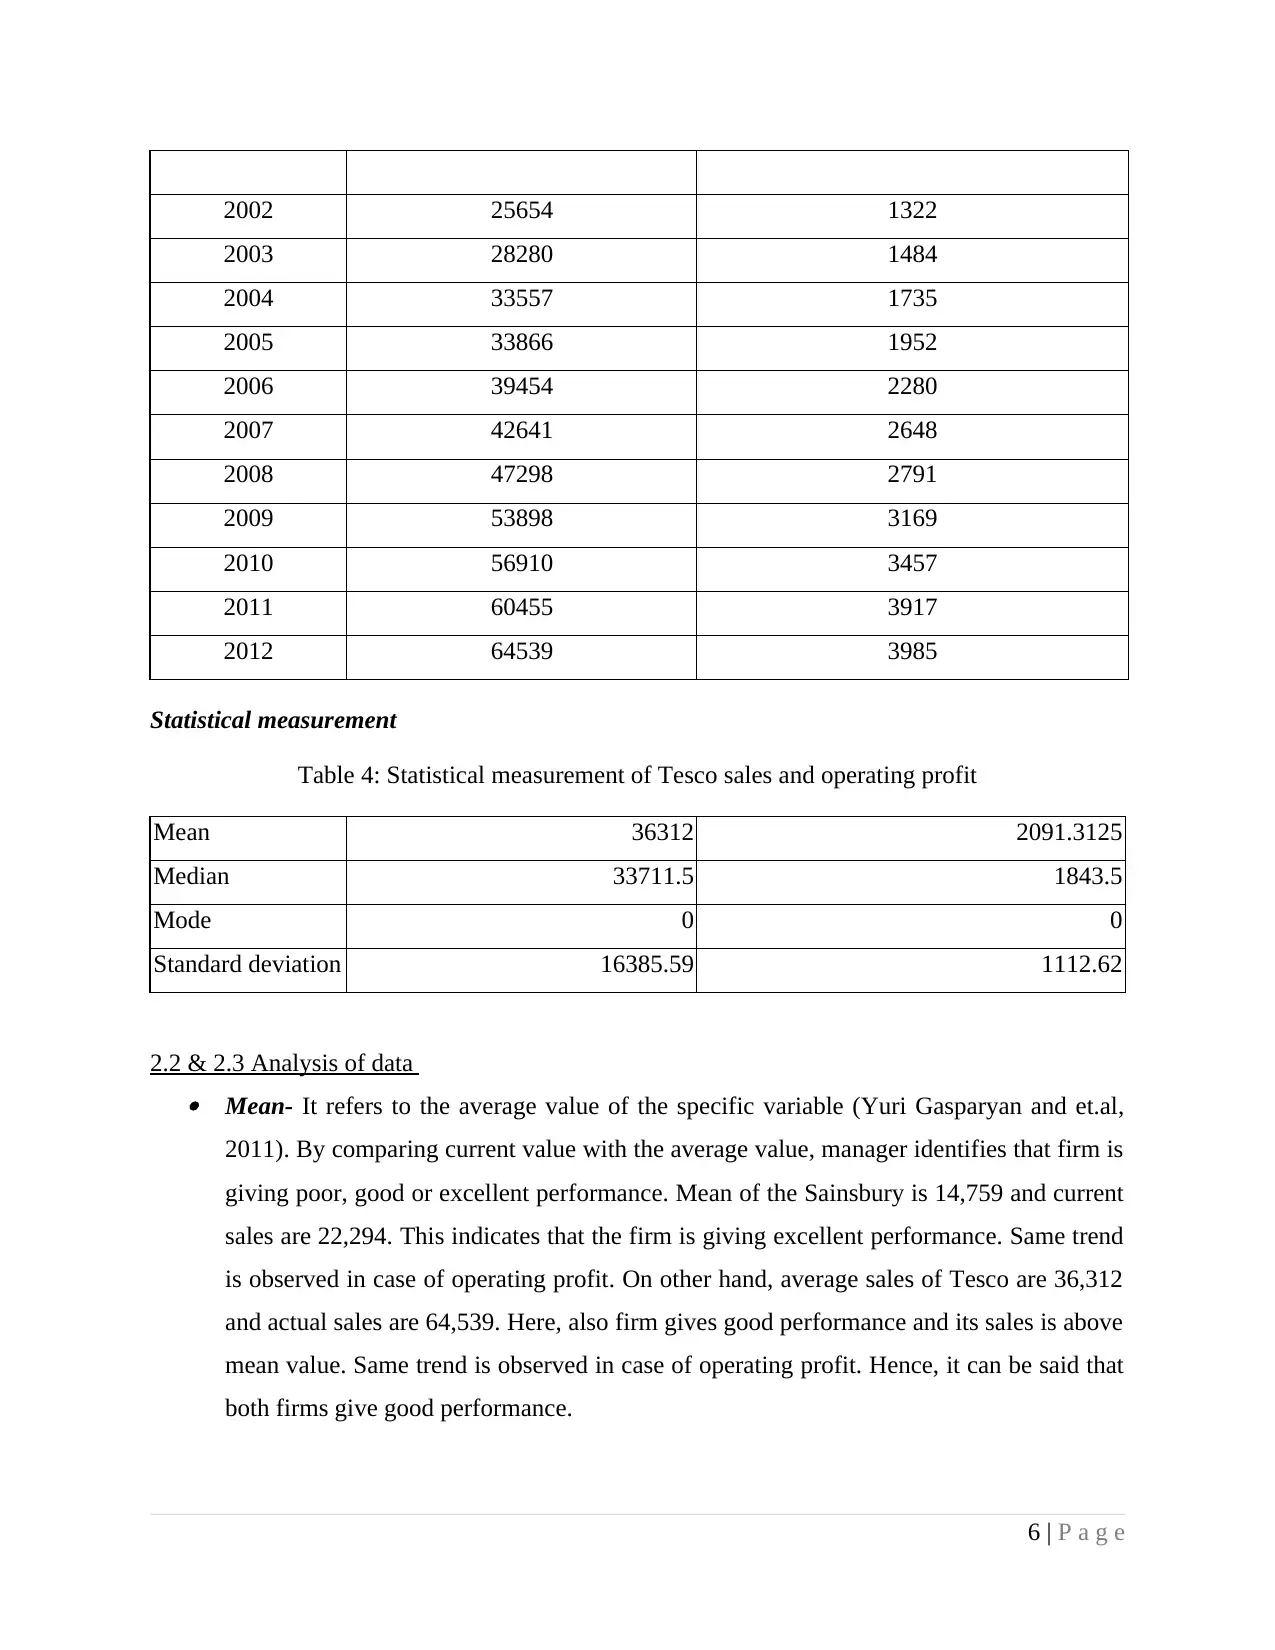
2002 25654 1322
2003 28280 1484
2004 33557 1735
2005 33866 1952
2006 39454 2280
2007 42641 2648
2008 47298 2791
2009 53898 3169
2010 56910 3457
2011 60455 3917
2012 64539 3985
Statistical measurement
Table 4: Statistical measurement of Tesco sales and operating profit
Mean 36312 2091.3125
Median 33711.5 1843.5
Mode 0 0
Standard deviation 16385.59 1112.62
2.2 & 2.3 Analysis of data Mean- It refers to the average value of the specific variable (Yuri Gasparyan and et.al,
2011). By comparing current value with the average value, manager identifies that firm is
giving poor, good or excellent performance. Mean of the Sainsbury is 14,759 and current
sales are 22,294. This indicates that the firm is giving excellent performance. Same trend
is observed in case of operating profit. On other hand, average sales of Tesco are 36,312
and actual sales are 64,539. Here, also firm gives good performance and its sales is above
mean value. Same trend is observed in case of operating profit. Hence, it can be said that
both firms give good performance.
6 | P a g e
⊘ This is a preview!⊘
Do you want full access?
Subscribe today to unlock all pages.
Trusted by 1+ million students worldwide
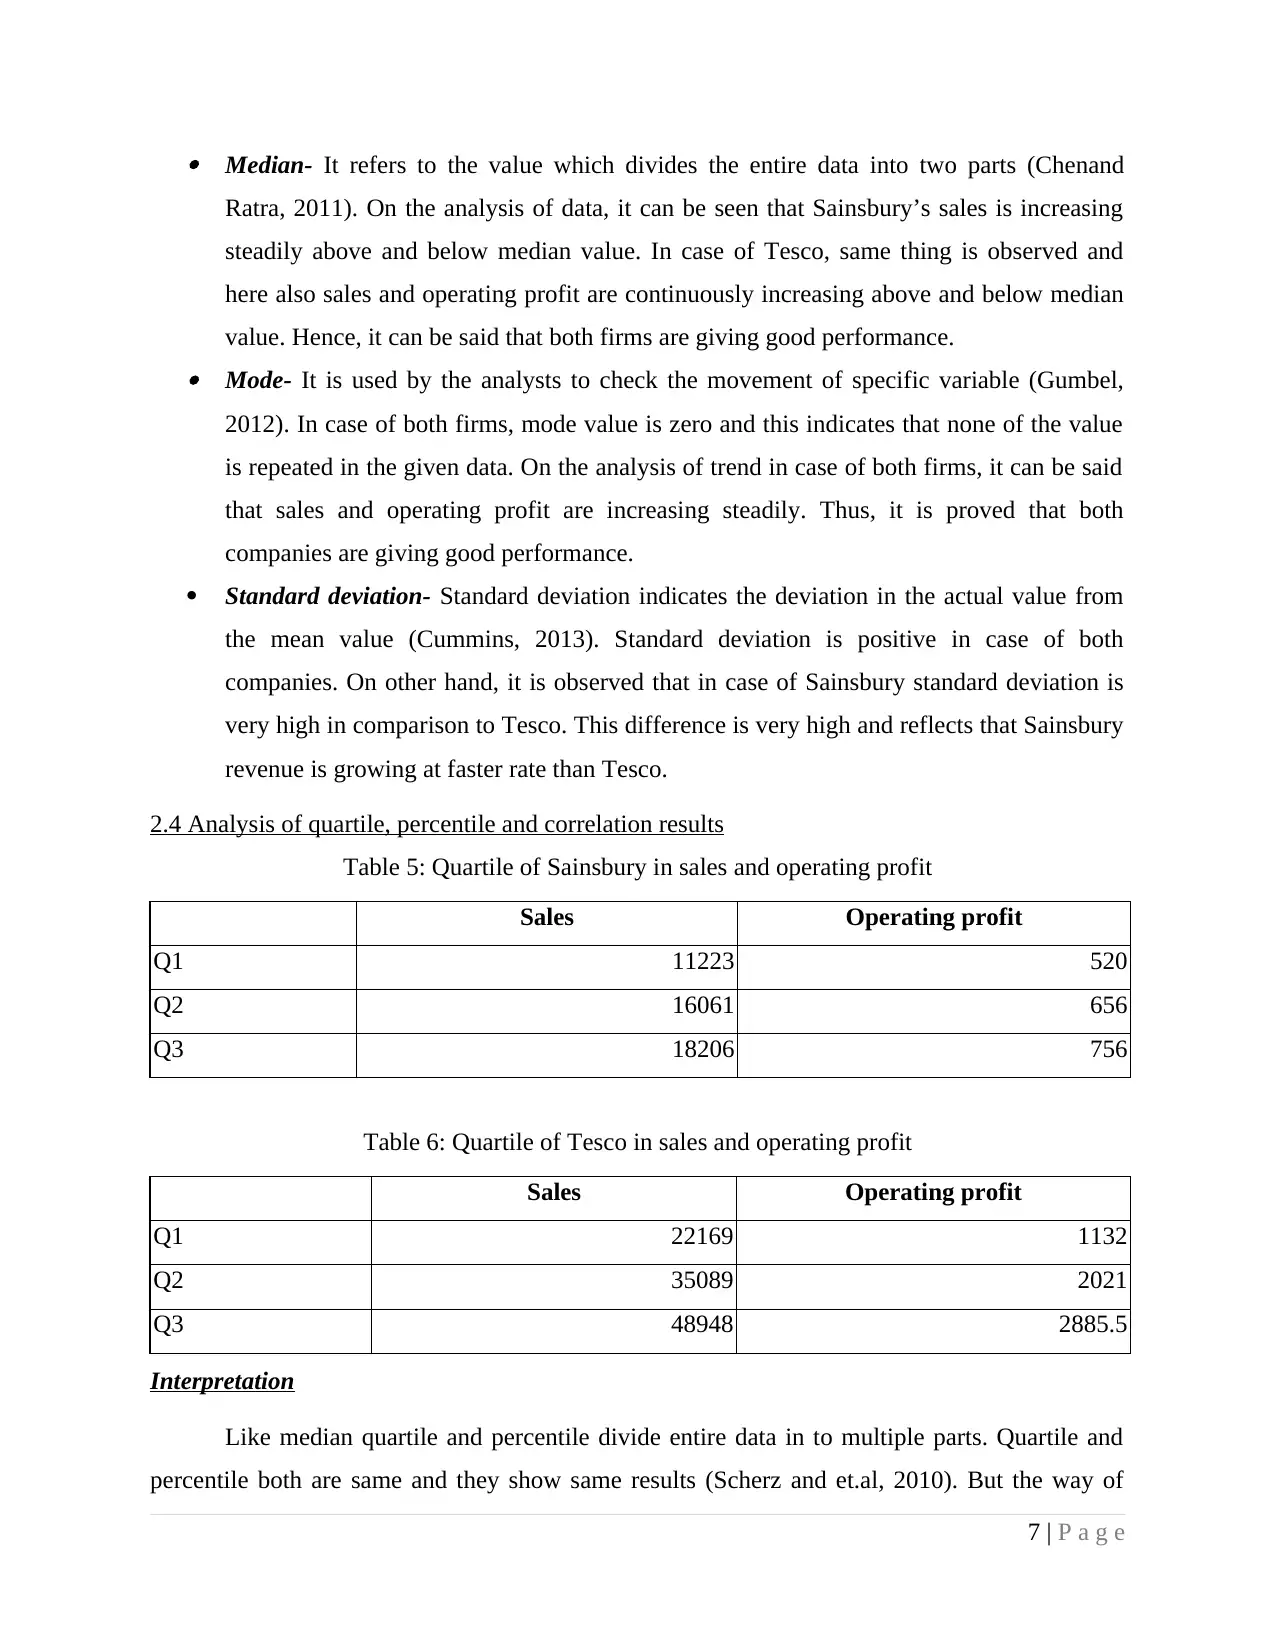
Median- It refers to the value which divides the entire data into two parts (Chenand
Ratra, 2011). On the analysis of data, it can be seen that Sainsbury’s sales is increasing
steadily above and below median value. In case of Tesco, same thing is observed and
here also sales and operating profit are continuously increasing above and below median
value. Hence, it can be said that both firms are giving good performance. Mode- It is used by the analysts to check the movement of specific variable (Gumbel,
2012). In case of both firms, mode value is zero and this indicates that none of the value
is repeated in the given data. On the analysis of trend in case of both firms, it can be said
that sales and operating profit are increasing steadily. Thus, it is proved that both
companies are giving good performance.
Standard deviation- Standard deviation indicates the deviation in the actual value from
the mean value (Cummins, 2013). Standard deviation is positive in case of both
companies. On other hand, it is observed that in case of Sainsbury standard deviation is
very high in comparison to Tesco. This difference is very high and reflects that Sainsbury
revenue is growing at faster rate than Tesco.
2.4 Analysis of quartile, percentile and correlation results
Table 5: Quartile of Sainsbury in sales and operating profit
Sales Operating profit
Q1 11223 520
Q2 16061 656
Q3 18206 756
Table 6: Quartile of Tesco in sales and operating profit
Sales Operating profit
Q1 22169 1132
Q2 35089 2021
Q3 48948 2885.5
Interpretation
Like median quartile and percentile divide entire data in to multiple parts. Quartile and
percentile both are same and they show same results (Scherz and et.al, 2010). But the way of
7 | P a g e
Paraphrase This Document
Need a fresh take? Get an instant paraphrase of this document with our AI Paraphraser
calculation is different in both cases. In case of Sainsbury it can be seen that sales is increasing
steadily. This is concluded by observing sales of all quarters. Sales and operating profit are
interrelated to each other and due to this reason same trend it observed in case of operating
profit. In case of Tesco also sales are increasing continuously and this is indicated by the
consistent elevation on the all quartile values. Same trend is seen in case of operating profit.
Hence, it can be said that both companies are performing better.
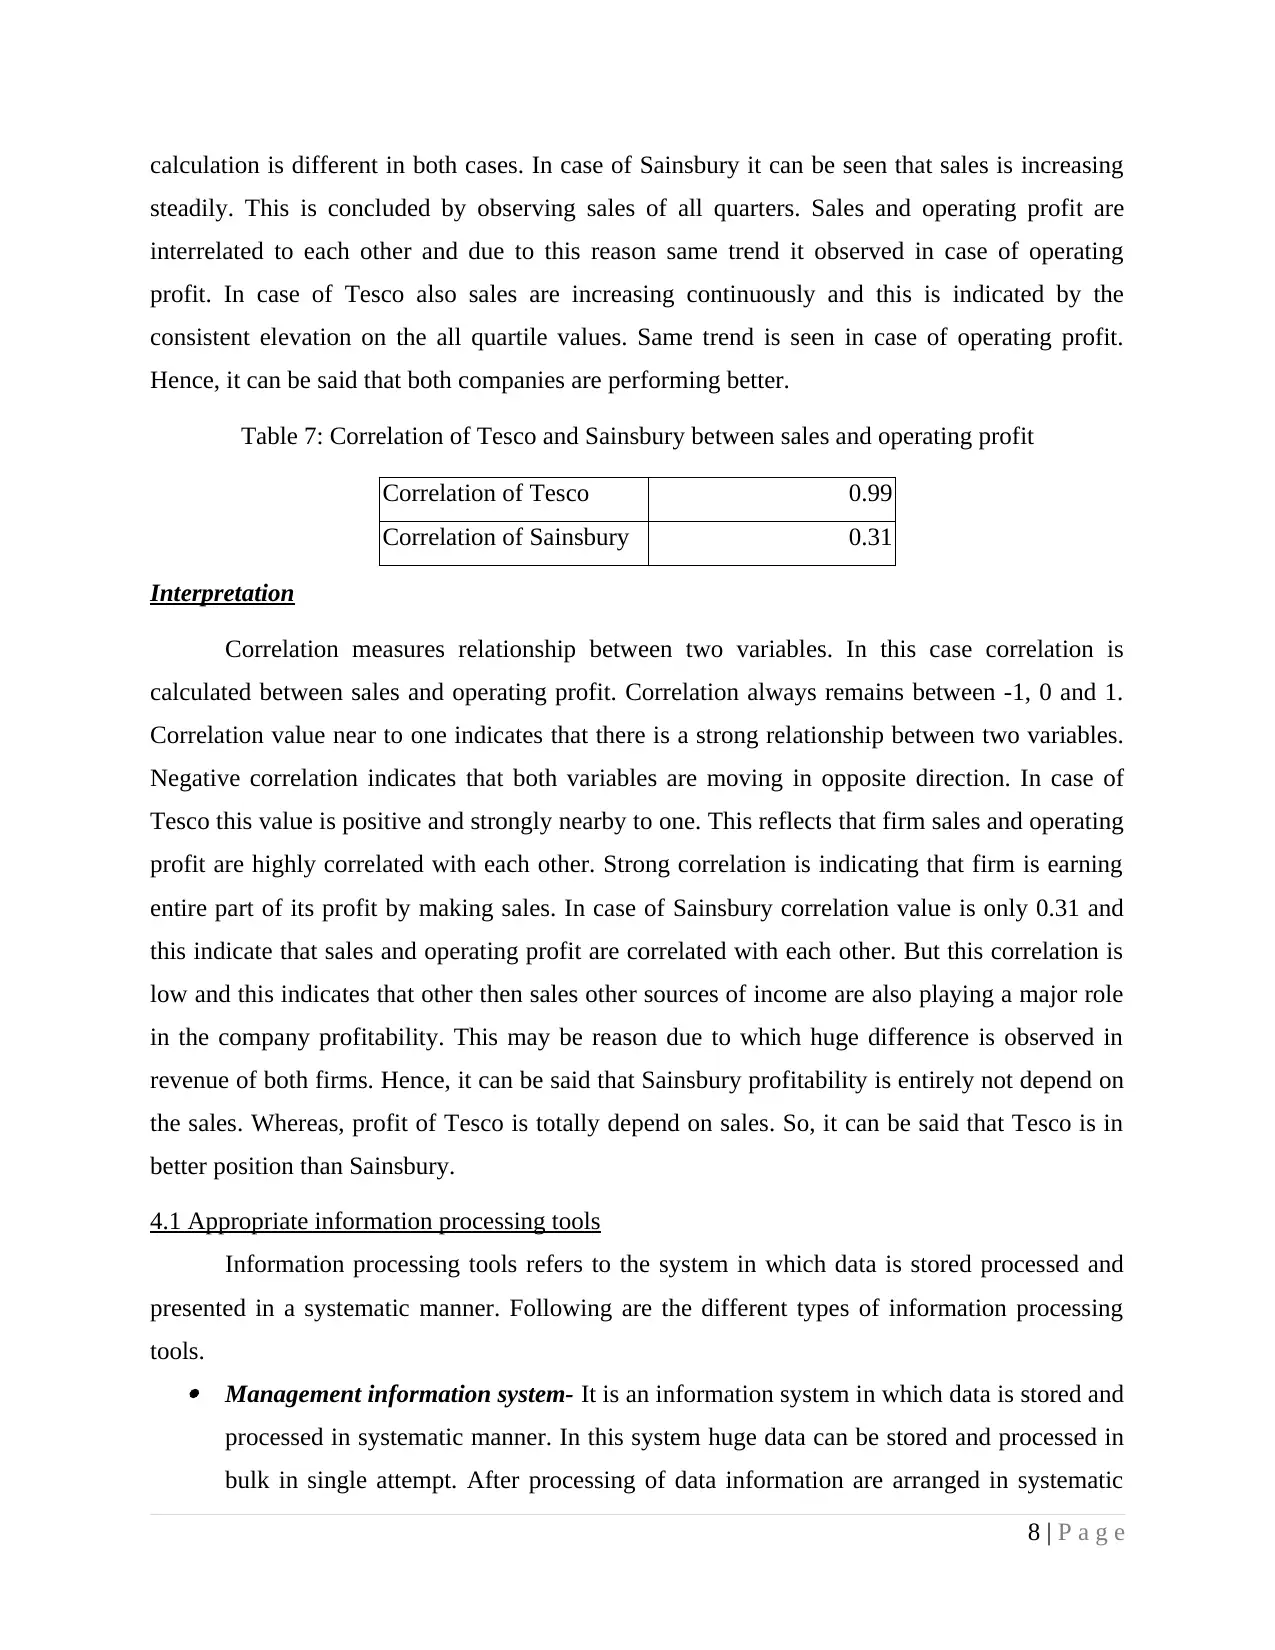
Table 7: Correlation of Tesco and Sainsbury between sales and operating profit
Correlation of Tesco 0.99
Correlation of Sainsbury 0.31
Interpretation
Correlation measures relationship between two variables. In this case correlation is
calculated between sales and operating profit. Correlation always remains between -1, 0 and 1.
Correlation value near to one indicates that there is a strong relationship between two variables.
Negative correlation indicates that both variables are moving in opposite direction. In case of
Tesco this value is positive and strongly nearby to one. This reflects that firm sales and operating
profit are highly correlated with each other. Strong correlation is indicating that firm is earning
entire part of its profit by making sales. In case of Sainsbury correlation value is only 0.31 and
this indicate that sales and operating profit are correlated with each other. But this correlation is
low and this indicates that other then sales other sources of income are also playing a major role
in the company profitability. This may be reason due to which huge difference is observed in
revenue of both firms. Hence, it can be said that Sainsbury profitability is entirely not depend on
the sales. Whereas, profit of Tesco is totally depend on sales. So, it can be said that Tesco is in
better position than Sainsbury.
4.1 Appropriate information processing tools
Information processing tools refers to the system in which data is stored processed and
presented in a systematic manner. Following are the different types of information processing
tools. Management information system- It is an information system in which data is stored and
processed in systematic manner. In this system huge data can be stored and processed in
bulk in single attempt. After processing of data information are arranged in systematic
8 | P a g e
steadily. This is concluded by observing sales of all quarters. Sales and operating profit are
interrelated to each other and due to this reason same trend it observed in case of operating
profit. In case of Tesco also sales are increasing continuously and this is indicated by the
consistent elevation on the all quartile values. Same trend is seen in case of operating profit.
Hence, it can be said that both companies are performing better.
Table 7: Correlation of Tesco and Sainsbury between sales and operating profit
Correlation of Tesco 0.99
Correlation of Sainsbury 0.31
Interpretation
Correlation measures relationship between two variables. In this case correlation is
calculated between sales and operating profit. Correlation always remains between -1, 0 and 1.
Correlation value near to one indicates that there is a strong relationship between two variables.
Negative correlation indicates that both variables are moving in opposite direction. In case of
Tesco this value is positive and strongly nearby to one. This reflects that firm sales and operating
profit are highly correlated with each other. Strong correlation is indicating that firm is earning
entire part of its profit by making sales. In case of Sainsbury correlation value is only 0.31 and
this indicate that sales and operating profit are correlated with each other. But this correlation is
low and this indicates that other then sales other sources of income are also playing a major role
in the company profitability. This may be reason due to which huge difference is observed in
revenue of both firms. Hence, it can be said that Sainsbury profitability is entirely not depend on
the sales. Whereas, profit of Tesco is totally depend on sales. So, it can be said that Tesco is in
better position than Sainsbury.
4.1 Appropriate information processing tools
Information processing tools refers to the system in which data is stored processed and
presented in a systematic manner. Following are the different types of information processing
tools. Management information system- It is an information system in which data is stored and
processed in systematic manner. In this system huge data can be stored and processed in
bulk in single attempt. After processing of data information are arranged in systematic
8 | P a g e
manner that help manager in taking sound business decision in short time period.
Normally, this information system is used at the middle level of the management for
taking day to day business decision. Due to good features this information system is
widely used by the managers in their business practice. Decision support system- This is an information system that have unique use. Currently,
business environment is unpredictable and it is very difficult to make day to day business
decisions. In such a complex situation it is very difficult to analyze each and every aspect
of complicated scenario. In this information system facility of simulation is available
under which prediction about the situation can be made by making some assumptions.
Hence, this information system provides information about the results of change in
business environment on the basis of some assumptions.
Transaction processing system- It is an information system in which all details related to
transactions is made available in the system. This information system provides
information about the all transactions that are made by the firm in past months. This
information system process entire data and provide information to the manager in
systematic way. Hence, mentioned information system is used at the lower level of the
management.
TASK 3
3.1 Graph of Sainsbury and Tesco sales and operating profit and primary data
9 | P a g e
⊘ This is a preview!⊘
Do you want full access?
Subscribe today to unlock all pages.
Trusted by 1+ million students worldwide
1 out of 28
Related Documents


Your All-in-One AI-Powered Toolkit for Academic Success.
+13062052269
info@desklib.com
Available 24*7 on WhatsApp / Email
![[object Object]](/_next/static/media/star-bottom.7253800d.svg)
Unlock your academic potential
Copyright © 2020–2026 A2Z Services. All Rights Reserved. Developed and managed by ZUCOL.