Report on Business Decision Making and Expansion for DG Fashions
VerifiedAdded on 2020/07/23
|31
|4716
|118
Report
AI Summary
This report analyzes DG Fashions' business expansion plan, focusing on opening a new outlet in Wembley Central. It covers data collection methods, including primary (interviews, questionnaires) and secondary data sources. The report includes a formal report for the manager, questionnaire design, and analysis of customer perceptions. It uses various research methodologies like descriptive and qualitative methods. Furthermore, it delves into data analysis using representative values (mean, median, mode), measures of dispersion, and charts/graphs. Investment appraisal techniques such as NPV, ARR, and payback period are also included. The report provides recommendations for the company's expansion and strategic decision-making. It also includes a Gantt chart and critical path analysis to aid in project management.

Business Decision Making
Paraphrase This Document
Need a fresh take? Get an instant paraphrase of this document with our AI Paraphraser
Table of Contents
INTRODUCTION...........................................................................................................................1
TASK 1............................................................................................................................................1
3.4: Formal report...................................................................................................................1
1.1: Sources of data collection................................................................................................2
1.2: Research methodologies and sampling framework.........................................................3
1.3: Questionnaire designing..................................................................................................4
TASK 2............................................................................................................................................6
2.1: Designing data with the help of representative values....................................................6
2.2: Evaluation of data those are collected from research......................................................7
2.3: Analysing measure of dispersion....................................................................................8
2.4: Advantages of using quartile, percentile and coefficient correlation..............................9
TASK 3............................................................................................................................................9
3.1: Different charts and graphs.............................................................................................9
3.2: Trend line......................................................................................................................13
3.3 Covered in PPT...............................................................................................................15
TASK 4..........................................................................................................................................22
4.1: Preparation of Gantt chart.............................................................................................22
4.2 Critical path....................................................................................................................23
4.3 Calculation of NPV, ARR and Pay Back Period............................................................24
CONCLUSION..............................................................................................................................26
REFERENCES..............................................................................................................................27

⊘ This is a preview!⊘
Do you want full access?
Subscribe today to unlock all pages.
Trusted by 1+ million students worldwide
INTRODUCTION
Business decision making process plays a crucial role for every single organisation. It can
be helpful for firms in managing the resources or it can help in expansion as well in targeted
areas. Proper execution of determinations which has been made by senior authorities may ad
organisation in hitting its targets (Rothman, 2017). In present report, DG Fashions which is a
clothing retail company has been taken which is looking forward to expand its business. CEO of
this retail corporation has decided to spread the business throughout the nation. Wembley Central
which is located in London is being considered as an ideal place where company can open its
outlet. Report will show sources of data collection, advantages of using quartile, percentile and
coefficient correlation, it will also include various charts, graphs along with investment appraisal
tools that will help organisation in business expansion.
TASK 1
3.4: Formal report
REPORT
To,
The Manager of clothing retail company
Date: July 31st, 2018
Subject: “To determine the behaviour of customer related to opening an outlet of DG
Fashions at Wembley Central”.
Introduction:
In this investigation, researcher have carried out the information which is related to
perceptions of customers through which they can easily help in company in making effective
decisions. Primary along with secondary data are two methods that can be used by company in
order to bring out the data.
Methodologies:
Researcher in present context have used various methods in order to draw more reliable
outcomes that can help DG Fashions in opening an outlet at Wembley Central. Methods like
descriptive and qualitative methods are going to be used under this investigation by the
investigator.
1
Paraphrase This Document
Need a fresh take? Get an instant paraphrase of this document with our AI Paraphraser
Findings:
With the help of using appropriate methods, it is required for researcher to select
respondents where 50 have been chosen with the help of random sampling method. It is found
that high in numbers respondents were pretty much happy because of the outlet is going to get
open near their houses or offices and because of trendy clothes that are being offered y this
organisation. It has also been found that, outlet has offered fresh drinks as well that are being
consumed by its customers which can be considered an an attractive factor.
Recommendation:
It is being recommended that, using of new and updated technology through which
company can promote its cloths. On the other hand, DG Fashions needs to focus on both quality
and current trends if they wants to sustain at marketplace for a longer period of time. On the
other hand, making favourable policies for employees so that high turnover of employees can be
reduced to zero. Organisation also needs to focus on some special offerings that can be offered
by them so that to grab attention of customers high in numbers.
Conclusion:
It is being concluded that, making effective decisions related to quality and trends can be
helpful for organisation through which they can easily expand their business in a successful
manner. Successful completion of investigation can help out company in opening up a whole
new outlet at Wembley Central with taking help of customers and through analysing the
competition as well.
1.1: Sources of data collection
Data collection can be considered as an approach which aid in collecting information
which can be analysed in order to take appropriate decisions. Mainly, in business world company
uses two type of methods under data collection and these are: Primary and Secondary data. In
present context, CEO of DG Fashions has decided to expand its business at Wembley Central
and have found out a suitable and ideal empty outlet. Organisation have chosen this place
because it is and about 10 minutes away from Wembley Central Tube which is a walking
distance (Pourshahid, Richards and Amyot, 2011). This will grab attention of customers high in
numbers. In order to accomplish this objective, company have decided to create a data collection
plan where they will use different types of methods and these are given below:
2
Primary data: Collecting information directly from the customers like face to face
(interview, questionnaire, survey) or through telephonic conversation can be known as primary
data. With the help of this, DG Fashions can easily gather authentic information. On the other
hand, this type of data can be considered as more reliable for making crucial decision-making.
This type of data can be collected through many tools and these are given beneath:
Research: An investigation can be known as one to one communication that is being
done with respondents in order to collect relevant data. After when collection comes to an end.
Researcher of DG Fashions can analyse it in order to make determinations.
Questionnaire: This can be known as a method which includes multiple choice questions
related to set objective of DG Fashions which is business expansion at Wembley Central. With
the help of this, seniors of this organisation can make effective decisions that will help company
in expansion (Sethi and Zhang, 2012).
Public opinion polls: Under this type of method, where a poll is being taken with the
help of sampling data from cross sections of public. Method can be stated as a survey that helps
in gaining maximum answers from customers or the respondents that has been chosen by DG
Fashions. Most high numbered questions can be helpful in hitting companies targets.
Secondary data: This sort of data can be known as the information which has already
been collected by philosophers, scholars, authors and so on. Some of resources under this are
articles, magazine, newspaper, past numerical data and other abstracts. This data can be used by
DG Fashions where company can analyse situation from past to current.
1.2: Research methodologies and sampling framework
When it comes to make effective determinations company can use various
methodologies. With the help of this, DG Fashions can easily look into different aspects like
problems and issues and can resolve them in a systematic manner (Sinha and Labi, 2011). This
can be done so that company may not get into trouble while expansion at Wembley Central.
Some of survey methods are given beneath:
Descriptive research, is being considered as a way of investigation which involves a
proper survey and organise a proper study which helps in determining all the facts that are
present under the investigation. This sort of method includes data which is already being
established and can help out DG Fashions in business expansion.
3
⊘ This is a preview!⊘
Do you want full access?
Subscribe today to unlock all pages.
Trusted by 1+ million students worldwide
Exploratory research method, one of a kind method of investigation which carries an
aim so that to explore all the survey areas and could not help out DG Fashions in gaining proper
information which may aid in opening an outlet at DG Fashions.
Quantitative and Qualitative research methods, These are the two methods that can be
used by DG Fashions through which they can collect information in both facts, figures and
related to perception of selected respondents. After collection of data company may analyse the
information that will help in business expansion at Wembley Central (Tzeng and Huang, 2011).
Sampling methods: This sort of method helps DG Fashion's seniors in selecting the
respondents depending upon the objective which has been set by the company.
Sampling framing, In order to draw positive outcomes from investigation. It is pretty
much required for investigator to select the respondents through which they can easily grab data.
It is essential to gather same samples from available group of customers. It can also be
categorised among different sections and these are briefly described beneath:
Random sampling: This is being considered as one of a sampling method which is being
utilised by organisations high in numbers. Respondents are being selected with the help of
random chosen numbers. On the other hand, there are some other selecting methods like Quota,
stratified, Cluster and others (Xu, 2015). Investigator under this have selected 50 respondents
that will help DG Fashion in collecting the data. Apart from this, some of useful aspects are also
being covered while conducing this research and these are mentioned underneath:
Price they can easy afford
Quality in service
1.3: Questionnaire designing
Research over customer experiences and its satisfaction regarding opening of new clothing
retail store of DG
Fashion.
QUESTIONNAIRE
Name:
Age:
Gender:
4
Paraphrase This Document
Need a fresh take? Get an instant paraphrase of this document with our AI Paraphraser
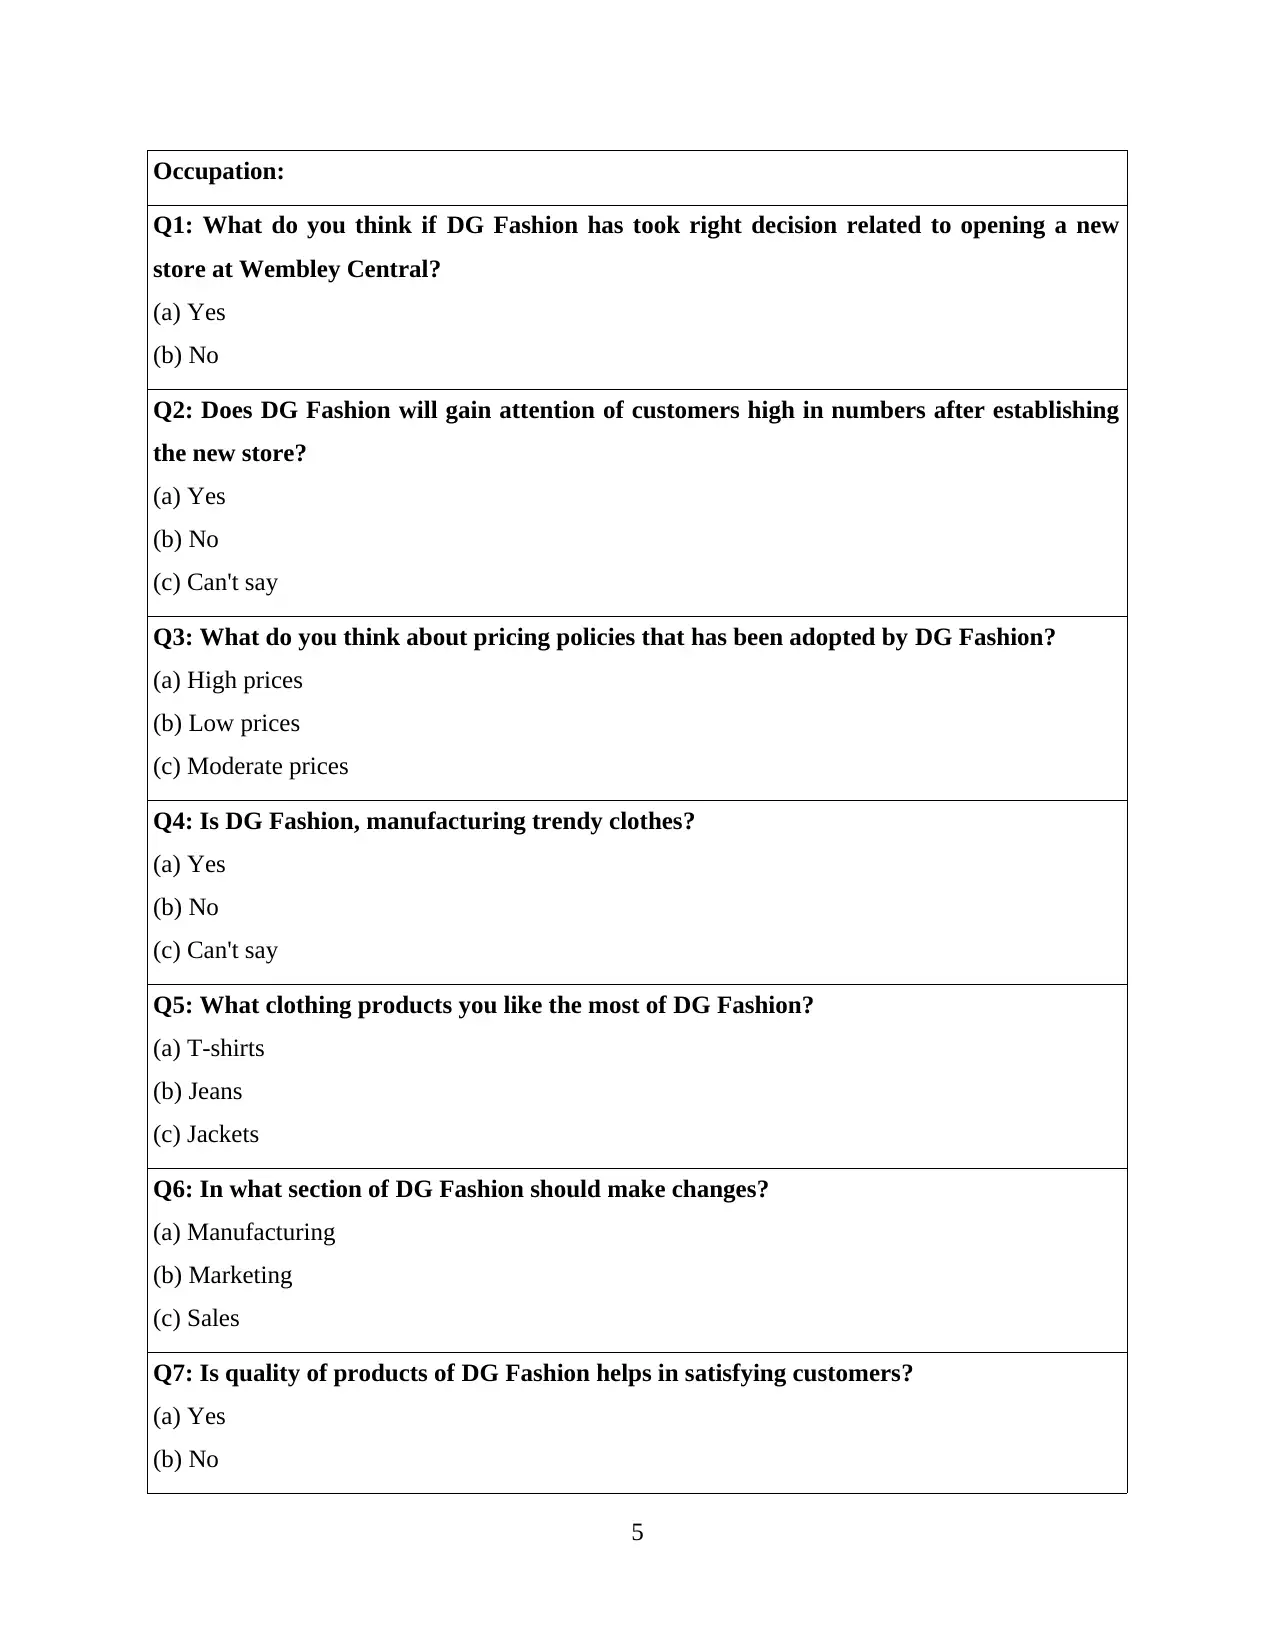
Occupation:
Q1: What do you think if DG Fashion has took right decision related to opening a new
store at Wembley Central?
(a) Yes
(b) No
Q2: Does DG Fashion will gain attention of customers high in numbers after establishing
the new store?
(a) Yes
(b) No
(c) Can't say
Q3: What do you think about pricing policies that has been adopted by DG Fashion?
(a) High prices
(b) Low prices
(c) Moderate prices
Q4: Is DG Fashion, manufacturing trendy clothes?
(a) Yes
(b) No
(c) Can't say
Q5: What clothing products you like the most of DG Fashion?
(a) T-shirts
(b) Jeans
(c) Jackets
Q6: In what section of DG Fashion should make changes?
(a) Manufacturing
(b) Marketing
(c) Sales
Q7: Is quality of products of DG Fashion helps in satisfying customers?
(a) Yes
(b) No
5
Q8: According to you, in future is DG Fashion become able of attract more customers?
(a) Yes
(b) No
Q9: What do you think of Wembley Central, London is it appropriate for DG Fashion to
open its new outlet?
(a) Agree
(d) Disagree
(c) Can't say
Q10: Any recommendations?
Ans.
TASK 2
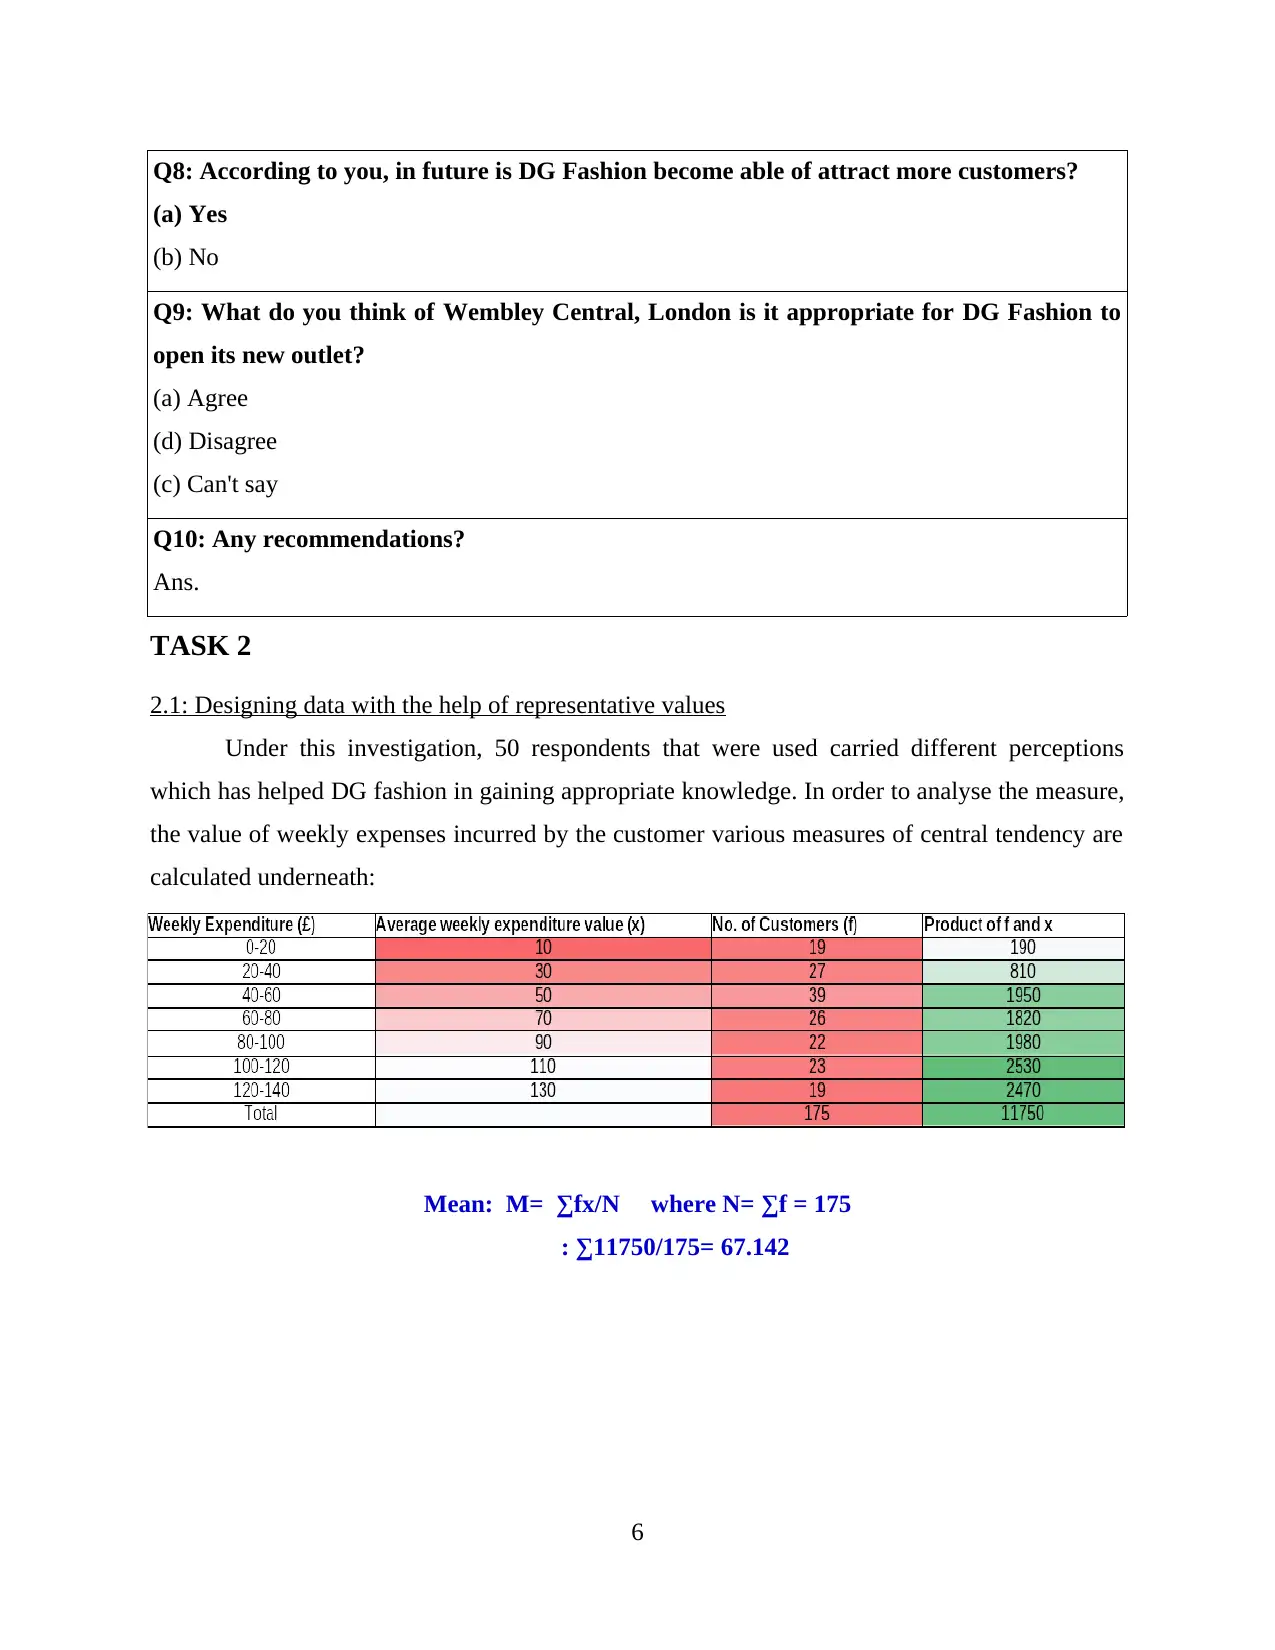
2.1: Designing data with the help of representative values
Under this investigation, 50 respondents that were used carried different perceptions
which has helped DG fashion in gaining appropriate knowledge. In order to analyse the measure,
the value of weekly expenses incurred by the customer various measures of central tendency are
calculated underneath:
Mean: M= ∑fx/N where N= ∑f = 175
: ∑11750/175= 67.142
6
(a) Yes
(b) No
Q9: What do you think of Wembley Central, London is it appropriate for DG Fashion to
open its new outlet?
(a) Agree
(d) Disagree
(c) Can't say
Q10: Any recommendations?
Ans.
TASK 2
2.1: Designing data with the help of representative values
Under this investigation, 50 respondents that were used carried different perceptions
which has helped DG fashion in gaining appropriate knowledge. In order to analyse the measure,
the value of weekly expenses incurred by the customer various measures of central tendency are
calculated underneath:
Mean: M= ∑fx/N where N= ∑f = 175
: ∑11750/175= 67.142
6
⊘ This is a preview!⊘
Do you want full access?
Subscribe today to unlock all pages.
Trusted by 1+ million students worldwide
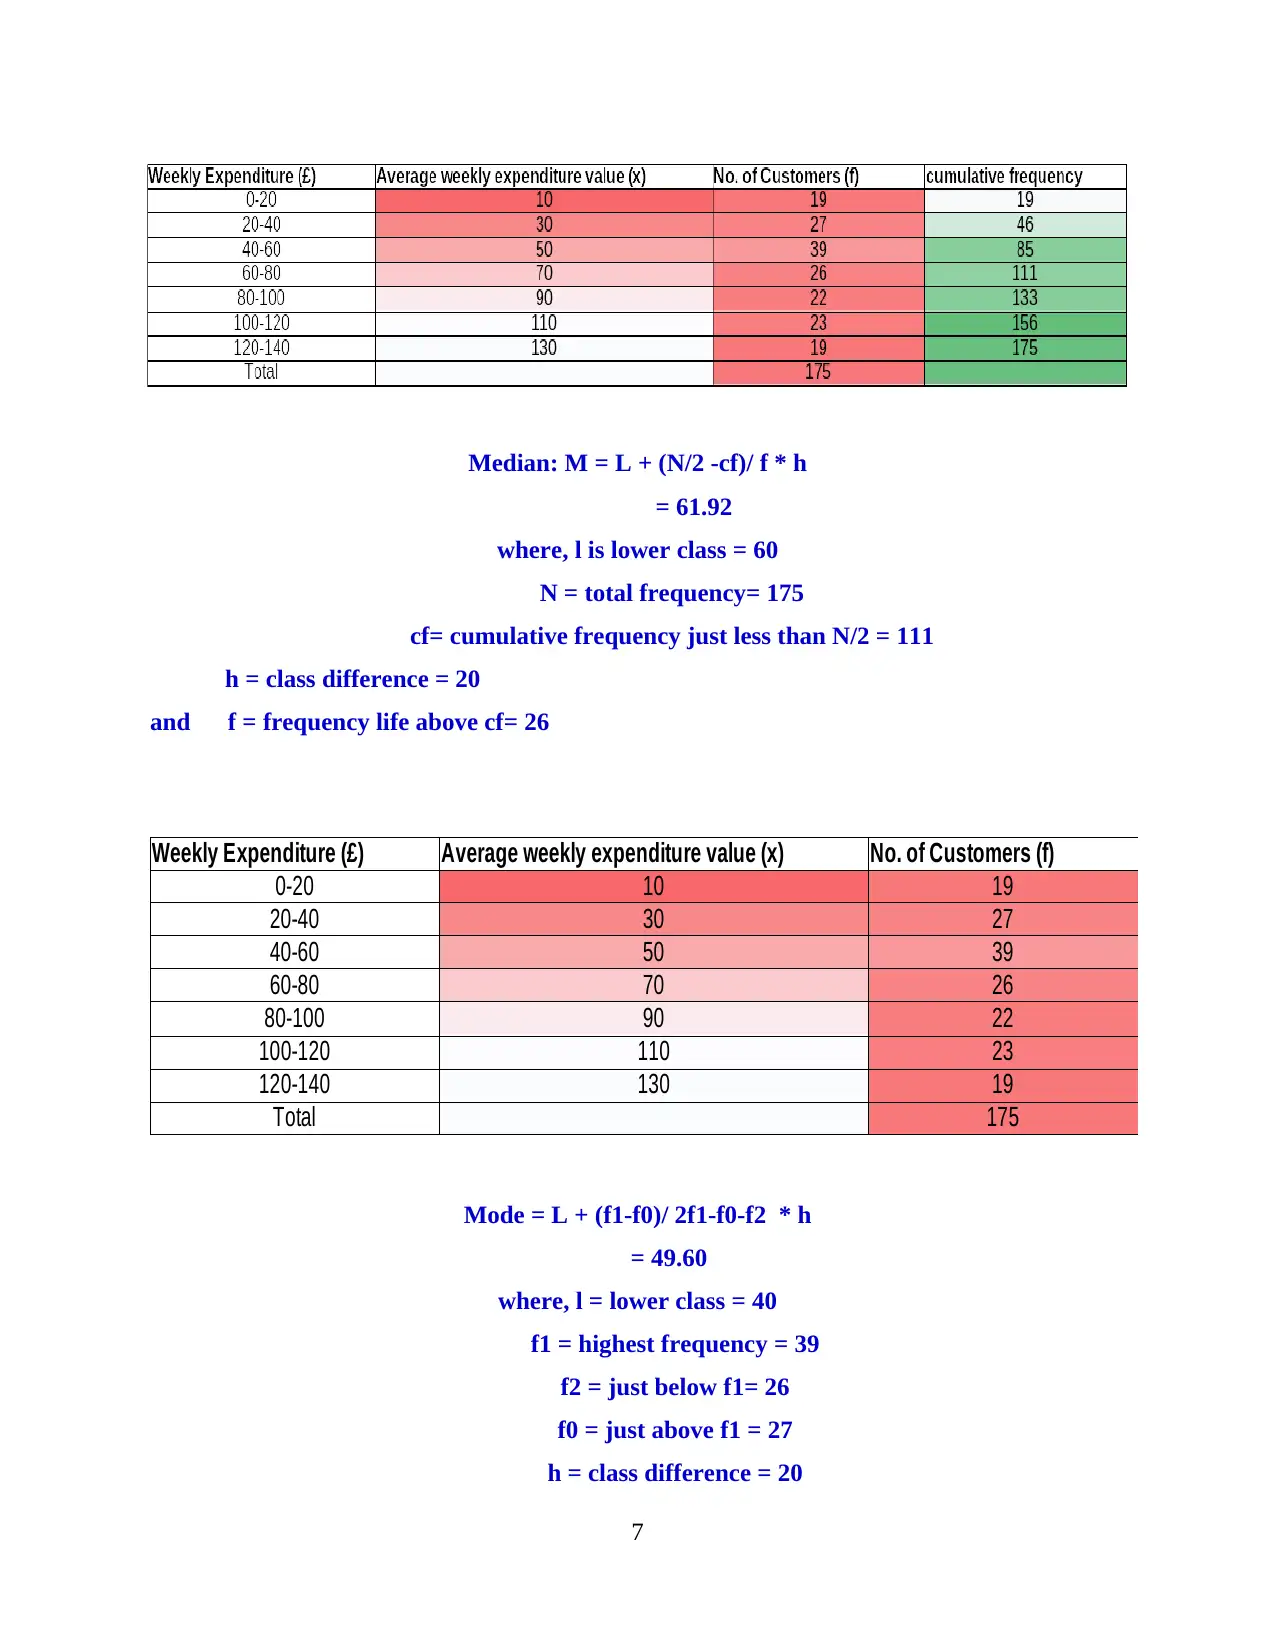
Median: M = L + (N/2 -cf)/ f * h
= 61.92
where, l is lower class = 60
N = total frequency= 175
cf= cumulative frequency just less than N/2 = 111
h = class difference = 20
and f = frequency life above cf= 26
Weekly Expenditure (£) Average weekly expenditure value (x) No. of Customers (f)
0-20 10 19
20-40 30 27
40-60 50 39
60-80 70 26
80-100 90 22
100-120 110 23
120-140 130 19
Total 175
Mode = L + (f1-f0)/ 2f1-f0-f2 * h
= 49.60
where, l = lower class = 40
f1 = highest frequency = 39
f2 = just below f1= 26
f0 = just above f1 = 27
h = class difference = 20
7
Paraphrase This Document
Need a fresh take? Get an instant paraphrase of this document with our AI Paraphraser
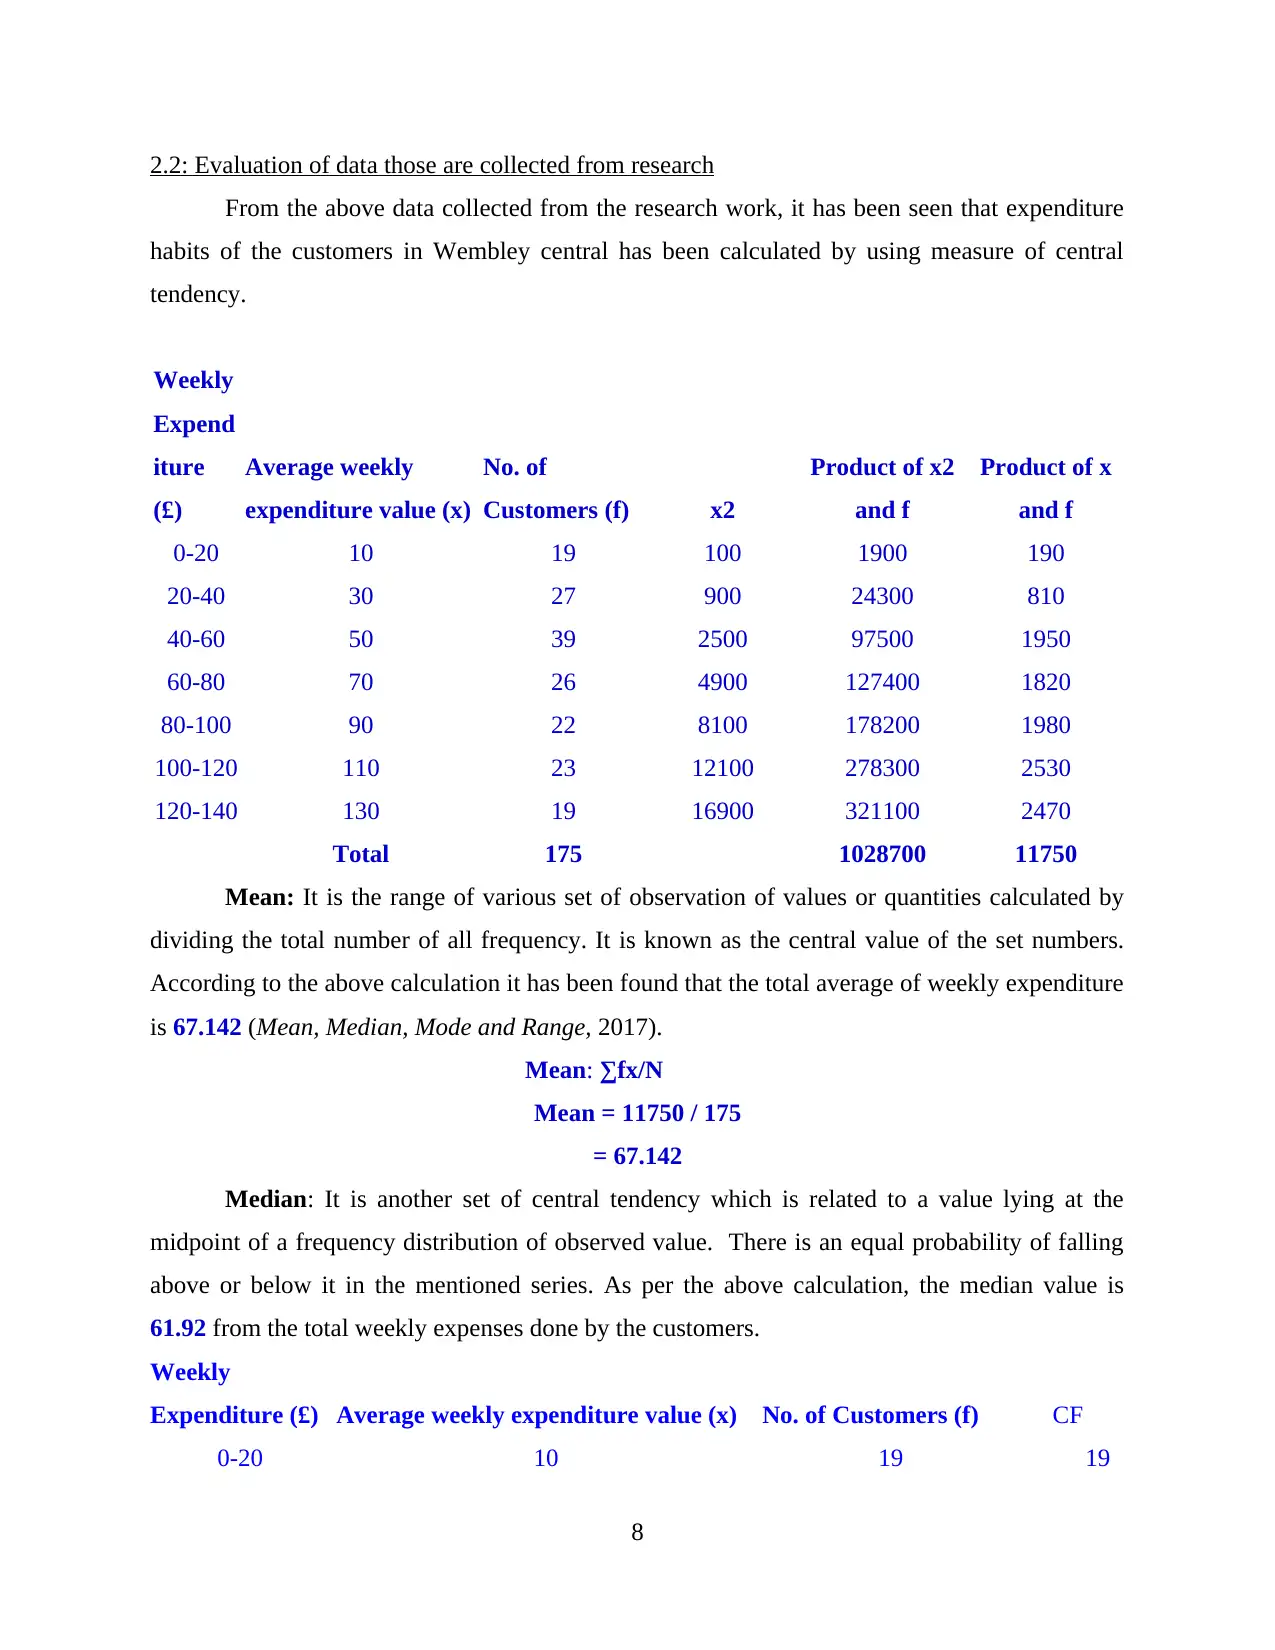
2.2: Evaluation of data those are collected from research
From the above data collected from the research work, it has been seen that expenditure
habits of the customers in Wembley central has been calculated by using measure of central
tendency.
Weekly
Expend
iture
(£)
Average weekly
expenditure value (x)
No. of
Customers (f) x2
Product of x2
and f
Product of x
and f
0-20 10 19 100 1900 190
20-40 30 27 900 24300 810
40-60 50 39 2500 97500 1950
60-80 70 26 4900 127400 1820
80-100 90 22 8100 178200 1980
100-120 110 23 12100 278300 2530
120-140 130 19 16900 321100 2470
Total 175 1028700 11750
Mean: It is the range of various set of observation of values or quantities calculated by
dividing the total number of all frequency. It is known as the central value of the set numbers.
According to the above calculation it has been found that the total average of weekly expenditure
is 67.142 (Mean, Median, Mode and Range, 2017).
Mean: ∑fx/N
Mean = 11750 / 175
= 67.142
Median: It is another set of central tendency which is related to a value lying at the
midpoint of a frequency distribution of observed value. There is an equal probability of falling
above or below it in the mentioned series. As per the above calculation, the median value is
61.92 from the total weekly expenses done by the customers.
Weekly
Expenditure (£) Average weekly expenditure value (x) No. of Customers (f) CF
0-20 10 19 19
8
20-40 30 27 46
40-60 50 39 85
60-80 70 26 111
80-100 90 22 133
100-120 110 23 156
120-140 130 19 175
Total 175
Median: L + (N/2 -cf)/ f * h
Median = 80 + (87.5-111) / 26 * 20
Median = 61.92
Mode: It refers to be the types of average of most common or frequency arising value in
a given data series. It is the value of X at which their probability mass function used to take
their maximum value. from the above calculation, the most repetitive value is 96.
Mode: L + (f1-f0)/ 2f1-f0-f2 * h
Mode = 80 + (22-26) / (2*22 -26 - 23) * 20
Mode = 96
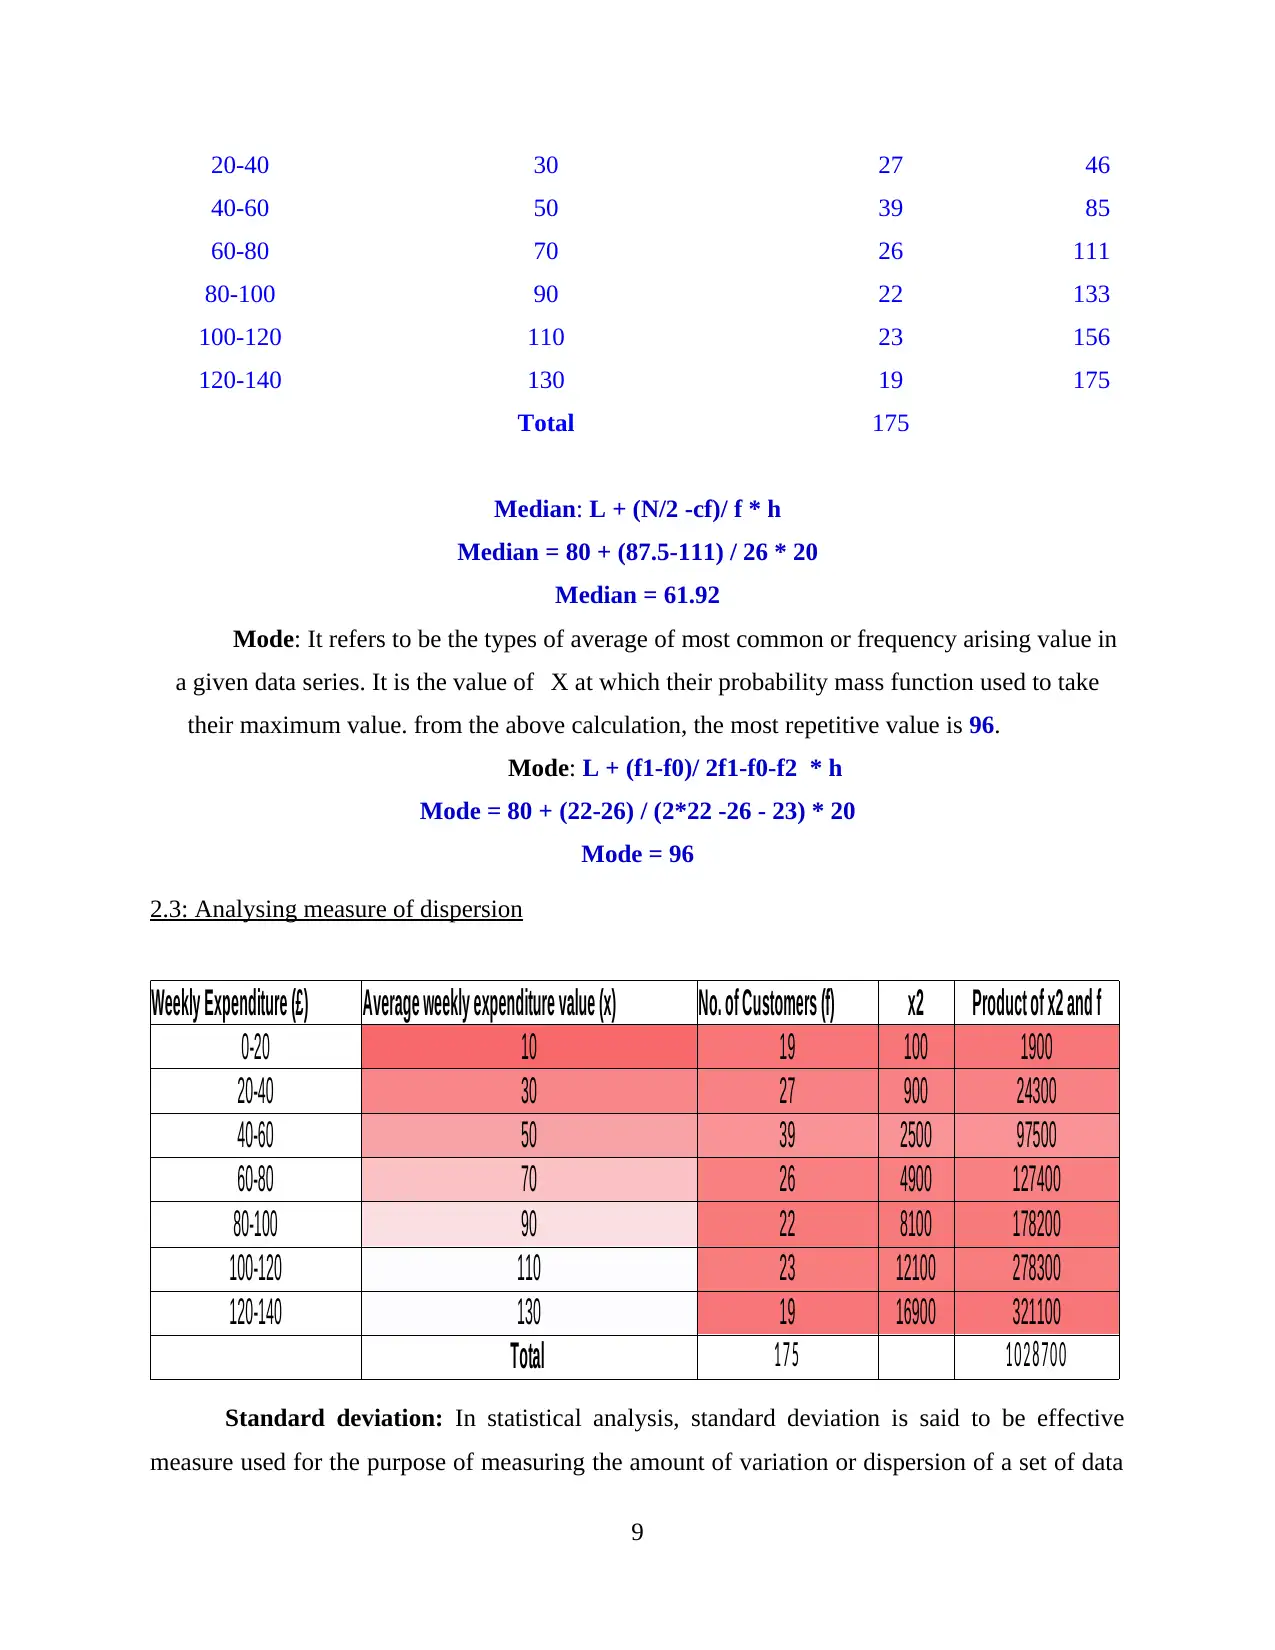
2.3: Analysing measure of dispersion
Weekly Expenditure (£) Average weekly expenditure value (x) No. of Customers (f) x2 Product of x2 and f
0-20 10 19 100 1900
20-40 30 27 900 24300
40-60 50 39 2500 97500
60-80 70 26 4900 127400
80-100 90 22 8100 178200
100-120 110 23 12100 278300
120-140 130 19 16900 321100
Total 1 7 5 1 0 2 8 7 0 0
Standard deviation: In statistical analysis, standard deviation is said to be effective
measure used for the purpose of measuring the amount of variation or dispersion of a set of data
9
40-60 50 39 85
60-80 70 26 111
80-100 90 22 133
100-120 110 23 156
120-140 130 19 175
Total 175
Median: L + (N/2 -cf)/ f * h
Median = 80 + (87.5-111) / 26 * 20
Median = 61.92
Mode: It refers to be the types of average of most common or frequency arising value in
a given data series. It is the value of X at which their probability mass function used to take
their maximum value. from the above calculation, the most repetitive value is 96.
Mode: L + (f1-f0)/ 2f1-f0-f2 * h
Mode = 80 + (22-26) / (2*22 -26 - 23) * 20
Mode = 96
2.3: Analysing measure of dispersion
Weekly Expenditure (£) Average weekly expenditure value (x) No. of Customers (f) x2 Product of x2 and f
0-20 10 19 100 1900
20-40 30 27 900 24300
40-60 50 39 2500 97500
60-80 70 26 4900 127400
80-100 90 22 8100 178200
100-120 110 23 12100 278300
120-140 130 19 16900 321100
Total 1 7 5 1 0 2 8 7 0 0
Standard deviation: In statistical analysis, standard deviation is said to be effective
measure used for the purpose of measuring the amount of variation or dispersion of a set of data
9
⊘ This is a preview!⊘
Do you want full access?
Subscribe today to unlock all pages.
Trusted by 1+ million students worldwide
1 out of 31
Related Documents


Your All-in-One AI-Powered Toolkit for Academic Success.
+13062052269
info@desklib.com
Available 24*7 on WhatsApp / Email
![[object Object]](/_next/static/media/star-bottom.7253800d.svg)
Unlock your academic potential
Copyright © 2020–2026 A2Z Services. All Rights Reserved. Developed and managed by ZUCOL.