Report on Business Decision-Making for DG Fashion Expansion
VerifiedAdded on 2020/06/05
|25
|4259
|102
Report
AI Summary
This report delves into the business decision-making process for DG Fashion's expansion into Wembley Central. It begins with a plan for data collection, utilizing both primary (surveys) and secondary data (sales records). The report then applies statistical methods, including calculations of mean, mode, median, range, standard deviation, quartiles, percentiles, and correlation coefficients, to analyze consumer behavior and financial performance. Further, it presents sales, cost, and profit data through a column graph and forecasts future sales and profit. A PowerPoint presentation summarizing key findings is also included. Finally, the report assesses the project's viability, using information processing tools and project management principles to evaluate the potential success of the new expansion project, concluding with recommendations for DG Fashion.

Business Decision-making
Paraphrase This Document
Need a fresh take? Get an instant paraphrase of this document with our AI Paraphraser
Table of Contents
INTRODUCTION...........................................................................................................................1
1.1 Plan for data collection..........................................................................................................1
1.2 Survey methodology and sampling frame.............................................................................1
1.3 Questionnaire.........................................................................................................................2
TASK 2............................................................................................................................................4
2.1 Calculation of mean, mode and median.................................................................................4
2.2 Explain the significance of the central tendency results........................................................5
2.3 Calculation of range and standard deviation..........................................................................6
2.4 Calculation of quartile, percentiles and correlation coefficient to draw useful information. 7
TASK 3............................................................................................................................................8
3.1 Column graph for sales, cost and profit data.........................................................................8
3.2 Forecasting future sales and profit of DG Fashion................................................................9
3.3 Power Point Presentation.....................................................................................................10
3.4 Formal report........................................................................................................................15
TASK 4..........................................................................................................................................16
4.1 Information processing tools................................................................................................16
4.2 Project management.............................................................................................................16
4.3 Assessing project viability of new expansion project..........................................................18
CONCLUSION..............................................................................................................................20
REFERENCES..............................................................................................................................21
INTRODUCTION
In current uncertain and competitive world, managers need to make precise and informed
business decisions for ensuring long-lasting survival. It involves number of decisions like
product development, expansion and others. The current research study focuses in the area of
decision making for a new clothing retail firm DG Fashions expansion in Wembley Central.
Although, the company had gained good popularity for its strong competitive position at
affordable rates. In this regards, both primary and secondary data will be gathered and examined
thoroughly using statistical methods of central tendency and dispersion. However, for the
financial appraisal, financial viability will be assessed through investment appraisal method to
examine the viability of the expansion project.
1.1 Plan for data collection
There are two sources from where DG Fashion can extract needed information, primary
and secondary data sources.
Primary data: This method collects data from first hand sources through the use of
observation, experiments, surveys, observation, interview, schedule and others. Thus, such
sources are not subjected to any kind of processing and manipulation (Solomon 2014). In order
to assess people’s perception, demand and preferences for expanding DG Fashion in Wembley
Central, target respondents, consumers will be surveyed through questionnaire. The key benefit
of the method is it produce reliable information, sin contrast, it is time-saving and costlier way of
data collection
Secondary data: Data that is gathered by someone else other than the original user is
known as secondary data includes books, magazines, trade journals, online publications,
company’s own records, industry reports and statistical documents. However, on the other side,
secondary dataset will be gathered through DG Fashion’s past 10 years sales, cost and profit
records. It will help to examine company’s performance and to make informed decisions. It is an
economical and time-saving method of gathering needed data set.
1.2 Survey methodology and sampling frame
Survey methodology: It is a primary data collection method wherein an original survey of
the actual respondents is carried out who are supposed to have desired set of information. It is
1 | P a g e
⊘ This is a preview!⊘
Do you want full access?
Subscribe today to unlock all pages.
Trusted by 1+ million students worldwide
considered as highly effective information that produces relevant information regarding socio-
economic characteristics, product features, consumer opinion, motives, and attitude and
satisfaction level as well. Questionnaire is the best way which consists of number of questions
which selected sample respondent need to respond. It is simpler, cost-effective and easy to
administer (Solomon, 2014). Thus, for DG Fashion’s expansion in Wembley central, it is
decided to survey people via questionnaire to get an idea about their like, dislike, price
sensitivity, purchasing preferences, pattern, income level and other needed information.
Sampling frame: Finding difficulties in studying the universe or population, sampling
introduced. It is a way wherein a sample comprising group of people are taken out who will be surveyed
by the company. There are two ways to choose a sample, random and non-random sampling. First method
identifies each and every unit of the population equally and similar probability, unlike this, in later, every
unit has less or more likelihood to be included in the sample selection. Here, it is decided to select sample
of 175 people using random-sampling method to avoid biasness in the sample selection.
1.3 Questionnaire
Name:
Town:
Gender: M ( ) F ( )
Age:
18 and below
19 – 25 years
26 – 32 years
Above 32 years
From Where, do you often purchase apparel?
Online shopping
Independent shops
High street brands
Doesn’t matter
How often do you purchase clothing products?
1-5 times a year
5 -10 times a year
Once in a month
2 | P a g e
Paraphrase This Document
Need a fresh take? Get an instant paraphrase of this document with our AI Paraphraser
2 – 3 times per month
4-7 times per month
More than 7 times in a month
How much do you generally spend on cloth shopping?
£0 - £20
£20- £40
£40- £60
£60 - £80
£80 - £100
£100- £120
£120 - £140
Which are the two most important factors in your clothing shopping?
Quality
Comfort
Color
Material
Brand
Price
Style
With whom, do you prefer shopping clothing items?
Friends
Family
Partner
Colleague
Alone
Can’t say
Whenever you purchase any cloth item, do you:
Always prefer visiting again the shop
Every time try different shops
Visit in a shop due to window display
Prefer locations with attractive discounts
3 | P a g e
Others
If there is a new cloth brand coming to your city, which would you expects:
Celebrity’s style design
Organic material
Premium quality
Reasonable charges
Others
TASK 2
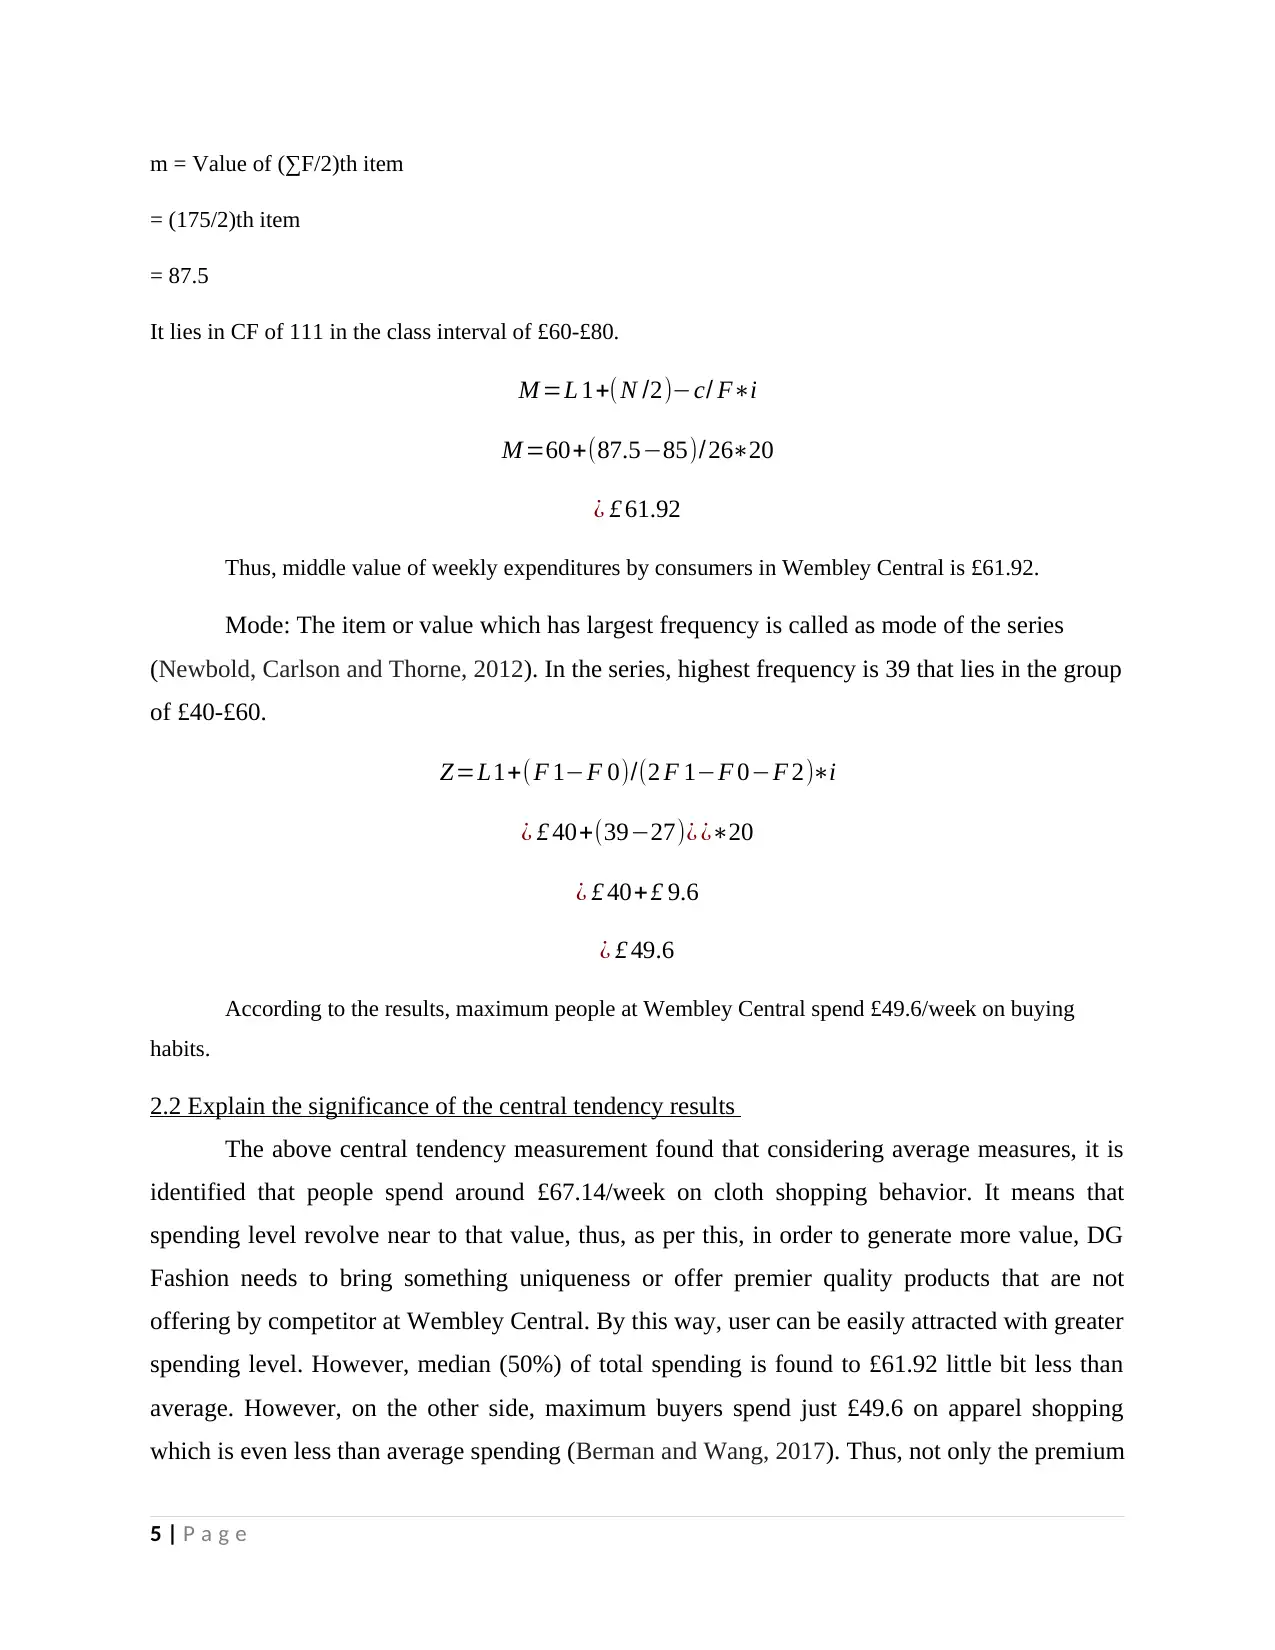
2.1 Calculation of mean, mode and median
Weekly expenditures Number of customers (F) Mid value FX CF
0-20 19 10 190 19
20-40 27 30 810 46
40-60 39 50 1950 85
60-80 26 70 1820 111
80-100 22 90 1980 133
100-120 23 110 2530 156
120-140 19 130 2470 175
∑F = 175 ∑FX = 11750
Average: In descriptive statistics, it is the most important statistical measures of central tendency
which find out average of the given number or series (Zheng and et.al., 2016).
Average = ∑FX/∑F
= 11,750/175
= £67.14
Thus, average weekly expenditure in Wembley Central by one customer on shopping
behavior is found to £67.14.
Median: It is the mid value that means value that is equal to 50% of the data-series.
4 | P a g e
If there is a new cloth brand coming to your city, which would you expects:
Celebrity’s style design
Organic material
Premium quality
Reasonable charges
Others
TASK 2
2.1 Calculation of mean, mode and median
Weekly expenditures Number of customers (F) Mid value FX CF
0-20 19 10 190 19
20-40 27 30 810 46
40-60 39 50 1950 85
60-80 26 70 1820 111
80-100 22 90 1980 133
100-120 23 110 2530 156
120-140 19 130 2470 175
∑F = 175 ∑FX = 11750
Average: In descriptive statistics, it is the most important statistical measures of central tendency
which find out average of the given number or series (Zheng and et.al., 2016).
Average = ∑FX/∑F
= 11,750/175
= £67.14
Thus, average weekly expenditure in Wembley Central by one customer on shopping
behavior is found to £67.14.
Median: It is the mid value that means value that is equal to 50% of the data-series.
4 | P a g e
⊘ This is a preview!⊘
Do you want full access?
Subscribe today to unlock all pages.
Trusted by 1+ million students worldwide
m = Value of (∑F/2)th item
= (175/2)th item
= 87.5
It lies in CF of 111 in the class interval of £60-£80.
M =L 1+( N /2)−c/ F∗i
M =60+(87.5−85)/26∗20
¿ £ 61.92
Thus, middle value of weekly expenditures by consumers in Wembley Central is £61.92.
Mode: The item or value which has largest frequency is called as mode of the series
(Newbold, Carlson and Thorne, 2012). In the series, highest frequency is 39 that lies in the group
of £40-£60.
Z=L1+(F 1−F 0)/(2 F 1−F 0−F 2)∗i
¿ £ 40+(39−27)¿ ¿∗20
¿ £ 40+ £ 9.6
¿ £ 49.6
According to the results, maximum people at Wembley Central spend £49.6/week on buying
habits.
2.2 Explain the significance of the central tendency results
The above central tendency measurement found that considering average measures, it is
identified that people spend around £67.14/week on cloth shopping behavior. It means that
spending level revolve near to that value, thus, as per this, in order to generate more value, DG
Fashion needs to bring something uniqueness or offer premier quality products that are not
offering by competitor at Wembley Central. By this way, user can be easily attracted with greater
spending level. However, median (50%) of total spending is found to £61.92 little bit less than
average. However, on the other side, maximum buyers spend just £49.6 on apparel shopping
which is even less than average spending (Berman and Wang, 2017). Thus, not only the premium
5 | P a g e
Paraphrase This Document
Need a fresh take? Get an instant paraphrase of this document with our AI Paraphraser
quality products but also proper marketing both in-house and out-house seems really important
to attract crowded people at the prospective location and build competitive position.
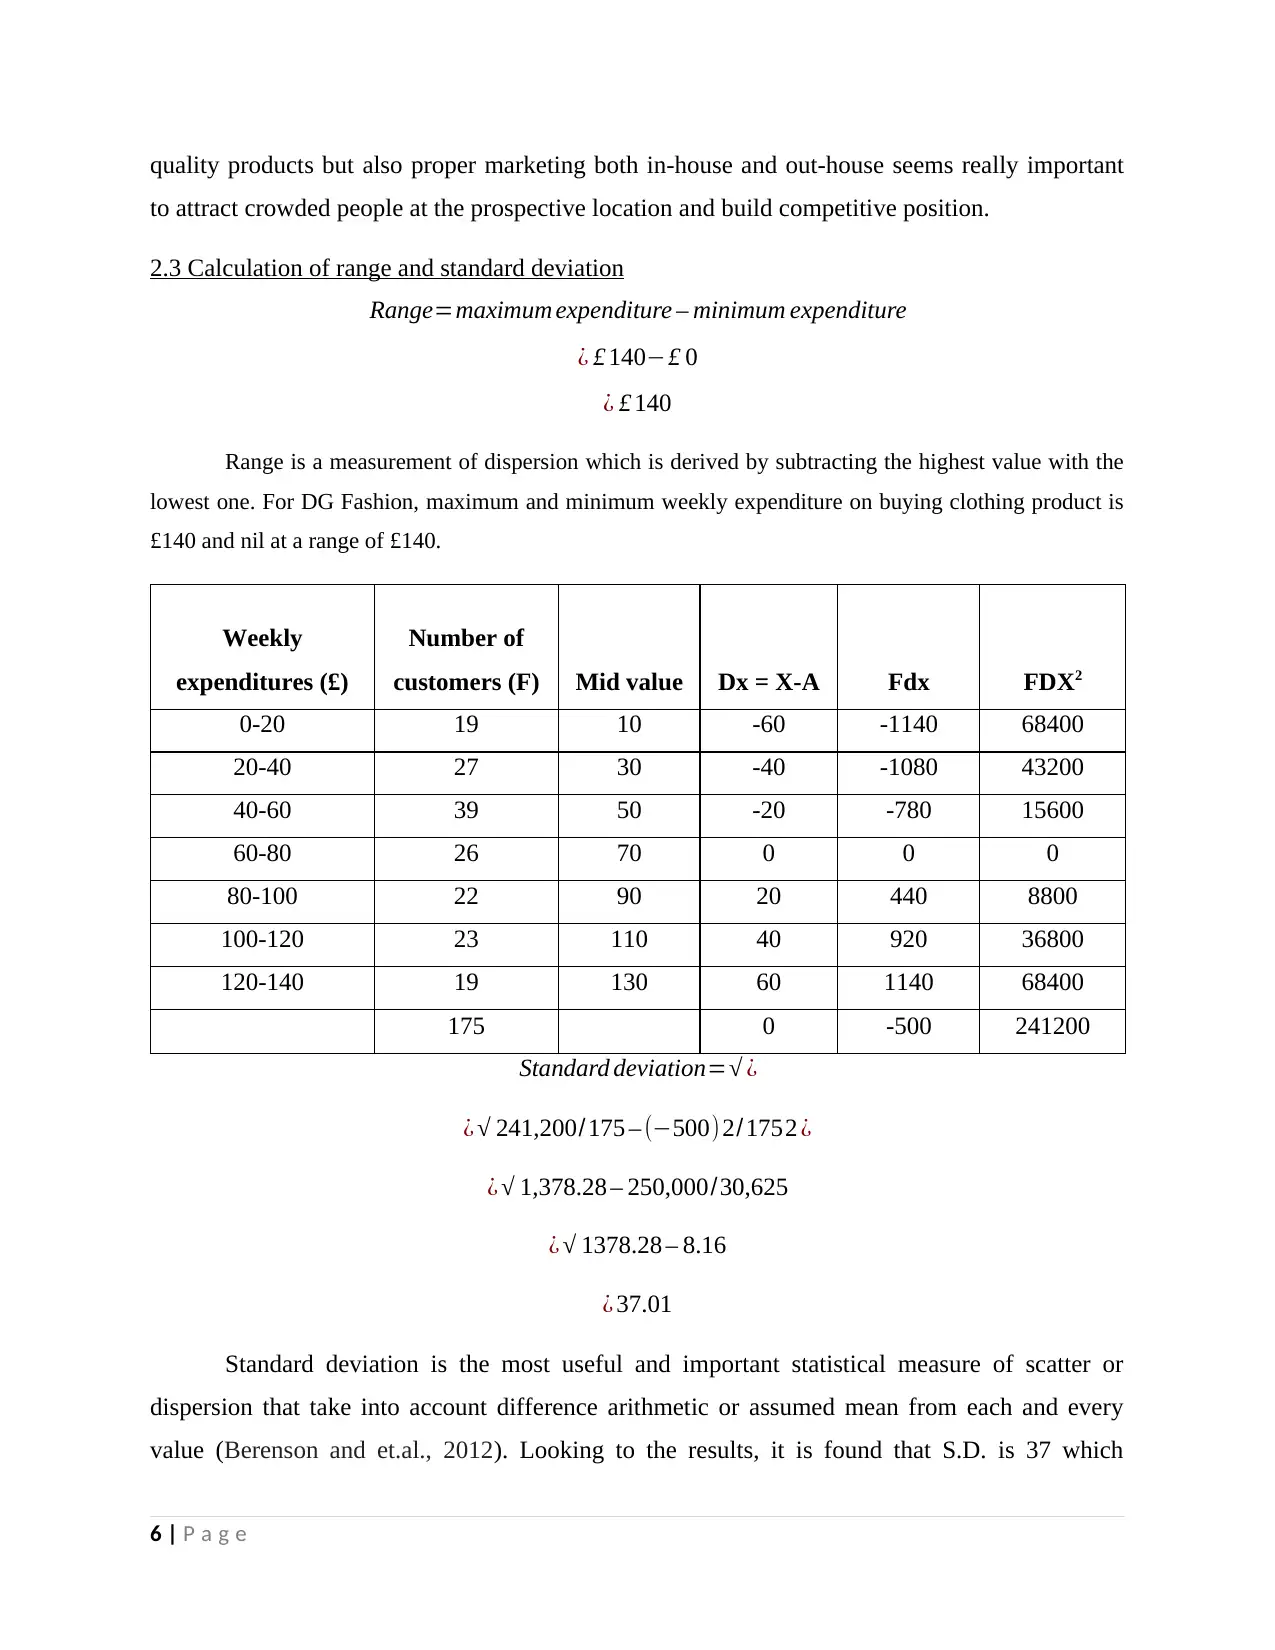
2.3 Calculation of range and standard deviation
Range=maximum expenditure – minimum expenditure
¿ £ 140−£ 0
¿ £ 140
Range is a measurement of dispersion which is derived by subtracting the highest value with the
lowest one. For DG Fashion, maximum and minimum weekly expenditure on buying clothing product is
£140 and nil at a range of £140.
Weekly
expenditures (£)
Number of
customers (F) Mid value Dx = X-A Fdx FDX2
0-20 19 10 -60 -1140 68400
20-40 27 30 -40 -1080 43200
40-60 39 50 -20 -780 15600
60-80 26 70 0 0 0
80-100 22 90 20 440 8800
100-120 23 110 40 920 36800
120-140 19 130 60 1140 68400
175 0 -500 241200
Standard deviation=√ ¿
¿ √ 241,200/175 – (−500) 2/1752 ¿
¿ √ 1,378.28 – 250,000/30,625
¿ √ 1378.28 – 8.16
¿ 37.01
Standard deviation is the most useful and important statistical measure of scatter or
dispersion that take into account difference arithmetic or assumed mean from each and every
value (Berenson and et.al., 2012). Looking to the results, it is found that S.D. is 37 which
6 | P a g e
to attract crowded people at the prospective location and build competitive position.
2.3 Calculation of range and standard deviation
Range=maximum expenditure – minimum expenditure
¿ £ 140−£ 0
¿ £ 140
Range is a measurement of dispersion which is derived by subtracting the highest value with the
lowest one. For DG Fashion, maximum and minimum weekly expenditure on buying clothing product is
£140 and nil at a range of £140.
Weekly
expenditures (£)
Number of
customers (F) Mid value Dx = X-A Fdx FDX2
0-20 19 10 -60 -1140 68400
20-40 27 30 -40 -1080 43200
40-60 39 50 -20 -780 15600
60-80 26 70 0 0 0
80-100 22 90 20 440 8800
100-120 23 110 40 920 36800
120-140 19 130 60 1140 68400
175 0 -500 241200
Standard deviation=√ ¿
¿ √ 241,200/175 – (−500) 2/1752 ¿
¿ √ 1,378.28 – 250,000/30,625
¿ √ 1378.28 – 8.16
¿ 37.01
Standard deviation is the most useful and important statistical measure of scatter or
dispersion that take into account difference arithmetic or assumed mean from each and every
value (Berenson and et.al., 2012). Looking to the results, it is found that S.D. is 37 which
6 | P a g e
demonstrates that scatter level of consumer expenditure on apparel product is very high. Some
spend too much whereas some people spend very low on clothing items.
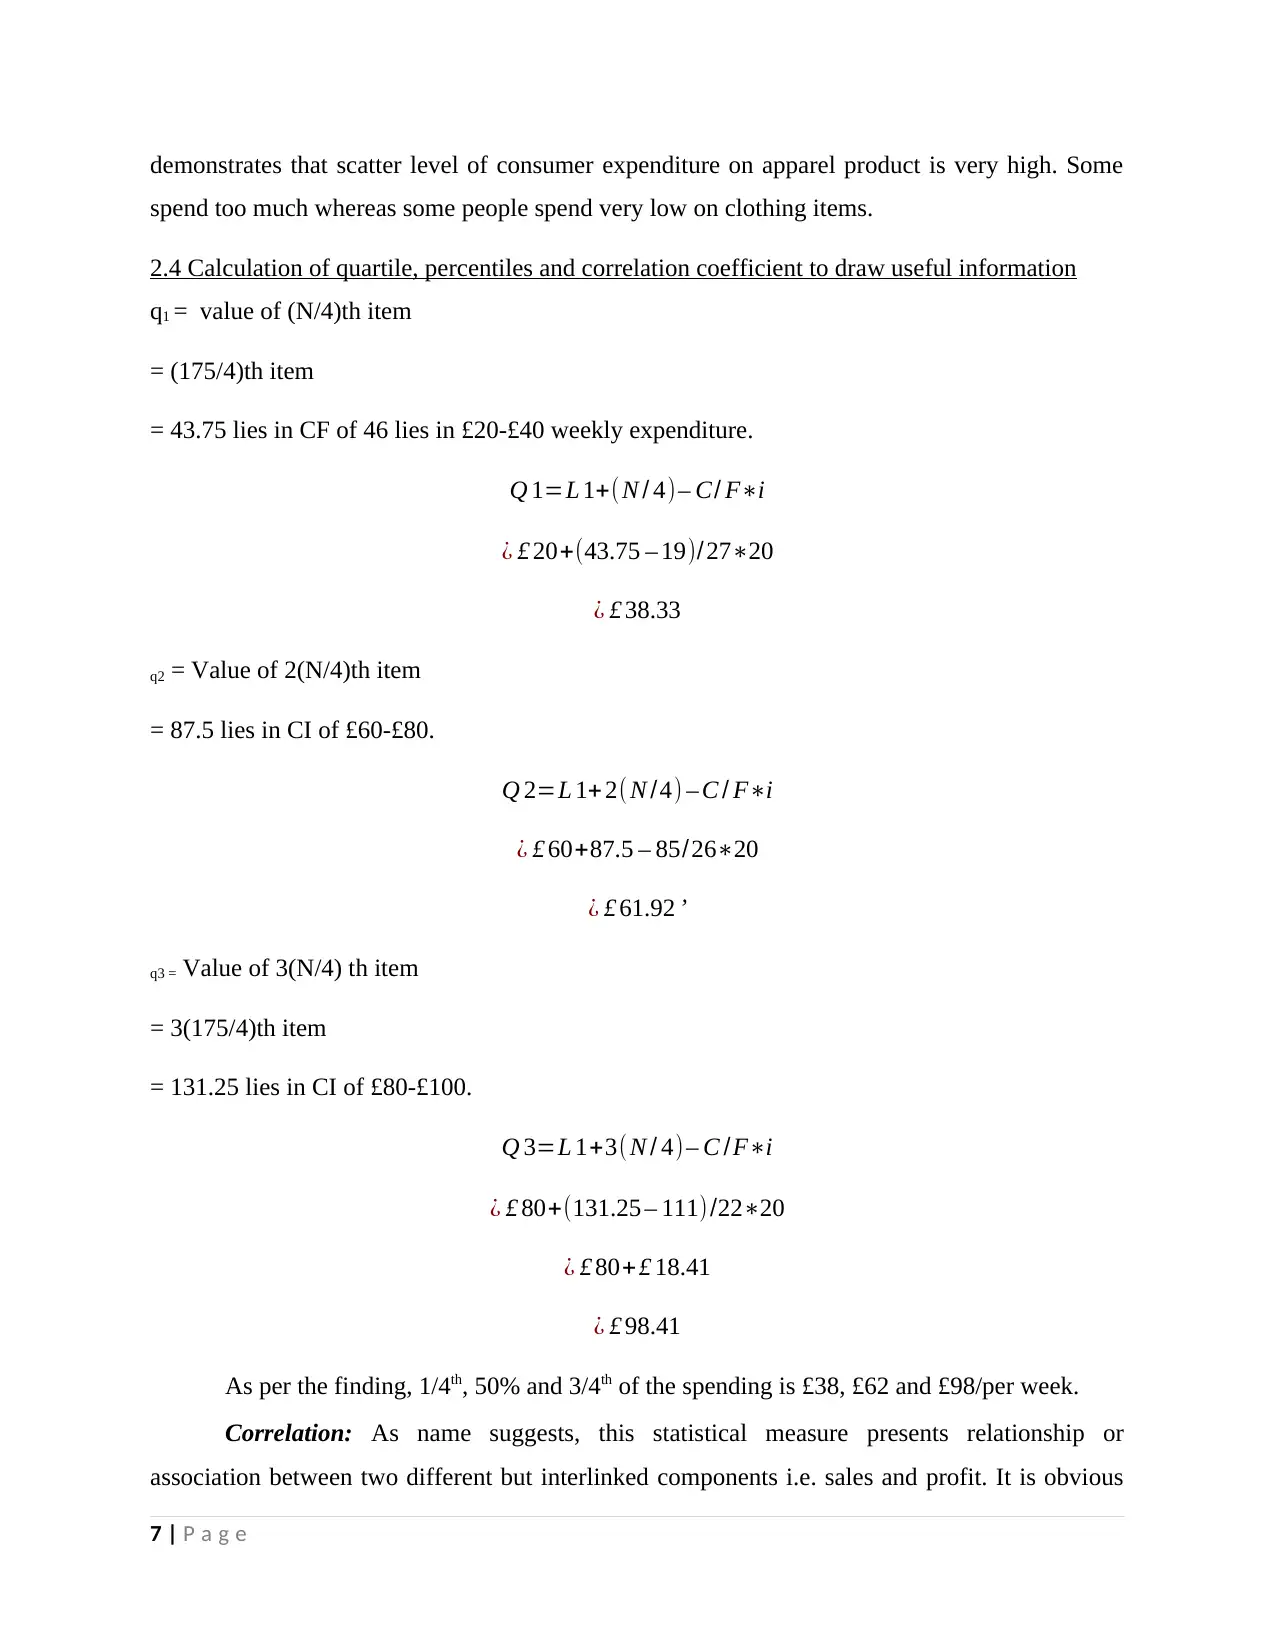
2.4 Calculation of quartile, percentiles and correlation coefficient to draw useful information
q1 = value of (N/4)th item
= (175/4)th item
= 43.75 lies in CF of 46 lies in £20-£40 weekly expenditure.
Q 1=L 1+( N / 4)– C/ F∗i
¿ £ 20+(43.75 – 19)/ 27∗20
¿ £ 38.33
q2 = Value of 2(N/4)th item
= 87.5 lies in CI of £60-£80.
Q 2=L 1+ 2( N /4) – C / F∗i
¿ £ 60+87.5 – 85/26∗20
¿ £ 61.92 ’
q3 = Value of 3(N/4) th item
= 3(175/4)th item
= 131.25 lies in CI of £80-£100.
Q 3=L 1+3(N / 4)– C /F∗i
¿ £ 80+(131.25 – 111) /22∗20
¿ £ 80+£ 18.41
¿ £ 98.41
As per the finding, 1/4th, 50% and 3/4th of the spending is £38, £62 and £98/per week.
Correlation: As name suggests, this statistical measure presents relationship or
association between two different but interlinked components i.e. sales and profit. It is obvious
7 | P a g e
spend too much whereas some people spend very low on clothing items.
2.4 Calculation of quartile, percentiles and correlation coefficient to draw useful information
q1 = value of (N/4)th item
= (175/4)th item
= 43.75 lies in CF of 46 lies in £20-£40 weekly expenditure.
Q 1=L 1+( N / 4)– C/ F∗i
¿ £ 20+(43.75 – 19)/ 27∗20
¿ £ 38.33
q2 = Value of 2(N/4)th item
= 87.5 lies in CI of £60-£80.
Q 2=L 1+ 2( N /4) – C / F∗i
¿ £ 60+87.5 – 85/26∗20
¿ £ 61.92 ’
q3 = Value of 3(N/4) th item
= 3(175/4)th item
= 131.25 lies in CI of £80-£100.
Q 3=L 1+3(N / 4)– C /F∗i
¿ £ 80+(131.25 – 111) /22∗20
¿ £ 80+£ 18.41
¿ £ 98.41
As per the finding, 1/4th, 50% and 3/4th of the spending is £38, £62 and £98/per week.
Correlation: As name suggests, this statistical measure presents relationship or
association between two different but interlinked components i.e. sales and profit. It is obvious
7 | P a g e
⊘ This is a preview!⊘
Do you want full access?
Subscribe today to unlock all pages.
Trusted by 1+ million students worldwide
that, as consumer in Wembley Central spend more on cloth items, DG Fashion will generate
more sales revenues or vice-versa.
TASK 3
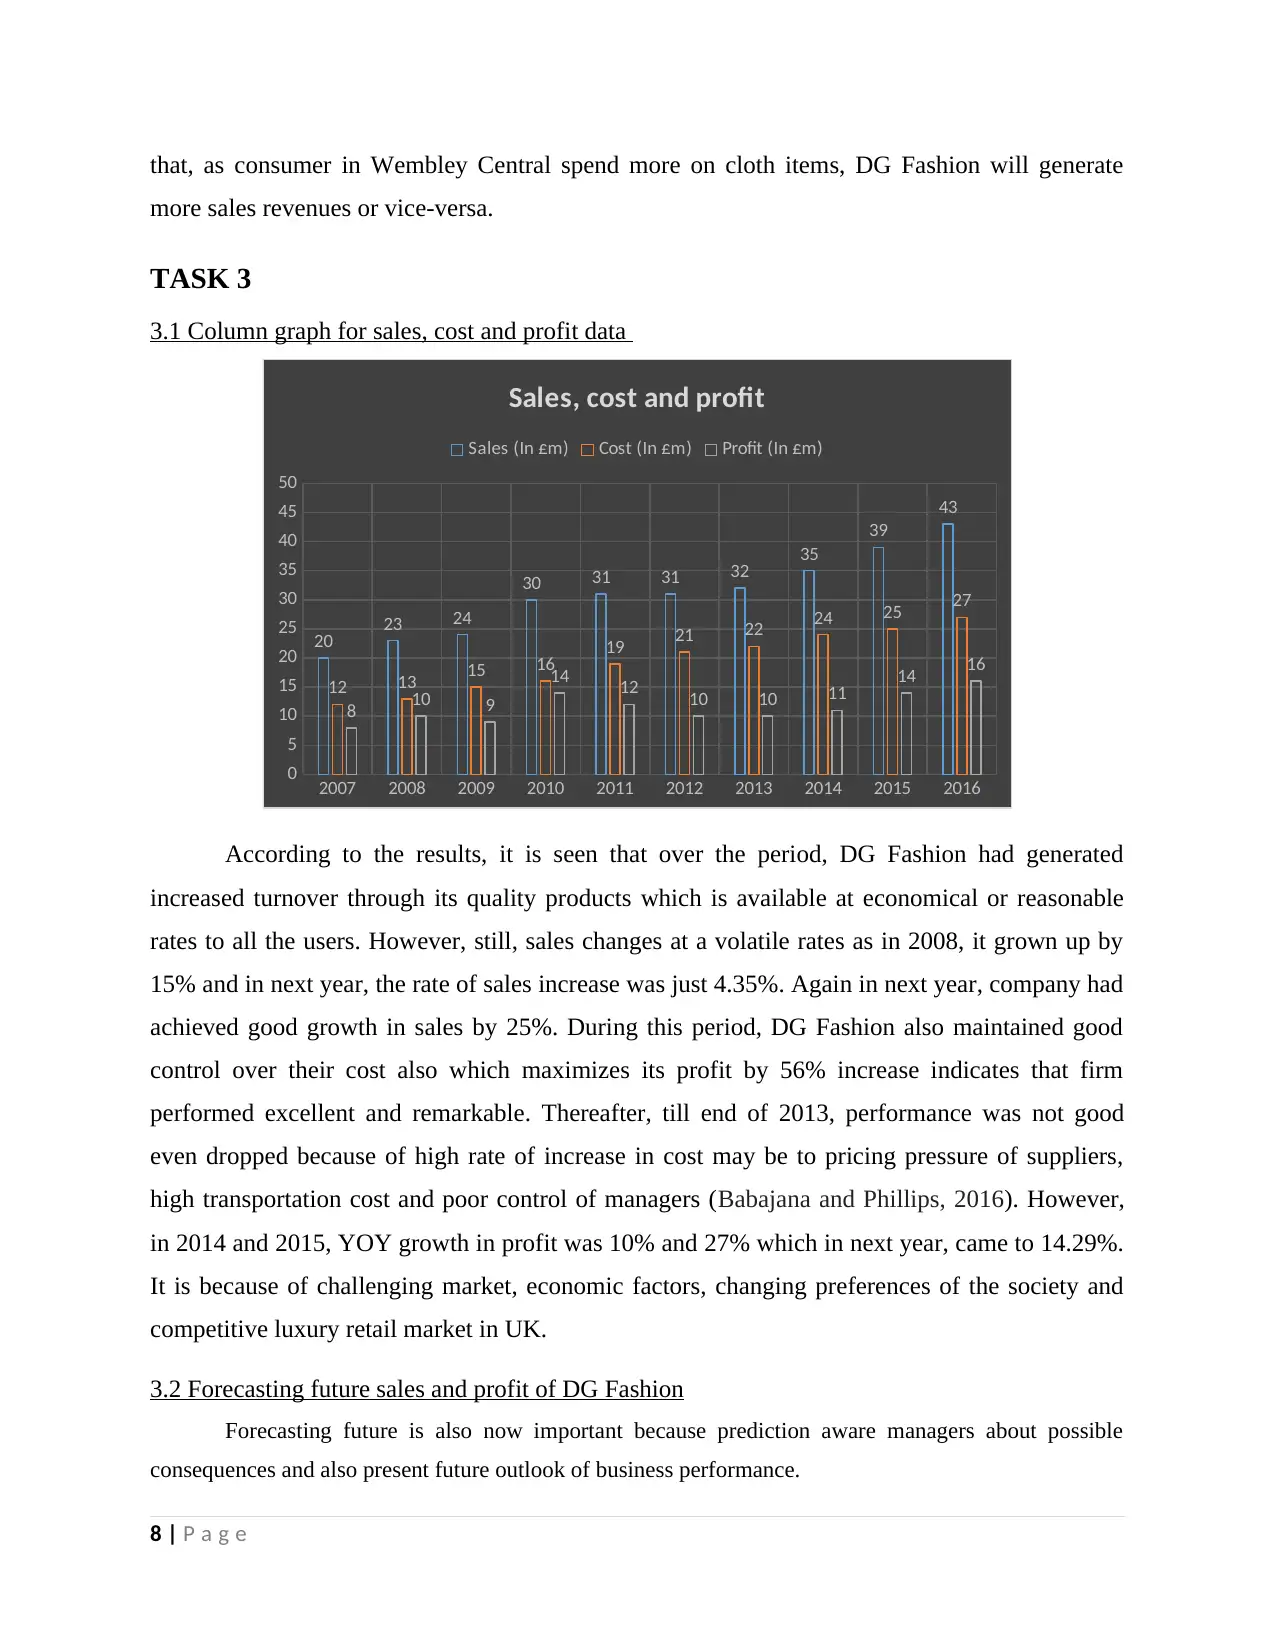
3.1 Column graph for sales, cost and profit data
2007 2008 2009 2010 2011 2012 2013 2014 2015 2016
0
5
10
15
20
25
30
35
40
45
50
20 23 24
30 31 31 32 35
39
43
12 13 15 16 19 21 22 24 25 27
8 10 9
14 12 10 10 11 14 16
Sales, cost and profit
Sales (In £m) Cost (In £m) Profit (In £m)
According to the results, it is seen that over the period, DG Fashion had generated
increased turnover through its quality products which is available at economical or reasonable
rates to all the users. However, still, sales changes at a volatile rates as in 2008, it grown up by
15% and in next year, the rate of sales increase was just 4.35%. Again in next year, company had
achieved good growth in sales by 25%. During this period, DG Fashion also maintained good
control over their cost also which maximizes its profit by 56% increase indicates that firm
performed excellent and remarkable. Thereafter, till end of 2013, performance was not good
even dropped because of high rate of increase in cost may be to pricing pressure of suppliers,
high transportation cost and poor control of managers (Babajana and Phillips, 2016). However,
in 2014 and 2015, YOY growth in profit was 10% and 27% which in next year, came to 14.29%.
It is because of challenging market, economic factors, changing preferences of the society and
competitive luxury retail market in UK.
3.2 Forecasting future sales and profit of DG Fashion
Forecasting future is also now important because prediction aware managers about possible
consequences and also present future outlook of business performance.
8 | P a g e
more sales revenues or vice-versa.
TASK 3
3.1 Column graph for sales, cost and profit data
2007 2008 2009 2010 2011 2012 2013 2014 2015 2016
0
5
10
15
20
25
30
35
40
45
50
20 23 24
30 31 31 32 35
39
43
12 13 15 16 19 21 22 24 25 27
8 10 9
14 12 10 10 11 14 16
Sales, cost and profit
Sales (In £m) Cost (In £m) Profit (In £m)
According to the results, it is seen that over the period, DG Fashion had generated
increased turnover through its quality products which is available at economical or reasonable
rates to all the users. However, still, sales changes at a volatile rates as in 2008, it grown up by
15% and in next year, the rate of sales increase was just 4.35%. Again in next year, company had
achieved good growth in sales by 25%. During this period, DG Fashion also maintained good
control over their cost also which maximizes its profit by 56% increase indicates that firm
performed excellent and remarkable. Thereafter, till end of 2013, performance was not good
even dropped because of high rate of increase in cost may be to pricing pressure of suppliers,
high transportation cost and poor control of managers (Babajana and Phillips, 2016). However,
in 2014 and 2015, YOY growth in profit was 10% and 27% which in next year, came to 14.29%.
It is because of challenging market, economic factors, changing preferences of the society and
competitive luxury retail market in UK.
3.2 Forecasting future sales and profit of DG Fashion
Forecasting future is also now important because prediction aware managers about possible
consequences and also present future outlook of business performance.
8 | P a g e
Paraphrase This Document
Need a fresh take? Get an instant paraphrase of this document with our AI Paraphraser
2007 2008 2009 2010 2011 2012 2013 2014 2015 2016
0
5
10
15
20
25
30
35
40
45
50
20
23 24
30 31 31 32
35
39
43
f(x) = 2.3030303030303 x + 18.1333333333333
R² = 0.952079542157871
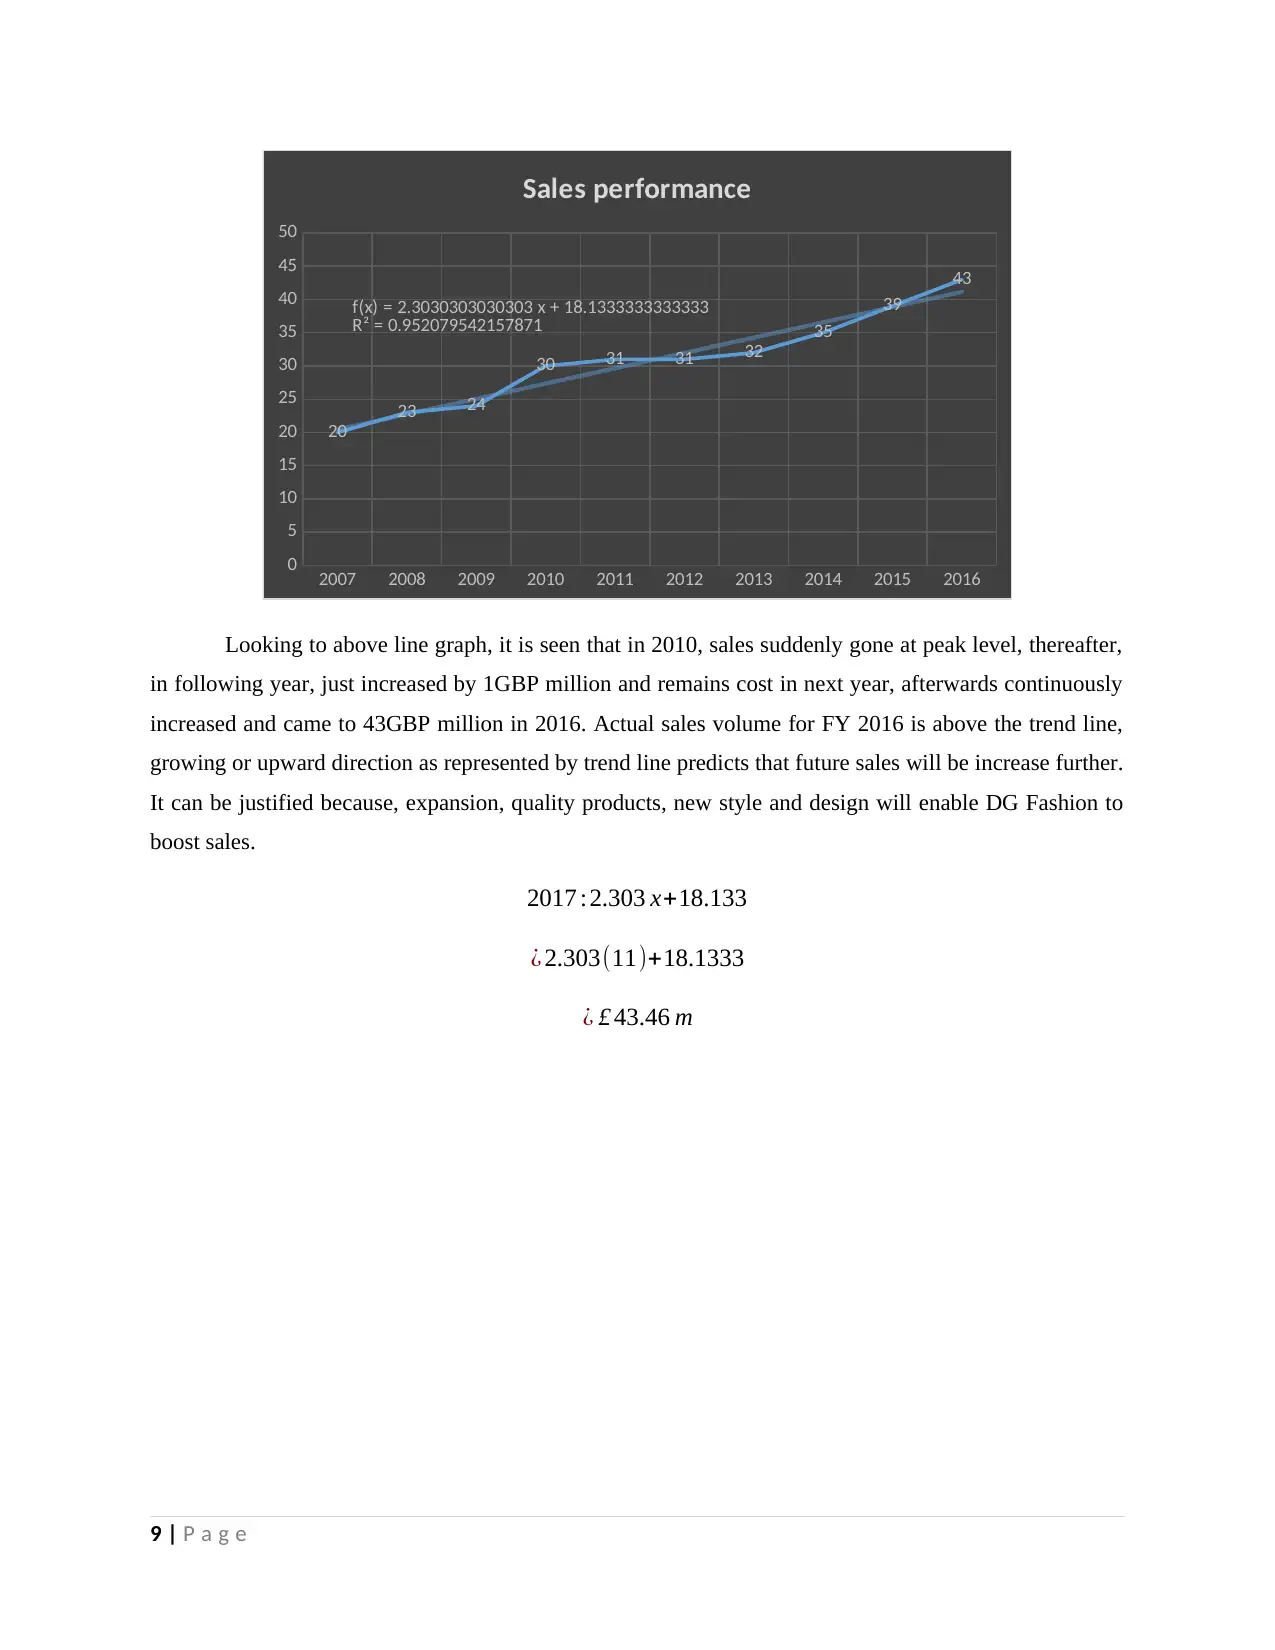
Sales performance
Looking to above line graph, it is seen that in 2010, sales suddenly gone at peak level, thereafter,
in following year, just increased by 1GBP million and remains cost in next year, afterwards continuously
increased and came to 43GBP million in 2016. Actual sales volume for FY 2016 is above the trend line,
growing or upward direction as represented by trend line predicts that future sales will be increase further.
It can be justified because, expansion, quality products, new style and design will enable DG Fashion to
boost sales.
2017 :2.303 x+18.133
¿ 2.303(11)+18.1333
¿ £ 43.46 m
9 | P a g e
0
5
10
15
20
25
30
35
40
45
50
20
23 24
30 31 31 32
35
39
43
f(x) = 2.3030303030303 x + 18.1333333333333
R² = 0.952079542157871
Sales performance
Looking to above line graph, it is seen that in 2010, sales suddenly gone at peak level, thereafter,
in following year, just increased by 1GBP million and remains cost in next year, afterwards continuously
increased and came to 43GBP million in 2016. Actual sales volume for FY 2016 is above the trend line,
growing or upward direction as represented by trend line predicts that future sales will be increase further.
It can be justified because, expansion, quality products, new style and design will enable DG Fashion to
boost sales.
2017 :2.303 x+18.133
¿ 2.303(11)+18.1333
¿ £ 43.46 m
9 | P a g e
2007 2008 2009 2010 2011 2012 2013 2014 2015 2016
0
2
4
6
8
10
12
14
16
18
8
10 9
14
12
10 10 11
14
16
f(x) = 0.581818181818182 x + 8.2
R² = 0.478206724782067
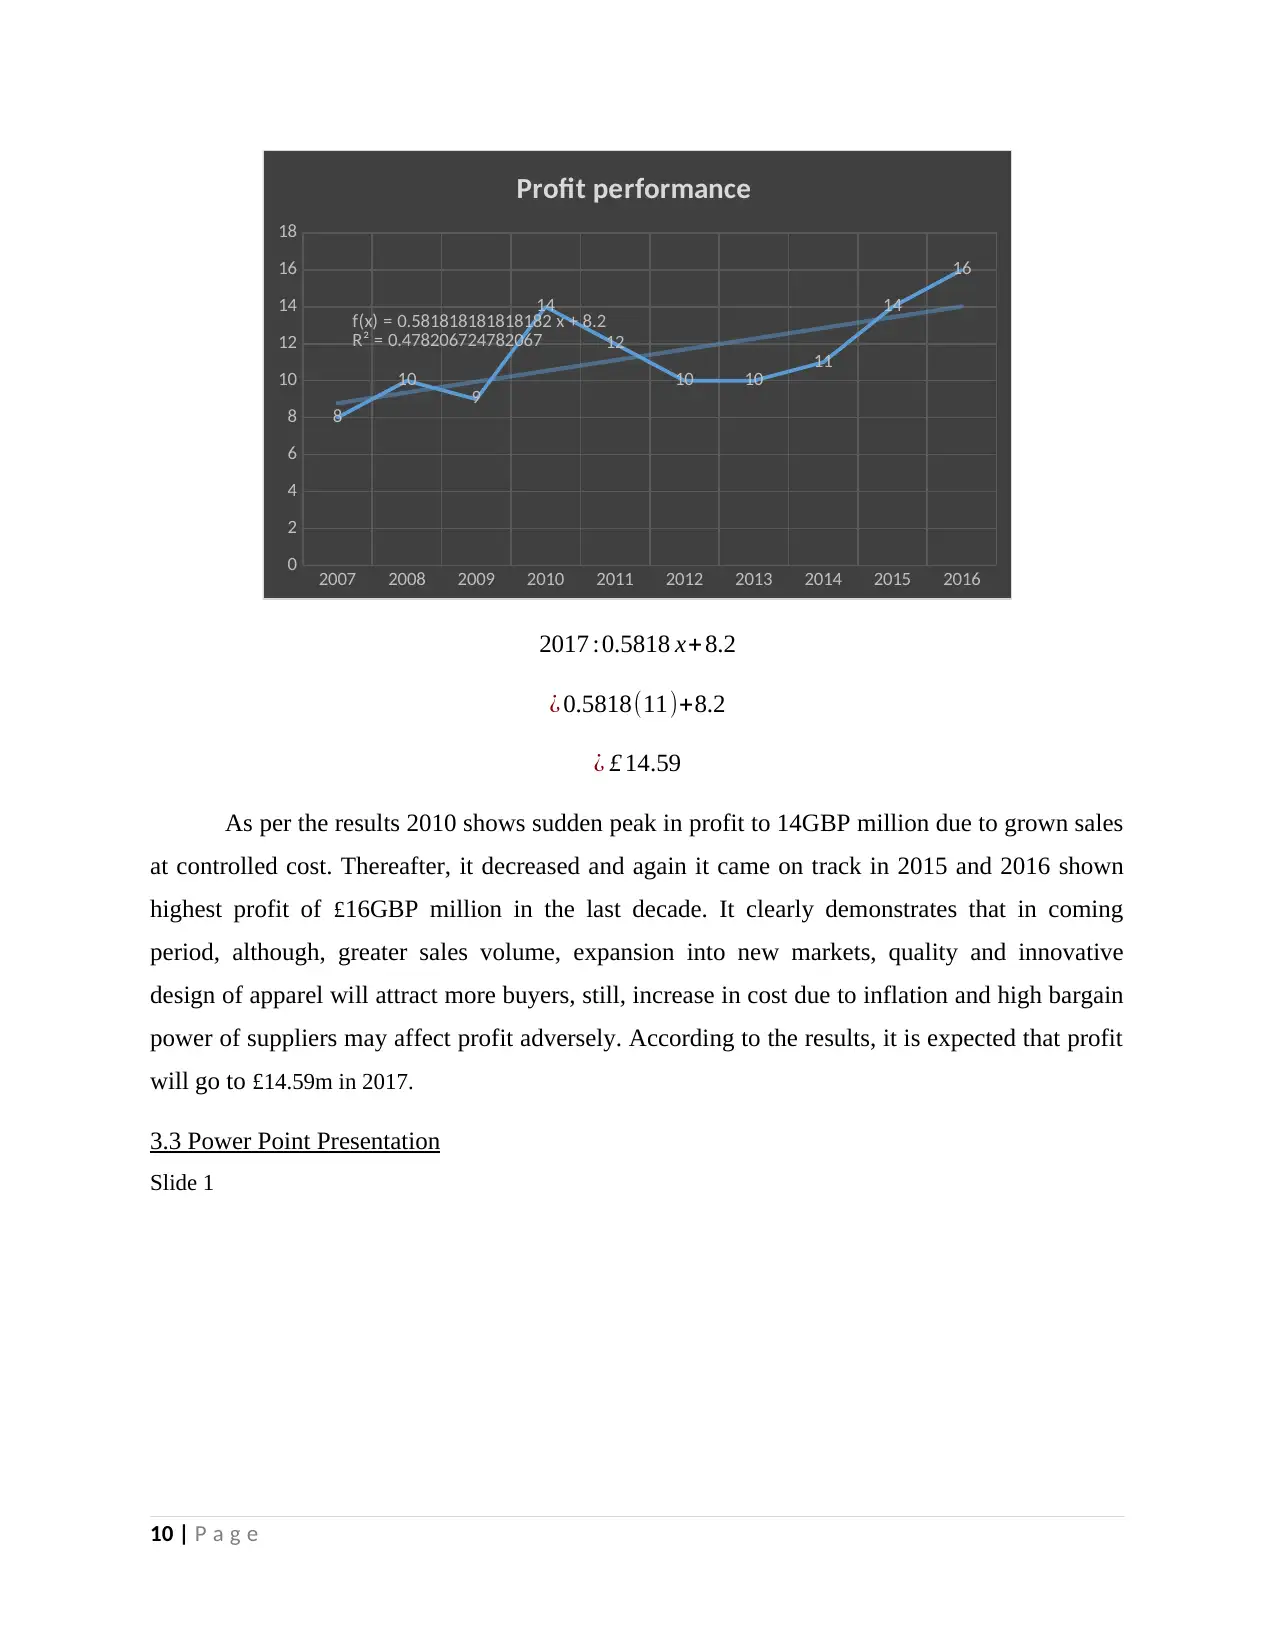
Profit performance
2017 :0.5818 x+8.2
¿ 0.5818(11)+8.2
¿ £ 14.59
As per the results 2010 shows sudden peak in profit to 14GBP million due to grown sales
at controlled cost. Thereafter, it decreased and again it came on track in 2015 and 2016 shown
highest profit of £16GBP million in the last decade. It clearly demonstrates that in coming
period, although, greater sales volume, expansion into new markets, quality and innovative
design of apparel will attract more buyers, still, increase in cost due to inflation and high bargain
power of suppliers may affect profit adversely. According to the results, it is expected that profit
will go to £14.59m in 2017.
3.3 Power Point Presentation
Slide 1
10 | P a g e
0
2
4
6
8
10
12
14
16
18
8
10 9
14
12
10 10 11
14
16
f(x) = 0.581818181818182 x + 8.2
R² = 0.478206724782067
Profit performance
2017 :0.5818 x+8.2
¿ 0.5818(11)+8.2
¿ £ 14.59
As per the results 2010 shows sudden peak in profit to 14GBP million due to grown sales
at controlled cost. Thereafter, it decreased and again it came on track in 2015 and 2016 shown
highest profit of £16GBP million in the last decade. It clearly demonstrates that in coming
period, although, greater sales volume, expansion into new markets, quality and innovative
design of apparel will attract more buyers, still, increase in cost due to inflation and high bargain
power of suppliers may affect profit adversely. According to the results, it is expected that profit
will go to £14.59m in 2017.
3.3 Power Point Presentation
Slide 1
10 | P a g e
⊘ This is a preview!⊘
Do you want full access?
Subscribe today to unlock all pages.
Trusted by 1+ million students worldwide
1 out of 25
Related Documents


Your All-in-One AI-Powered Toolkit for Academic Success.
+13062052269
info@desklib.com
Available 24*7 on WhatsApp / Email
![[object Object]](/_next/static/media/star-bottom.7253800d.svg)
Unlock your academic potential
Copyright © 2020–2026 A2Z Services. All Rights Reserved. Developed and managed by ZUCOL.