Business Decision Making Report: Analysis of Wm Morrison
VerifiedAdded on 2019/12/03
|45
|8376
|161
Report
AI Summary
This comprehensive report examines business decision-making processes, focusing on Wm Morrison Supermarkets Plc as a case study. It begins with a detailed research plan for collecting primary data through online surveys in Greater London, targeting consumer behavior and attitudes towards food discount retailing. Secondary data collection methods are also outlined, including the use of annual reports and academic journals. The report then delves into data analysis, employing representative values like mean, median, and mode, as well as measures of dispersion and correlation coefficients, to draw meaningful conclusions. It includes graphical representations using spreadsheets and trend line analysis to forecast sales revenue for Wm Morrison and its competitors. Furthermore, the report explores the application of information processing tools for operational, tactical, and strategic decisions, along with project management techniques such as Gantt charts and network diagrams. Financial tools like NPV and IRR are utilized to evaluate investment decisions. The study also presents the contributions of two students, Nicoleta Sandu and Mihai Sandu, reflecting on their individual roles. Finally, the report concludes with a reflective statement, summarizing the findings and recommendations for Wm Morrison's strategic approach.

Business Decision Making
1
1
Paraphrase This Document
Need a fresh take? Get an instant paraphrase of this document with our AI Paraphraser
TABLE OF CONTENT
INTRODUCTION...........................................................................................................................6
TASK 1............................................................................................................................................6
1.1 Research plan for primary and secondary data collection on consumer behaviour and
attitudes towards food discount retailing in Greater London......................................................6
1.2 Survey methodology and sampling frame.............................................................................7
1.3 Questionnaire for a survey.....................................................................................................7
TASK 2..........................................................................................................................................11
2.1 Summarizing data using representative values (arithmetic mean, median and mode)........11
2.2 Analyses of the results to draw valid conclusions for Wm Morrison Supermarkets Plc....28
2.3 Analyses data using measures of dispersion to inform a given business scenario (standard
deviations)..................................................................................................................................29
2.4 Quartiles, percentiles and the correlation coefficient are used to draw useful conclusions in
a business context......................................................................................................................29
TASK 3..........................................................................................................................................31
3.1 Presentation of graphs using spread sheets and conclusions based on the information
derived from the business Scenario...........................................................................................31
3.2 Create trend lines in spread sheet graphs to assist in forecasting sales revenue Wm
Morrison, JS Sainsbury’s, Lidl Ltd and Aldi.............................................................................34
3.3 Business presentation using suitable software and techniques to disseminate information
effectively..................................................................................................................................35
3.4 Business report forWm Morrison Plc on the threat of discounted food retailers and its
response towards the threats......................................................................................................35
TASK 4..........................................................................................................................................36
ANSWER FOR NICOLETA SANDU..........................................................................................36
2
4.1 Appropriate information processing tools for operational, tactical and strategic level
decisions at Wm Morrison Supermarkets Plc............................................................................36
4.2 Plan for the activity and determination of the critical path for Wm Morrison plc..............37
4.3 Application of financial tools (such as NPV, IRR) for making financial decision for Wm
Morrison....................................................................................................................................39
ANSWER FOR MIHAI SANDU..................................................................................................41
CONCLUSION..............................................................................................................................41
REFERENCES..............................................................................................................................42
REFLECTIVE STATEMENT OF NICOLETA SANDU.............................................................44
REFLECTIVE STATEMENT OF MIHAI SANDU.....................................................................44
| P a g e
⊘ This is a preview!⊘
Do you want full access?
Subscribe today to unlock all pages.
Trusted by 1+ million students worldwide
TABLE OF FIGURES
Figure 1: Column bar graph...........................................................................................................15
Figure 2: Line graph for Sale revenue...........................................................................................15
Figure 3: Histogram for sales revenue of Wm Morrison...............................................................16
Figure 4: Histogram for sales revenue of J Sainsbury...................................................................16
Figure 5: Histogram for sales revenue Lidl Ltd.............................................................................17
Figure 6: Histogram for sales revenue of Aldi..............................................................................17
Figure 7: Trend line graph.............................................................................................................18
Figure 8: Gantt chart for new product development project of Wm Morrison.............................21
Figure 9: Network Diagram for new product development project of Wm Morrison..................21
4
Paraphrase This Document
Need a fresh take? Get an instant paraphrase of this document with our AI Paraphraser
LIST OF TABLES
Table 1: Summarize table for collected data.................................................................................10
Table 2: Calculation of mean, mode and median..........................................................................11
Table 3: Calculation of Quartile and percentile.............................................................................13
Table 4: Secondary data collection of sales revenue and profit for determining correlation
coefficient......................................................................................................................................13
Table 5: Calculation Correlation Coefficient................................................................................14
Table 6: Activity table for new project development project of Wm Morrison............................19
Table 7: Calculation of Net Present Value for Project A and B....................................................22
Table 8: Calculation for the internal rate of return for project A..................................................23
Table 9: Calculation for the internal rate of return for project B...................................................23
5
INTRODUCTION
Business decision making is one of the crucial and important functions for each and every
organization in which management of the company needs to choose appropriate course of action
among several alternatives (Jankowicz, 2005). The current research study is based on business
decision making and regarding this, it has chosen Wm Morrison Supermarkets Plc. This research
report is based on a case study. Major aim of present study is using different techniques for
collecting and analyzing the useful information for making appropriate business decisions.
Therefore, it will comprise different sources of primary and secondary data collection. Along
with this, it evaluates ranges of techniques to analyze the data effectively for business purpose.
Research will also comprise different tools for taking operational management decisions for
organization.
Wm Morrison Supermarkets Plc is the fourth largest food retailers in UK. Annual
turnover of this organization is 2013 was £18bn and it is operating its business all over the world.
It has 500 stores across the UK which includes 12 convenience formats.
TASK 1
1.1 Research plan for primary and secondary data collection on consumer behaviour and
attitudes towards food discount retailing in Greater London
As per the given case study, vision of Wm Morrison is to make it ‘Different and Better
that Ever’. Including this, organization is focused on three objectives which include driving the
top line, increasing efficiency and capturing growth. Management of the organization requires
different information for making appropriate decisions to complete the vision. Researcher will
use appropriate tools and techniques for obtaining primary and secondary facts and figures
(Banerjee, 2006). Further, author will use a systematic research plan for obtaining supporting
information for business decision making which is described as under:
Research plan for primary data collection:
It is one of the important methods for collecting fresh and new information from
respondents which will help in taking appropriate decisions for organization. Research
department of Wm Morrison will use online survey of customers of the company using
questionnaire. It will be conducted in Greater London and will be based on customer behaviour
and attitudes towards food discount retailing by Wm Morrison (Akpolat and Pitinanondha,
6
⊘ This is a preview!⊘
Do you want full access?
Subscribe today to unlock all pages.
Trusted by 1+ million students worldwide
2009). Online survey is one of the important methods for collecting primary information because
it helps in saving time and cost of the organization. It will also assist in gathering appropriate
information because questionnaire will comprise various open and close ended questions
relevant to the customer’s behaviour and attitude towards discounted and non-discounted food
products and services of Wm Morrison.
Research plan for secondary data collection
Management of Wm Morrison will require historical information for forecasting the
future performance of the company (Fitsimmons, 2009). So, researcher will use different sources
for collecting secondary information. These sources include books, journals, articles, research
papers, annual report of Wm Morrison, etc. Therefore, collection of secondary data will assist
management in making financial and operational decisions for organization (Morrison (Wm)
Supermarkets PLC –MRW, 2015).
1.2 Survey methodology and sampling frame
Survey Methodology:
Researcher will conduct survey of customers of Wm Morrison of Greater London. The
whole survey will be based on consumer behaviour and attitudes towards the food retaining by
Wm Morrison. Survey will be carried on adults in Greater London. Regarding this, author will
collect email ids of selected customers and then will conduct online survey. It will help in getting
primary information for business decision making (Morato, 2013).
Sampling frame:
For conducting primary investigation, author needs to select appropriate sample from
research universe. Random sampling method will be used by researcher. It will be significant
because it provides equal chance to each and every customer of food retailers to get selected in
sample. Sample will be selected from the adult population and each customer will be aged 18
and over (Greasley, 2007). The sample size will be 50 which will help in representing the whole
research universe.
1.3 Questionnaire for a survey
1. Demographic information of customers of Wm Morrison:
Name:
| P a g e
Paraphrase This Document
Need a fresh take? Get an instant paraphrase of this document with our AI Paraphraser
Age:
Gender:
Occupation:
2. What is your working status?
Working
Nonworking
3. What is your marital status?
Married
Unmarried
4. Do you purchase feed products from discount retailing shops by Wm Morrison?
Yes
No
5. How much distance you need to travel for making purchase from regular food discount
retailers?
<1 Km
1-5 Km
5-10 Km
>10 Km
6. What is the major reason behind the use of products and services of discount food
retailers of Wm Morrison?
High price of food products
For getting discount
For getting high quantity of products in less money
For reducing food expenses
For getting appropriate value of money
7. How frequently you use food products from discount food retailers?
Daily basis
Once in a week
Once in a month
Once in three months
8. How much time you take for shopping at discount food retailer by Wm Morrison?
| P a g e
< 1hr.
1-2 hr.
2-5 hr.
>5 hr.
9. How much amount you spend at a discount food retailer of Wm Morrison in a single
purchase?
<£100
£100-200
£200-300
> £300
10. Are you satisfied with the quality of food products and services of discount food retailers
of Wm Morrison?
Strongly satisfied
Satisfied
Neutral
Dissatisfied
Strongly dissatisfied
11. As per your own opinion, which organization has the best discounted food retailer in
UK?
Wm Morrison
Js Sainsbury’s
Lidl Ltd
Aldi
12. Have you got any difference in quality of discounted and non-discounted food products
of Wm Morrison?
Yes
No
13. Are you satisfied with the price of discounted food products and services of discount food
retailers of Wm Morrison?
Strongly satisfied
Satisfied
| P a g e
⊘ This is a preview!⊘
Do you want full access?
Subscribe today to unlock all pages.
Trusted by 1+ million students worldwide
Neutral
Dissatisfied
Strongly dissatisfied
14. On which extent you believe that, discount of food products encourages you to make
purchase from discount food retailers of Wm Morrison?
Strongly agreed
Agreed
Neutral
Disagreed
Strongly disagreed
15. Do you satisfied with the communication of Wm Morrison about different offers of
discount?
Strongly agreed
Agreed
Neutral
Disagreed
Strongly disagreed
16. From which source you receive information about different food products and services of
discount food retailers of Wm Morrison?
Social media marketing
Television advertising
Mobile marketing
Online marketing
Websites
Publicity
17. Which factor has negative impacts on your purchase decision at the time of making
purchase from discount food retailers of Wm Morrison?
High price of discounted products and services
Low quality of products
Lack of availability of products
Post purchase services of company
| P a g e
Paraphrase This Document
Need a fresh take? Get an instant paraphrase of this document with our AI Paraphraser
18. Do you require any improvement in discounted food products and services of the of
discount food retailers of Wm Morrison?
Yes
No
19. Will you purchase food products and services from discount food retailers of Wm
Morrison in coming future?
Yes
No
20. Please provide your suggestions for improving the food products and services of discount
food retailers of Wm Morrison?
Contribution of every student:
The whole task has been done by both students and each student has his own contribution
in completing the entire task. Both, Nicoleta Sandu and Mihai Sandu have completed this task in
an effective manner in which Nicoleta Sandu has developed research plan and primary research
on current research subject. On the other hand, Mihai Sandu has conducted primary research on
selected sample using survey methodology. Therefore, Mihai Sandu has used questionnaire for
conducting online survey of customers of Wm Morrison.
TASK 2
2.1 Summarizing data using representative values (arithmetic mean, median and mode)
Table 1: Calculation of mean, mode and median
Retailer
Year WmMorrison
s
Js
Sainsbury’s LidlLtd Aldi
2009 14,528 18,911 164.5 2,004
2010 15,410 19,964 167.9 2,014
2011 16,479 21,102 183.2 2,768
2012 17,663 22,294 202.7 3,891
2013 18,116 23,303 212.2 5200
Mean 16,439 21,115 186 3,175
| P a g e
Median 16,479 21,102 183 2,768
Range 3,588 4,392 48 3,196
Standrad Deviation 1501.904358 1757.837507 20.9939276
9
1369.13213
4
Variance 2255716.7 3089992.7 440.745 1874522.8
As per the given case study, Sales revenue of Wm Morrison is increasing year by year.
Calculations of Mean, Mode and Median help in analyzing the average sales of the company. As
per the above calculation, mean of five year’s sales revenue is 16439.2 which represent the
minimum average sales of Wm Morrison. Including this, Median of the given information is
16479 which show the sales in the middle years. Along with this, there is no repetitive sales
revenue so; there is no mode for WmMorrison (Wallnau and Gravetter, 2009).
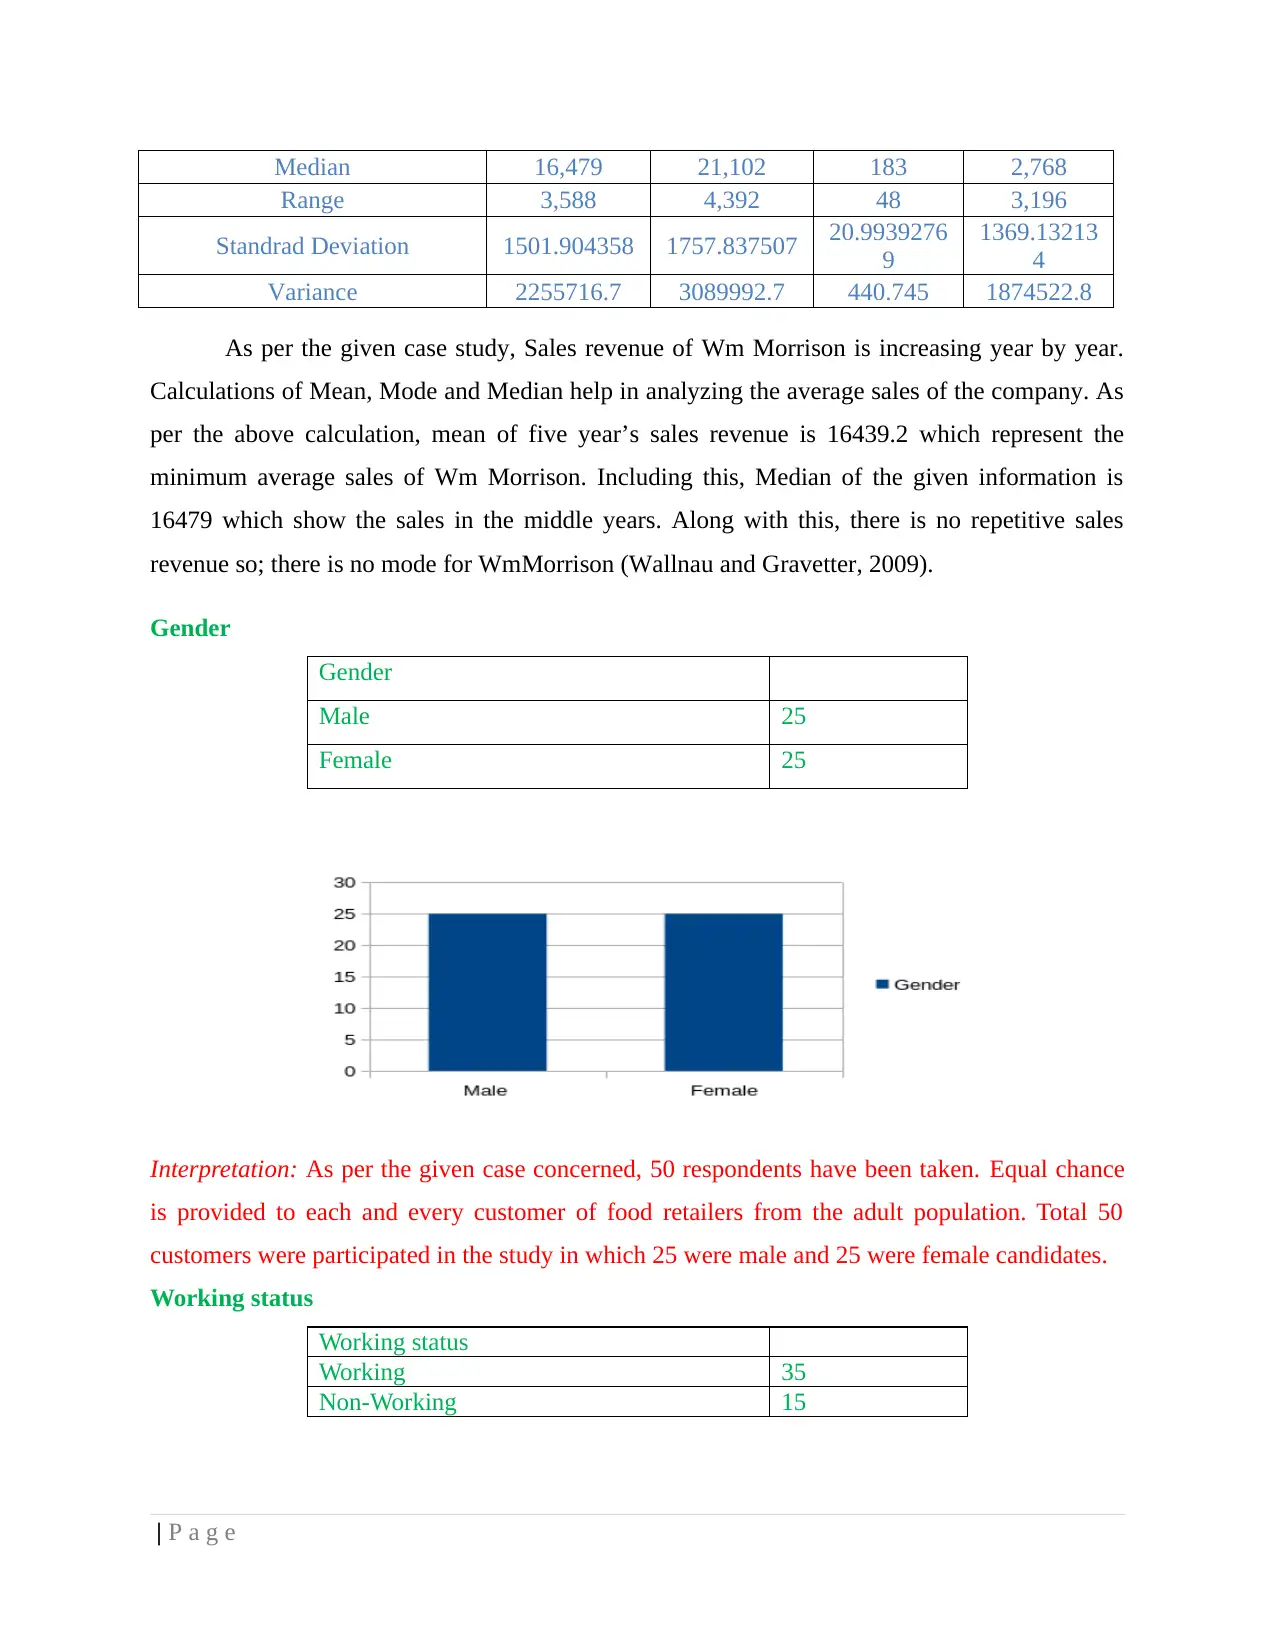
Gender
Gender
Male 25
Female 25
Interpretation: As per the given case concerned, 50 respondents have been taken. Equal chance
is provided to each and every customer of food retailers from the adult population. Total 50
customers were participated in the study in which 25 were male and 25 were female candidates.
Working status
Working status
Working 35
Non-Working 15
| P a g e
Range 3,588 4,392 48 3,196
Standrad Deviation 1501.904358 1757.837507 20.9939276
9
1369.13213
4
Variance 2255716.7 3089992.7 440.745 1874522.8
As per the given case study, Sales revenue of Wm Morrison is increasing year by year.
Calculations of Mean, Mode and Median help in analyzing the average sales of the company. As
per the above calculation, mean of five year’s sales revenue is 16439.2 which represent the
minimum average sales of Wm Morrison. Including this, Median of the given information is
16479 which show the sales in the middle years. Along with this, there is no repetitive sales
revenue so; there is no mode for WmMorrison (Wallnau and Gravetter, 2009).
Gender
Gender
Male 25
Female 25
Interpretation: As per the given case concerned, 50 respondents have been taken. Equal chance
is provided to each and every customer of food retailers from the adult population. Total 50
customers were participated in the study in which 25 were male and 25 were female candidates.
Working status
Working status
Working 35
Non-Working 15
| P a g e
⊘ This is a preview!⊘
Do you want full access?
Subscribe today to unlock all pages.
Trusted by 1+ million students worldwide
1 out of 45
Related Documents


Your All-in-One AI-Powered Toolkit for Academic Success.
+13062052269
info@desklib.com
Available 24*7 on WhatsApp / Email
![[object Object]](/_next/static/media/star-bottom.7253800d.svg)
Unlock your academic potential
Copyright © 2020–2026 A2Z Services. All Rights Reserved. Developed and managed by ZUCOL.