Business Decision Making Report: Data Analysis for UKCBC
VerifiedAdded on 2023/04/04
|21
|4500
|286
Report
AI Summary
This report presents a comprehensive analysis of business decision-making, focusing on a case study at the UK College of Business and Computing (UKCBC). The report outlines a plan for data collection from students across all campuses, detailing the use of primary and secondary data collection methods. It describes the survey methodology, including the sampling frame and the design of a questionnaire used to gather student feedback. The report further delves into data analysis, computing measures of central tendency (mean, median, and mode) and dispersion (standard deviation), interpreting the results to assess student satisfaction. Quartile and correlation calculations are also included to provide a comprehensive statistical overview. The study aims to evaluate the college's performance and identify areas for improvement based on student feedback.

BUSINESS DECISION
MAKING
1
MAKING
1
Paraphrase This Document
Need a fresh take? Get an instant paraphrase of this document with our AI Paraphraser
2
INTRODUCTION
Globalization has paved way for business organizations to gain success and growth.
However many challenges and difficulties also have been arises and it has become vital that
decisions and strategies for business should be formed by adopting strategic and innovative
approach. Decision making for business is a complex and critical process which requires
strategic approaches from the side of the entrepreneur so that required decisions for business can
be taken successfully. In addition to that it aids for making innovative and effective strategies for
performing the business functions successfully. Present report is based on UK college of
business and computing (UKCBC). The report describes about creating a plan for collecting
from students across all campuses. In addition to that survey methodology and sampling frame
presented has been mentioned. Moreover, a questionnaire has been designed for collecting the
data and summaries of data and information has been done in the report.
TASK 1
1.1 Plan for collection of data from students across campus
It is imperative that data should be collected from authentic and reliable data sources so
that required outcomes should be successfully gained (Ho, Xu and Dey, 2010). There are two
main methods that are used for gathering necessary data that is required for performing the study.
Along with this data and information. Data collection techniques that have been used in the
present study are as mentioned: -
Primary data collection methods: - under this primary data has been gathered for conducting the
study in successful manner. Primary data is the data that is being collected at first time and in
this performance of the organization is evaluated. Questionnaire method in which questionnaire
asked to the respondents proves useful for collecting all the necessary information in successful
manner. Along with this primary data collection method has been used for taking the information
from the respondents. It provides an effective medium that could be used for carrying out the
necessary activities of the institution in successful way (Vercellis, 2011).
Secondary data collection methods: - In this method use of secondary data is taken so that
required objectives of the study should be accomplished. Data has been collected from books,
journals, online sources such as websites and internet. Use of various non-econometric and
3
⊘ This is a preview!⊘
Do you want full access?
Subscribe today to unlock all pages.
Trusted by 1+ million students worldwide
econometric tools have been taken and it has helped for gathering necessary information.
Secondary information that is collected from different sources aids for completing the study in
effective and successful way.
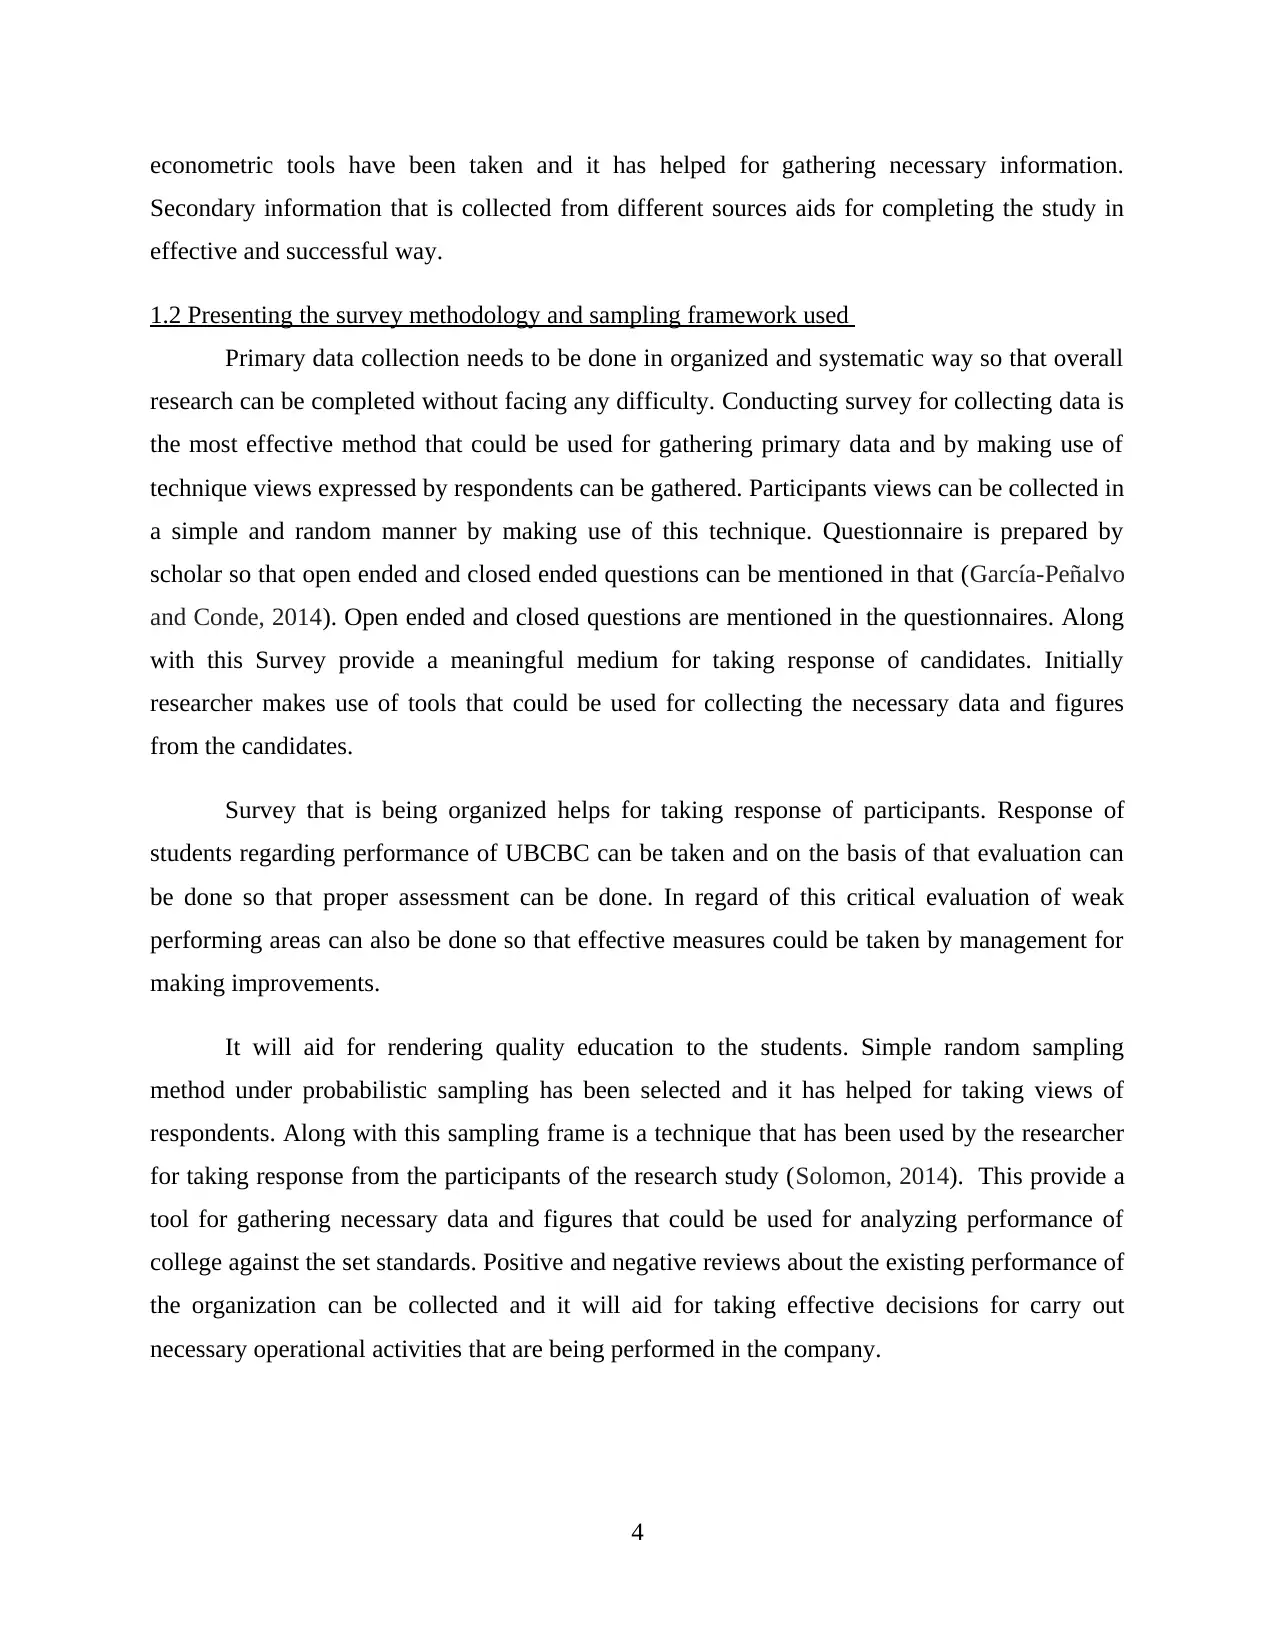
1.2 Presenting the survey methodology and sampling framework used
Primary data collection needs to be done in organized and systematic way so that overall
research can be completed without facing any difficulty. Conducting survey for collecting data is
the most effective method that could be used for gathering primary data and by making use of
technique views expressed by respondents can be gathered. Participants views can be collected in
a simple and random manner by making use of this technique. Questionnaire is prepared by
scholar so that open ended and closed ended questions can be mentioned in that (García-Peñalvo
and Conde, 2014). Open ended and closed questions are mentioned in the questionnaires. Along
with this Survey provide a meaningful medium for taking response of candidates. Initially
researcher makes use of tools that could be used for collecting the necessary data and figures
from the candidates.
Survey that is being organized helps for taking response of participants. Response of
students regarding performance of UBCBC can be taken and on the basis of that evaluation can
be done so that proper assessment can be done. In regard of this critical evaluation of weak
performing areas can also be done so that effective measures could be taken by management for
making improvements.
It will aid for rendering quality education to the students. Simple random sampling
method under probabilistic sampling has been selected and it has helped for taking views of
respondents. Along with this sampling frame is a technique that has been used by the researcher
for taking response from the participants of the research study (Solomon, 2014). This provide a
tool for gathering necessary data and figures that could be used for analyzing performance of
college against the set standards. Positive and negative reviews about the existing performance of
the organization can be collected and it will aid for taking effective decisions for carry out
necessary operational activities that are being performed in the company.
4
Secondary information that is collected from different sources aids for completing the study in
effective and successful way.
1.2 Presenting the survey methodology and sampling framework used
Primary data collection needs to be done in organized and systematic way so that overall
research can be completed without facing any difficulty. Conducting survey for collecting data is
the most effective method that could be used for gathering primary data and by making use of
technique views expressed by respondents can be gathered. Participants views can be collected in
a simple and random manner by making use of this technique. Questionnaire is prepared by
scholar so that open ended and closed ended questions can be mentioned in that (García-Peñalvo
and Conde, 2014). Open ended and closed questions are mentioned in the questionnaires. Along
with this Survey provide a meaningful medium for taking response of candidates. Initially
researcher makes use of tools that could be used for collecting the necessary data and figures
from the candidates.
Survey that is being organized helps for taking response of participants. Response of
students regarding performance of UBCBC can be taken and on the basis of that evaluation can
be done so that proper assessment can be done. In regard of this critical evaluation of weak
performing areas can also be done so that effective measures could be taken by management for
making improvements.
It will aid for rendering quality education to the students. Simple random sampling
method under probabilistic sampling has been selected and it has helped for taking views of
respondents. Along with this sampling frame is a technique that has been used by the researcher
for taking response from the participants of the research study (Solomon, 2014). This provide a
tool for gathering necessary data and figures that could be used for analyzing performance of
college against the set standards. Positive and negative reviews about the existing performance of
the organization can be collected and it will aid for taking effective decisions for carry out
necessary operational activities that are being performed in the company.
4
Paraphrase This Document
Need a fresh take? Get an instant paraphrase of this document with our AI Paraphraser
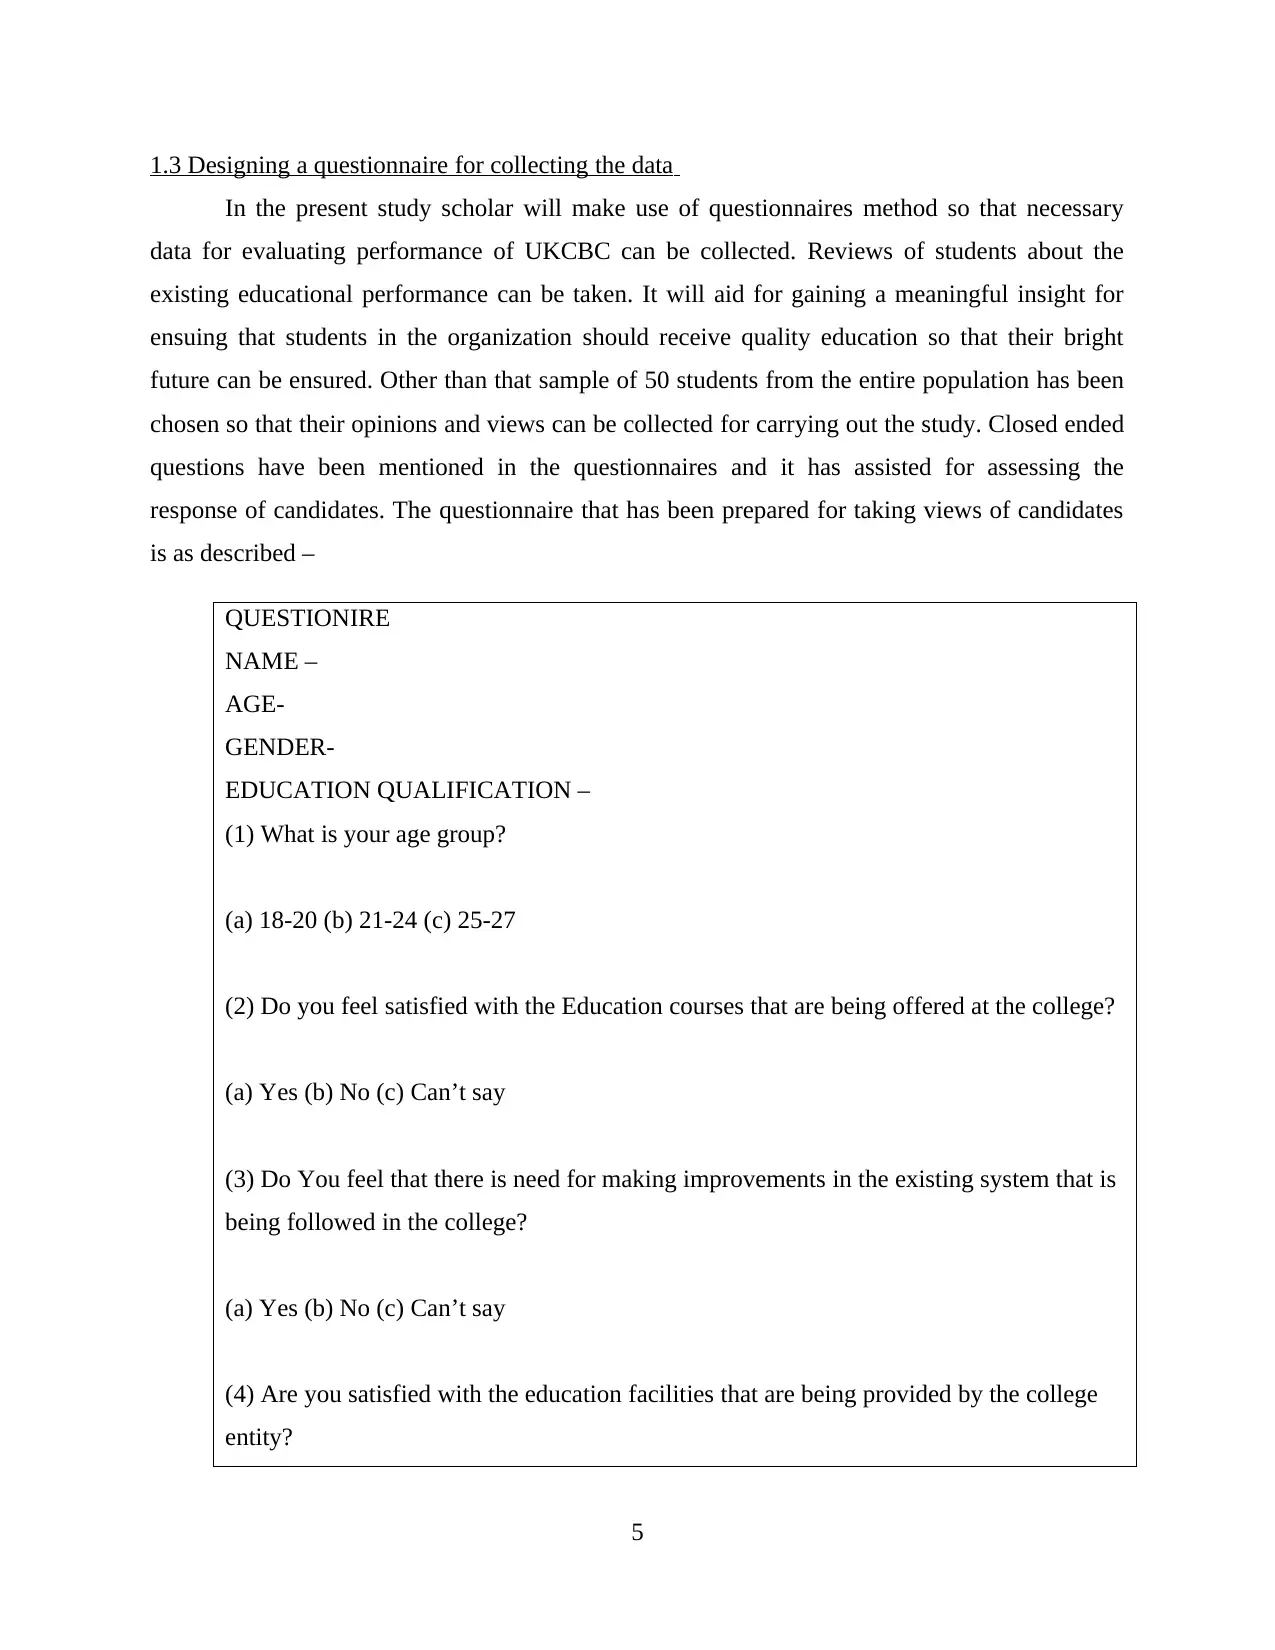
1.3 Designing a questionnaire for collecting the data
In the present study scholar will make use of questionnaires method so that necessary
data for evaluating performance of UKCBC can be collected. Reviews of students about the
existing educational performance can be taken. It will aid for gaining a meaningful insight for
ensuing that students in the organization should receive quality education so that their bright
future can be ensured. Other than that sample of 50 students from the entire population has been
chosen so that their opinions and views can be collected for carrying out the study. Closed ended
questions have been mentioned in the questionnaires and it has assisted for assessing the
response of candidates. The questionnaire that has been prepared for taking views of candidates
is as described –
QUESTIONIRE
NAME –
AGE-
GENDER-
EDUCATION QUALIFICATION –
(1) What is your age group?
(a) 18-20 (b) 21-24 (c) 25-27
(2) Do you feel satisfied with the Education courses that are being offered at the college?
(a) Yes (b) No (c) Can’t say
(3) Do You feel that there is need for making improvements in the existing system that is
being followed in the college?
(a) Yes (b) No (c) Can’t say
(4) Are you satisfied with the education facilities that are being provided by the college
entity?
5
(a) Yes (b) No (c) Can’t say
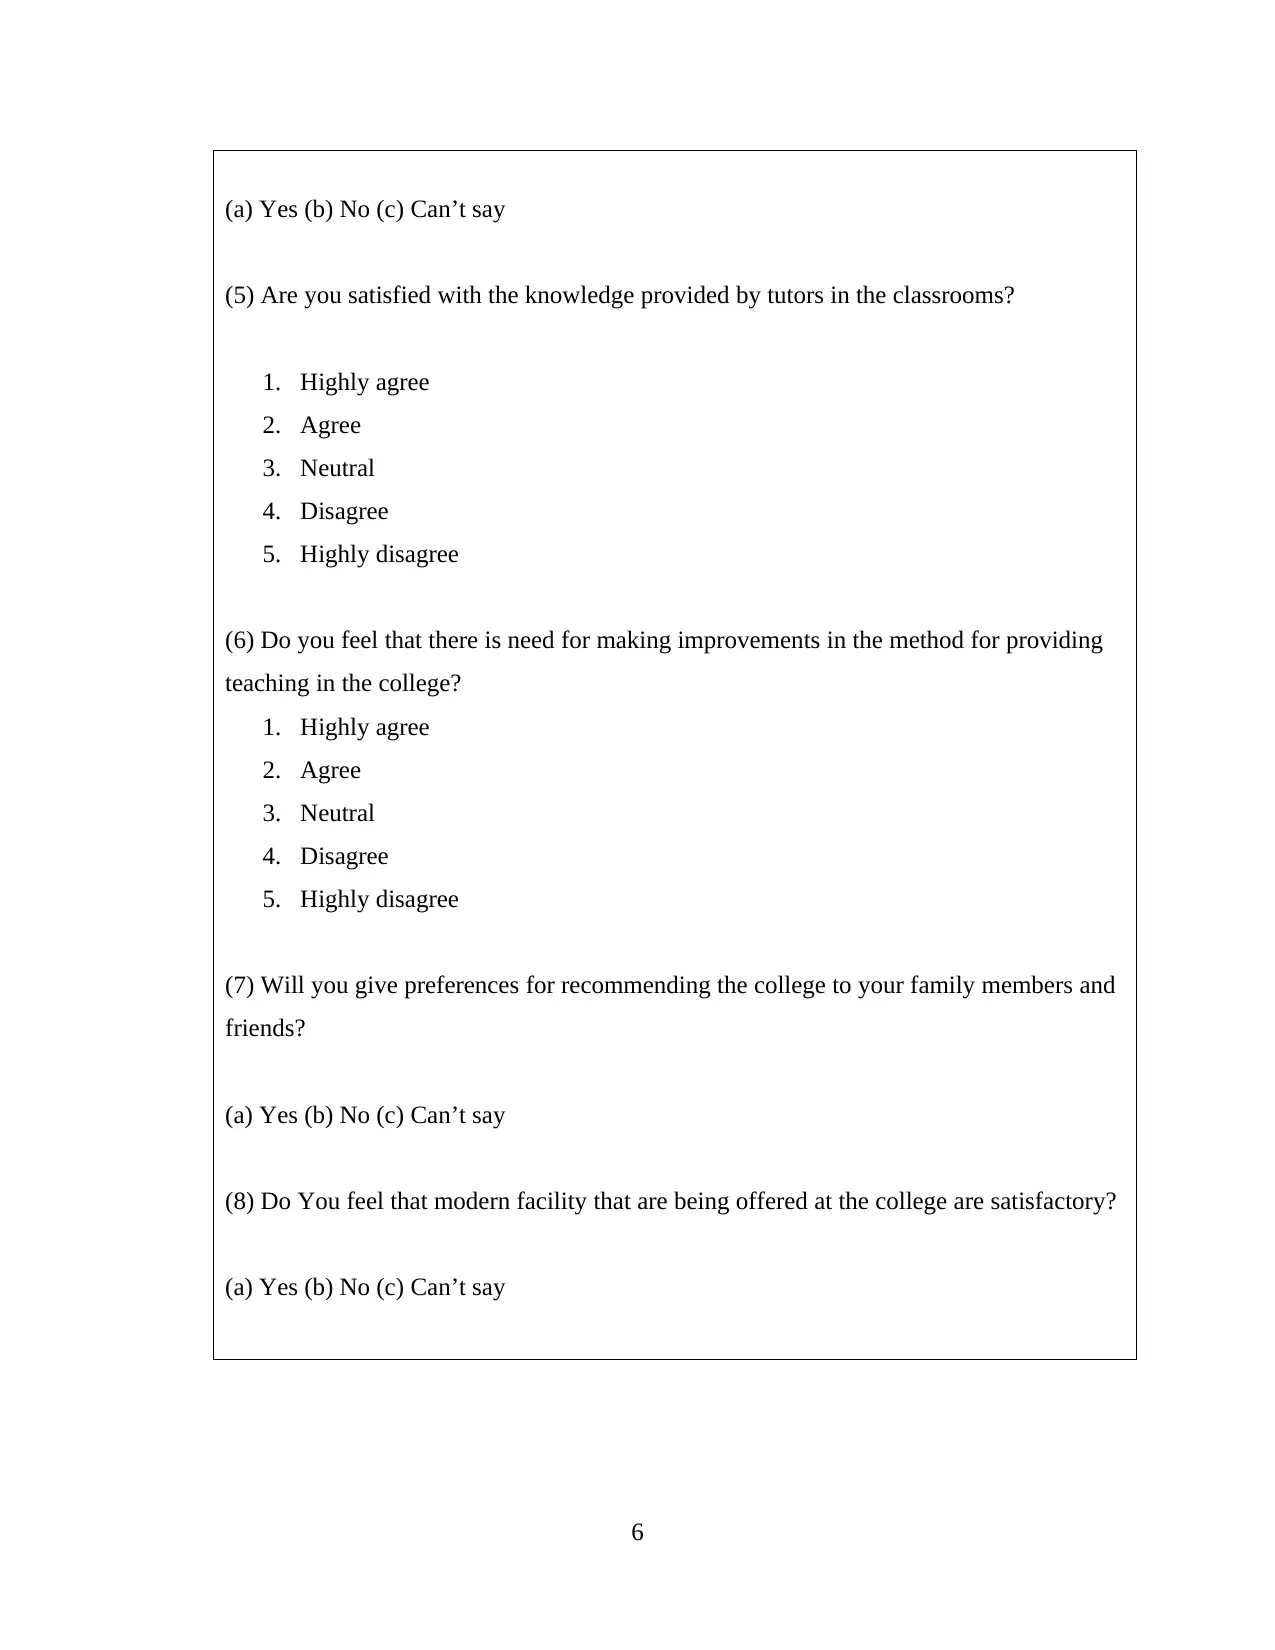
(5) Are you satisfied with the knowledge provided by tutors in the classrooms?
1. Highly agree
2. Agree
3. Neutral
4. Disagree
5. Highly disagree
(6) Do you feel that there is need for making improvements in the method for providing
teaching in the college?
1. Highly agree
2. Agree
3. Neutral
4. Disagree
5. Highly disagree
(7) Will you give preferences for recommending the college to your family members and
friends?
(a) Yes (b) No (c) Can’t say
(8) Do You feel that modern facility that are being offered at the college are satisfactory?
(a) Yes (b) No (c) Can’t say
6
⊘ This is a preview!⊘
Do you want full access?
Subscribe today to unlock all pages.
Trusted by 1+ million students worldwide
TASK 2
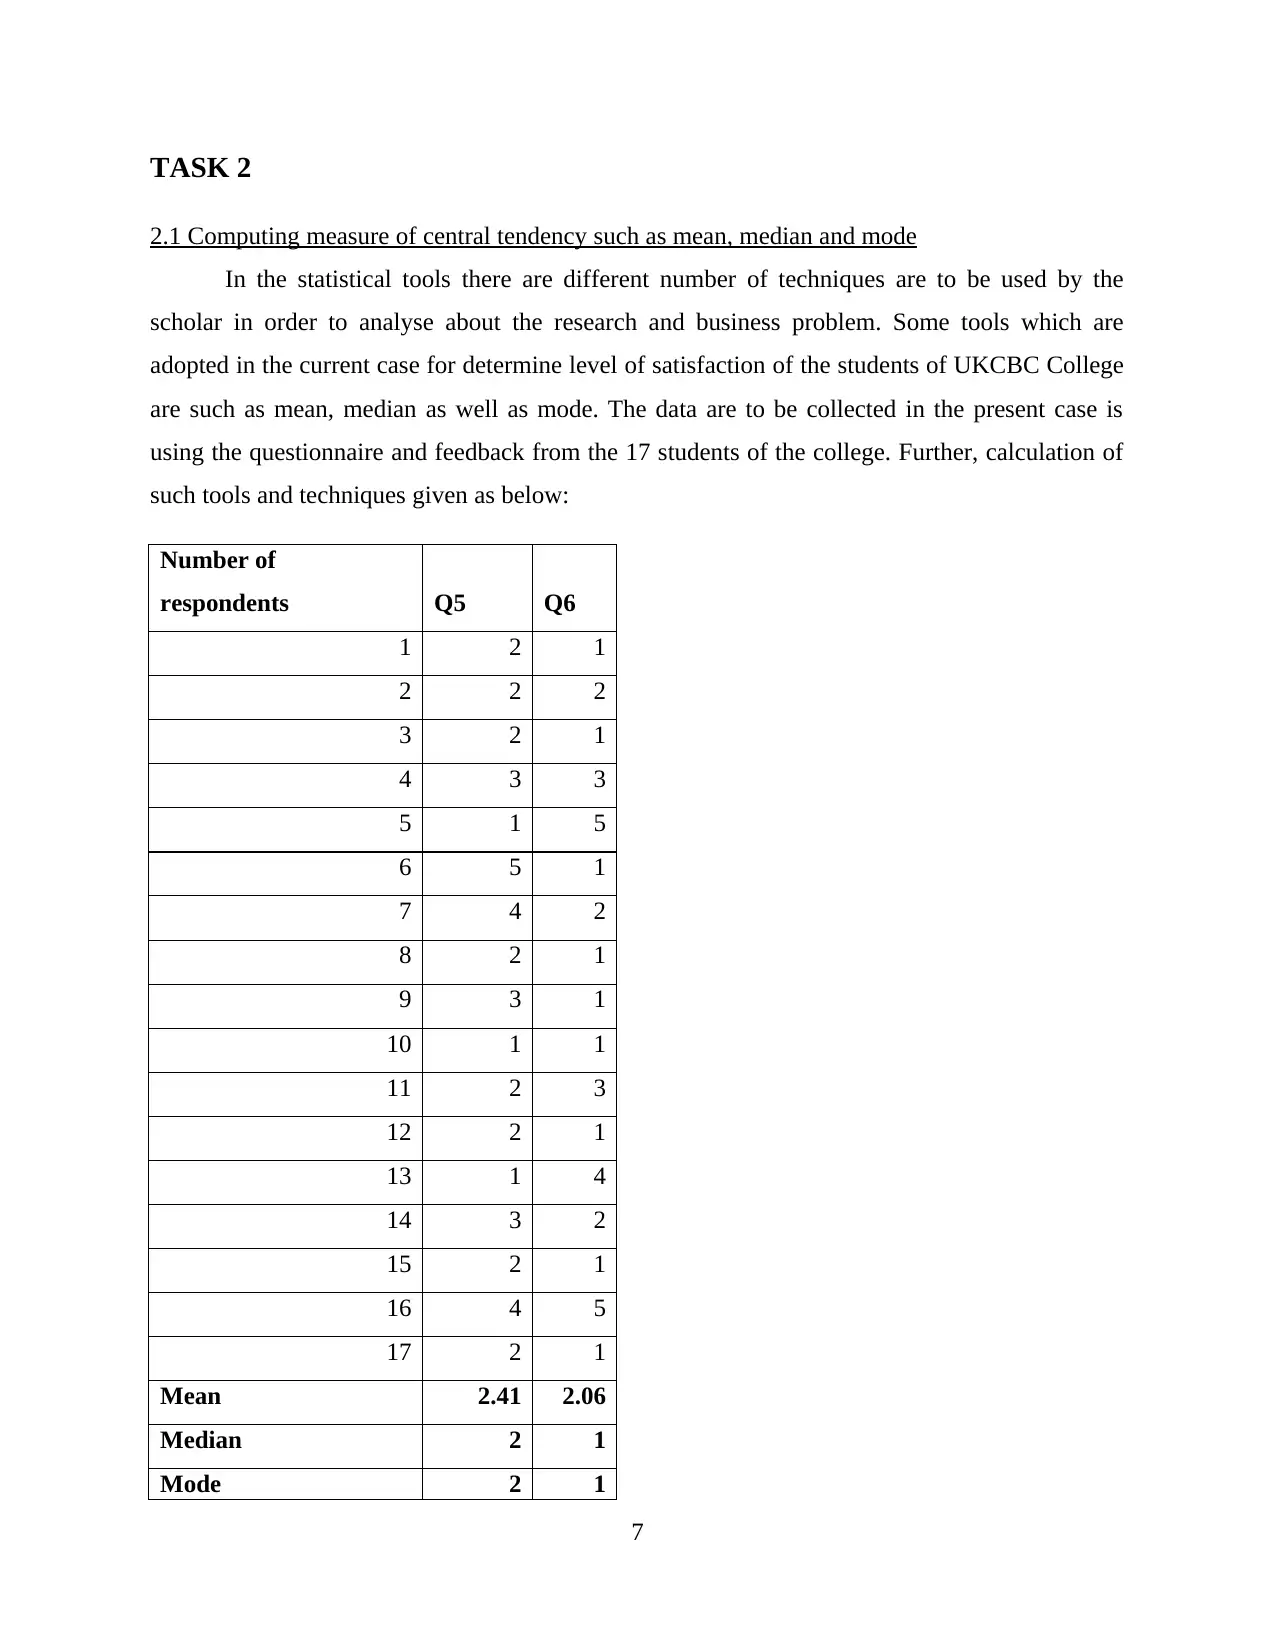
2.1 Computing measure of central tendency such as mean, median and mode
In the statistical tools there are different number of techniques are to be used by the
scholar in order to analyse about the research and business problem. Some tools which are
adopted in the current case for determine level of satisfaction of the students of UKCBC College
are such as mean, median as well as mode. The data are to be collected in the present case is
using the questionnaire and feedback from the 17 students of the college. Further, calculation of
such tools and techniques given as below:
Number of
respondents Q5 Q6
1 2 1
2 2 2
3 2 1
4 3 3
5 1 5
6 5 1
7 4 2
8 2 1
9 3 1
10 1 1
11 2 3
12 2 1
13 1 4
14 3 2
15 2 1
16 4 5
17 2 1
Mean 2.41 2.06
Median 2 1
Mode 2 1
7
Paraphrase This Document
Need a fresh take? Get an instant paraphrase of this document with our AI Paraphraser
Mean: The value under which the scholar able to know average value of the data set which is
derived from the total 17 students of the college. By this the company or educational institute is
easily able to assess that on an average there are how much students are more agree as well as
satisfy from the services and education which provided to them by UKCBC (Nutt and Wilson,
2010).
Median: The other tool of measure of central tendency is median which helpful and supportable
to the scholar for dividing the overall data into two kind of equal parts. Another kind of measure
of central tendency is like as median where the investigator determine that what is the middle
and central value of the data set. Further, it helps to known that upper value from the median or
lower values are more better. On the basis of this, the college can know that upper the median
value college able to satisfy and attract the more students or lower the median value. On the basis
of this further decisions in the UKBC college are to be made.
Mode: Other measure of central tendency used in the current case is such as mode by which the
scholar can know that in whole data set there are which one value occurs often. The value or
number of those students who are more satisfy from the educational institutions are easily
assessed and known by the researcher (Pettigrew, 2014).
2.2 Interpretation and analysis of the results
Mean: From the above mentioned calculation it can be analysed and interpreted that average
value of the whole data and respondents is such as 2.41 which shows that students are rely
between the agree and neutral situation. Most of the numbers of students are fully neither agrees
nor neutral and they are at the middle position. Apart from this, the 2.06 value of average shows
that the students of college totally agree that college needs to improve its educational systems for
make them highly satisfied.
Median: It is not possible that every time available data will be in small scale and due to
segregate in equal two parts the current measure of central tendency is to be used. At the current
case, middle value of overall data is 2 which shows that most of the students and respondents of
the UKCBC college are agree by the knowledge which is delivered to them (Robert, 2010).
8
Apart from thus, as pert the second kind of theme or question it has been ascertained that the
more number of students are highly agree and thinks that method of delivering the educational
knowledge must be improve.
Mode: It can be clearly said that value of mode in first case is 2 and in the second question it
determines at the one. It indicates that most of the students are repeated on the second option that
is agree where they satisfy with the knowledge of education provided by UKCBC to them. On
the other side in the second condition it can be said that the students are often select option one
by which they wants that college must need to improve way of education services.
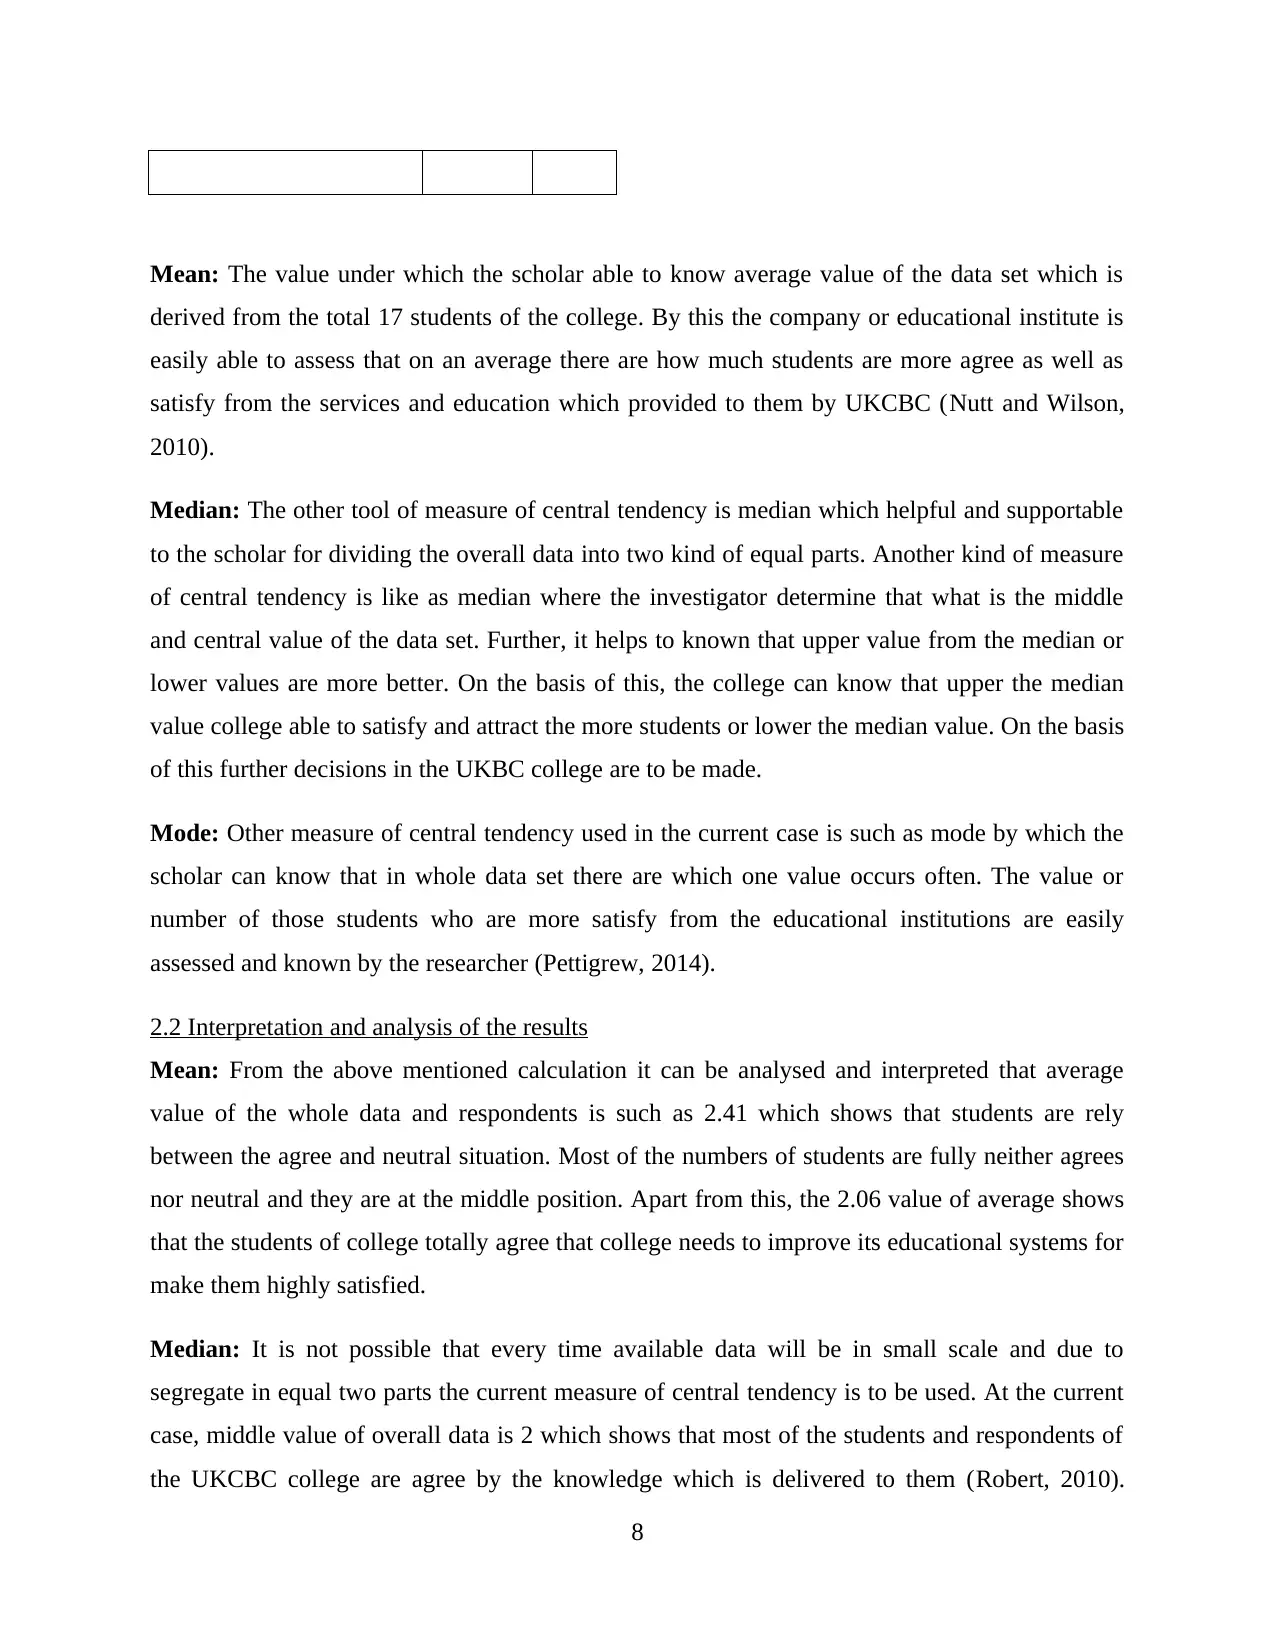
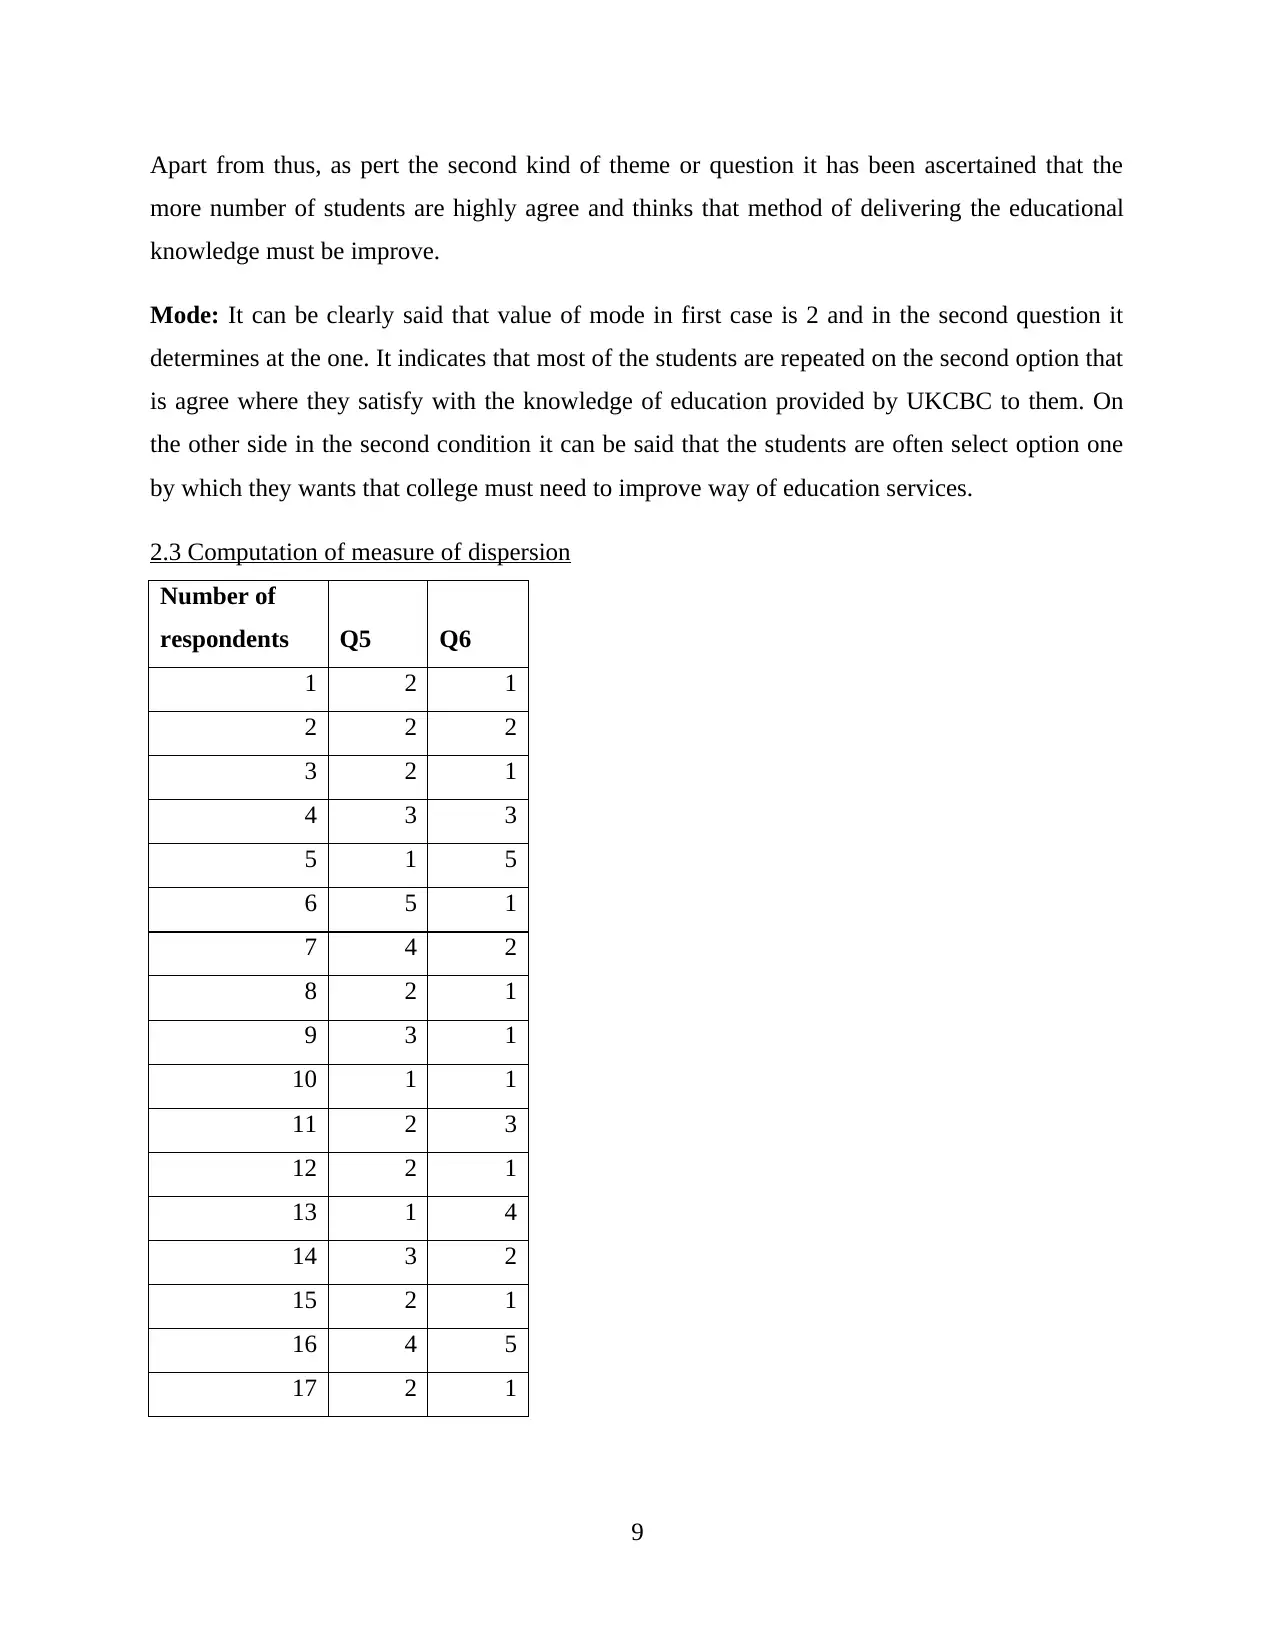
2.3 Computation of measure of dispersion
Number of
respondents Q5 Q6
1 2 1
2 2 2
3 2 1
4 3 3
5 1 5
6 5 1
7 4 2
8 2 1
9 3 1
10 1 1
11 2 3
12 2 1
13 1 4
14 3 2
15 2 1
16 4 5
17 2 1
9
more number of students are highly agree and thinks that method of delivering the educational
knowledge must be improve.
Mode: It can be clearly said that value of mode in first case is 2 and in the second question it
determines at the one. It indicates that most of the students are repeated on the second option that
is agree where they satisfy with the knowledge of education provided by UKCBC to them. On
the other side in the second condition it can be said that the students are often select option one
by which they wants that college must need to improve way of education services.
2.3 Computation of measure of dispersion
Number of
respondents Q5 Q6
1 2 1
2 2 2
3 2 1
4 3 3
5 1 5
6 5 1
7 4 2
8 2 1
9 3 1
10 1 1
11 2 3
12 2 1
13 1 4
14 3 2
15 2 1
16 4 5
17 2 1
9
⊘ This is a preview!⊘
Do you want full access?
Subscribe today to unlock all pages.
Trusted by 1+ million students worldwide
Standard
deviation 1.12 1.43
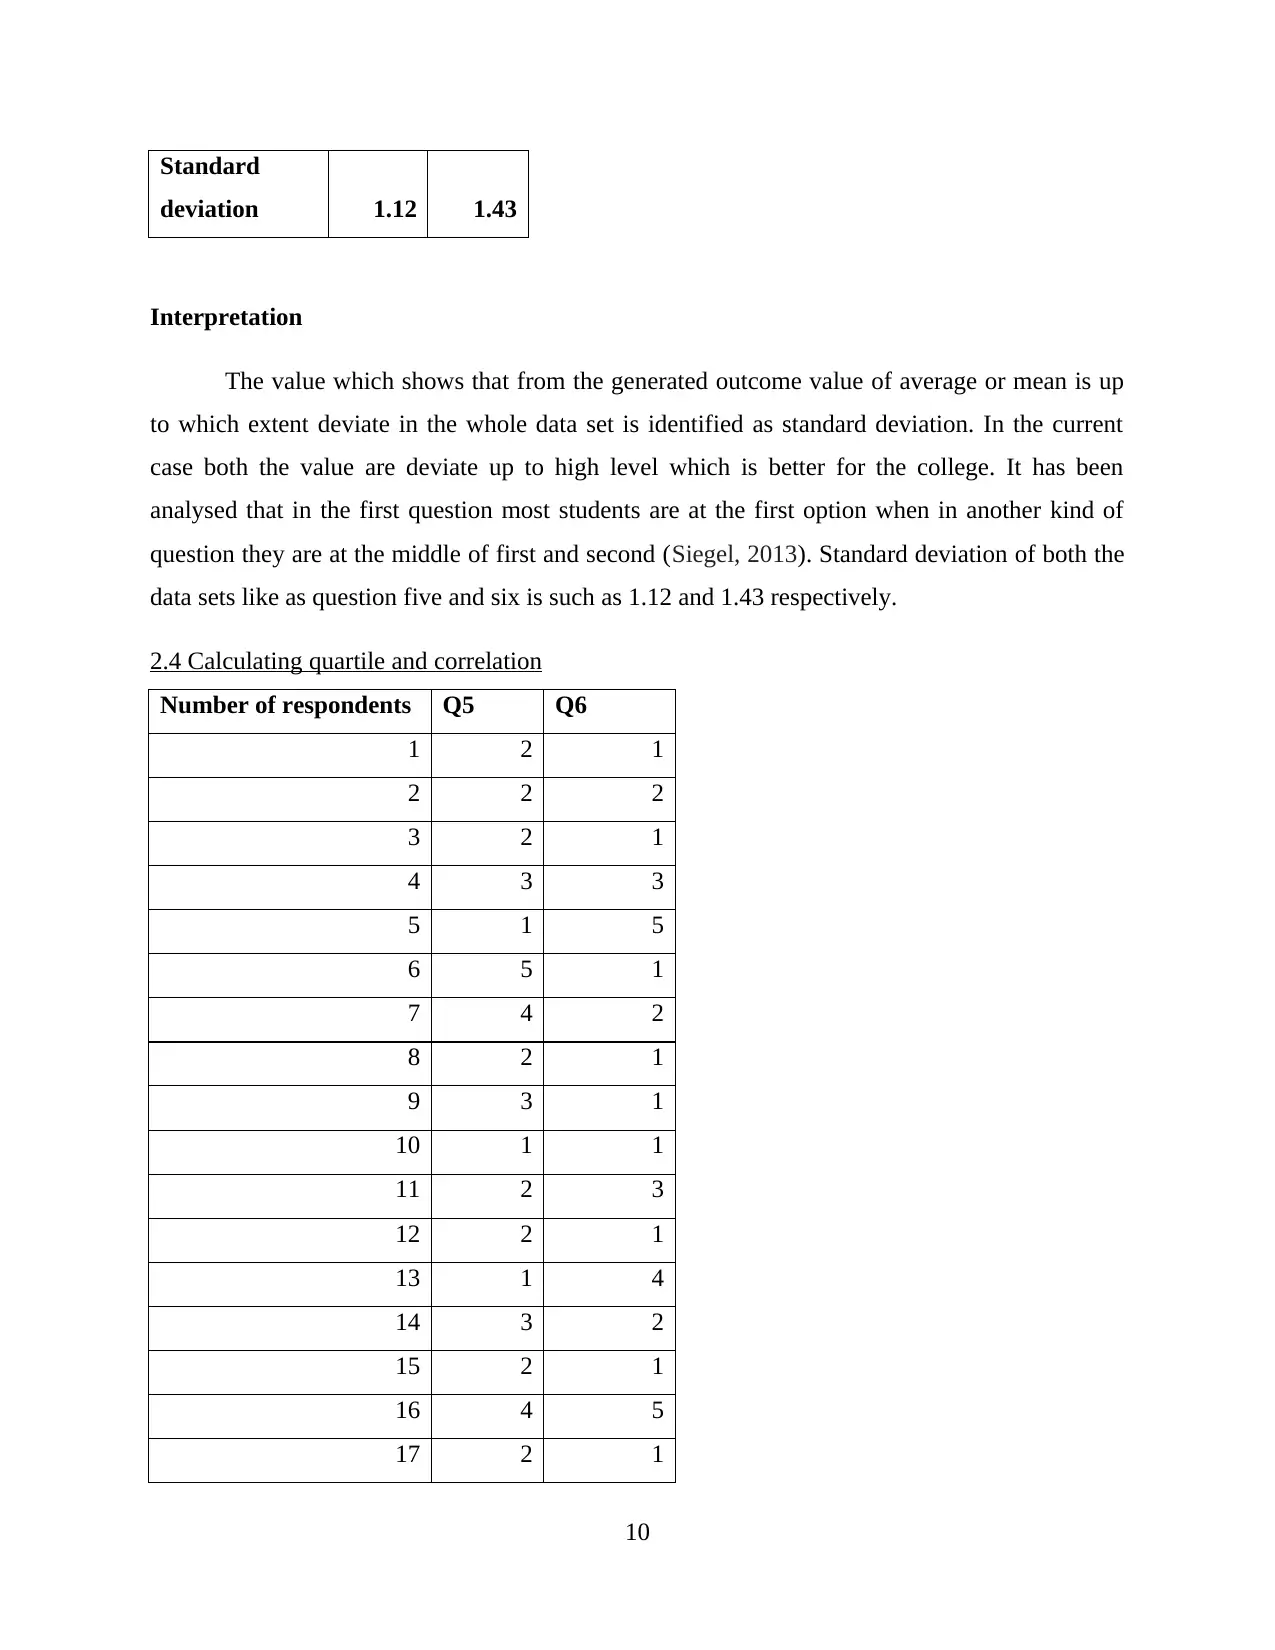
Interpretation
The value which shows that from the generated outcome value of average or mean is up
to which extent deviate in the whole data set is identified as standard deviation. In the current
case both the value are deviate up to high level which is better for the college. It has been
analysed that in the first question most students are at the first option when in another kind of
question they are at the middle of first and second (Siegel, 2013). Standard deviation of both the
data sets like as question five and six is such as 1.12 and 1.43 respectively.
2.4 Calculating quartile and correlation
Number of respondents Q5 Q6
1 2 1
2 2 2
3 2 1
4 3 3
5 1 5
6 5 1
7 4 2
8 2 1
9 3 1
10 1 1
11 2 3
12 2 1
13 1 4
14 3 2
15 2 1
16 4 5
17 2 1
10
deviation 1.12 1.43
Interpretation
The value which shows that from the generated outcome value of average or mean is up
to which extent deviate in the whole data set is identified as standard deviation. In the current
case both the value are deviate up to high level which is better for the college. It has been
analysed that in the first question most students are at the first option when in another kind of
question they are at the middle of first and second (Siegel, 2013). Standard deviation of both the
data sets like as question five and six is such as 1.12 and 1.43 respectively.
2.4 Calculating quartile and correlation
Number of respondents Q5 Q6
1 2 1
2 2 2
3 2 1
4 3 3
5 1 5
6 5 1
7 4 2
8 2 1
9 3 1
10 1 1
11 2 3
12 2 1
13 1 4
14 3 2
15 2 1
16 4 5
17 2 1
10
Paraphrase This Document
Need a fresh take? Get an instant paraphrase of this document with our AI Paraphraser
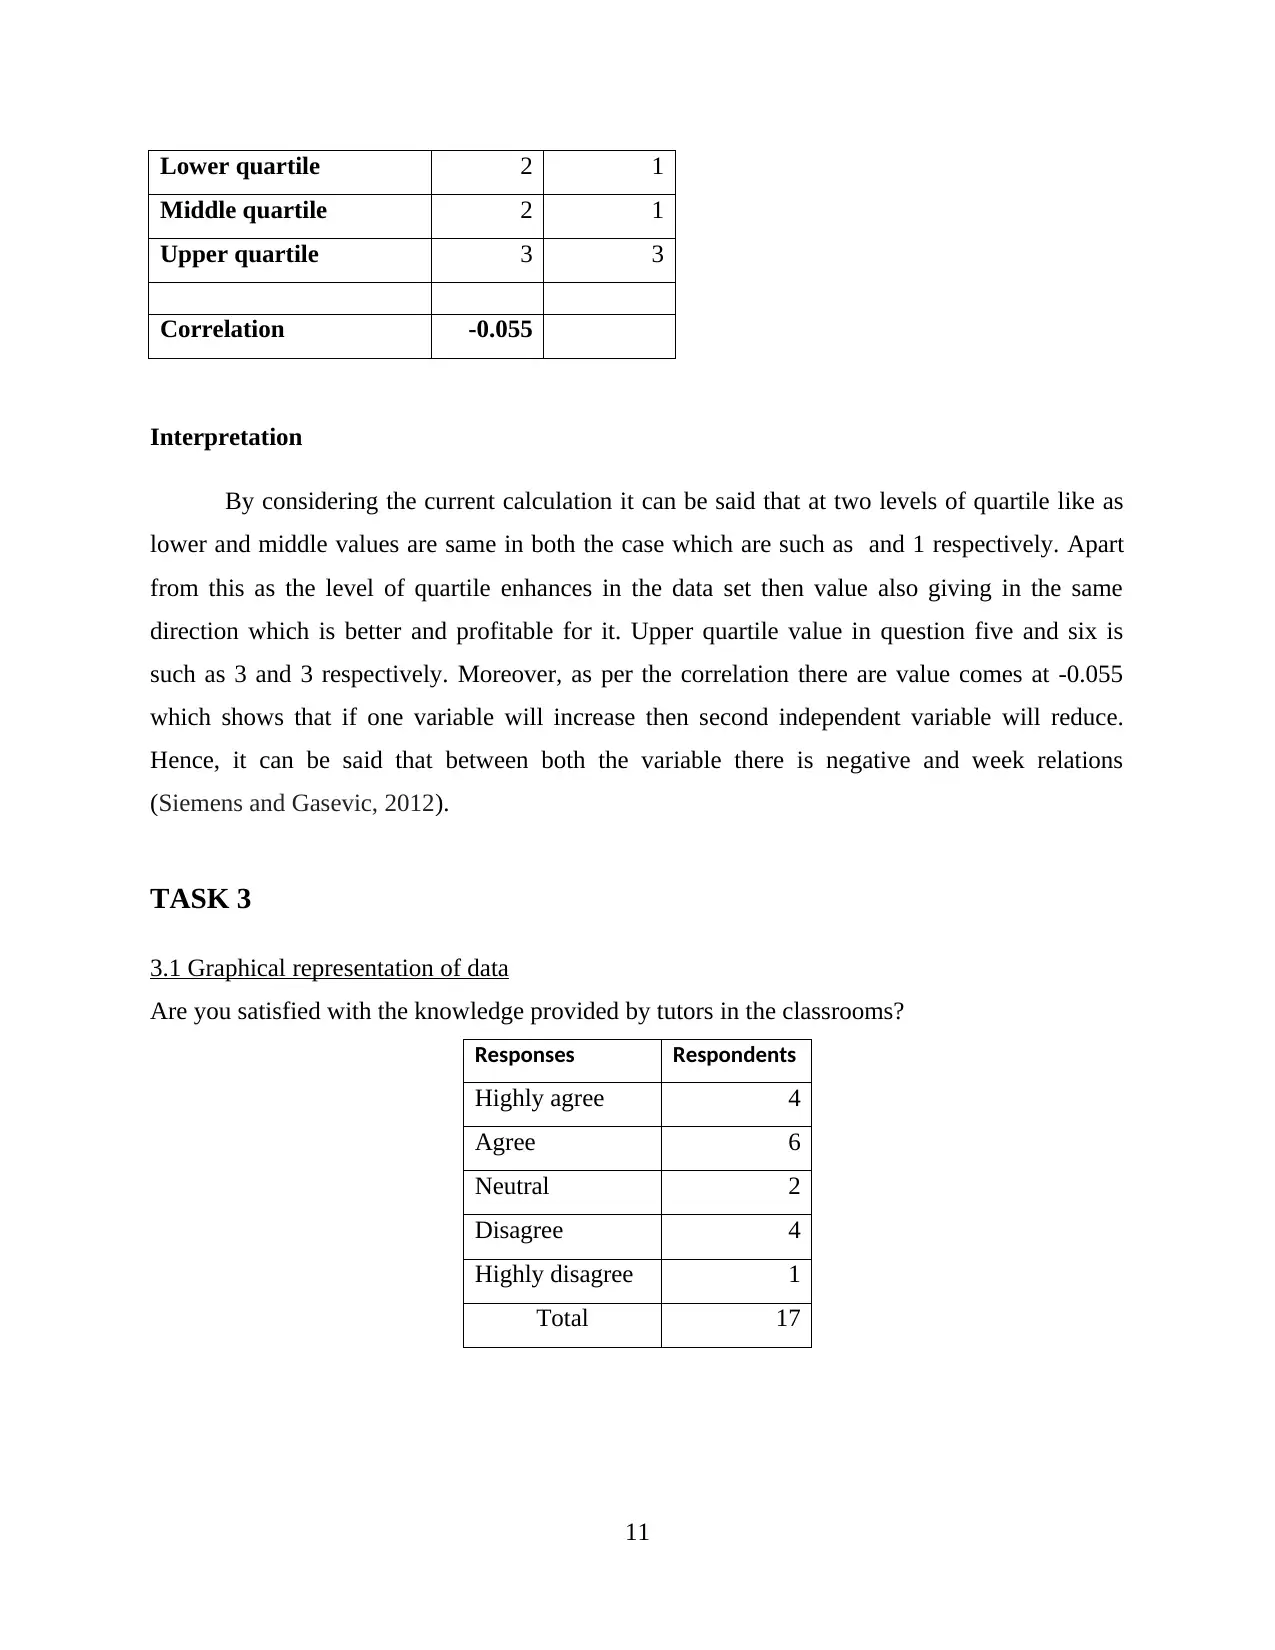
Lower quartile 2 1
Middle quartile 2 1
Upper quartile 3 3
Correlation -0.055
Interpretation
By considering the current calculation it can be said that at two levels of quartile like as
lower and middle values are same in both the case which are such as and 1 respectively. Apart
from this as the level of quartile enhances in the data set then value also giving in the same
direction which is better and profitable for it. Upper quartile value in question five and six is
such as 3 and 3 respectively. Moreover, as per the correlation there are value comes at -0.055
which shows that if one variable will increase then second independent variable will reduce.
Hence, it can be said that between both the variable there is negative and week relations
(Siemens and Gasevic, 2012).
TASK 3
3.1 Graphical representation of data
Are you satisfied with the knowledge provided by tutors in the classrooms?
Responses Respondents
Highly agree 4
Agree 6
Neutral 2
Disagree 4
Highly disagree 1
Total 17
11
Highly agree Agree Neutral Disagree Highly
disagree
0
1
2
3
4
5
6
7
8
5
7
2 2
1
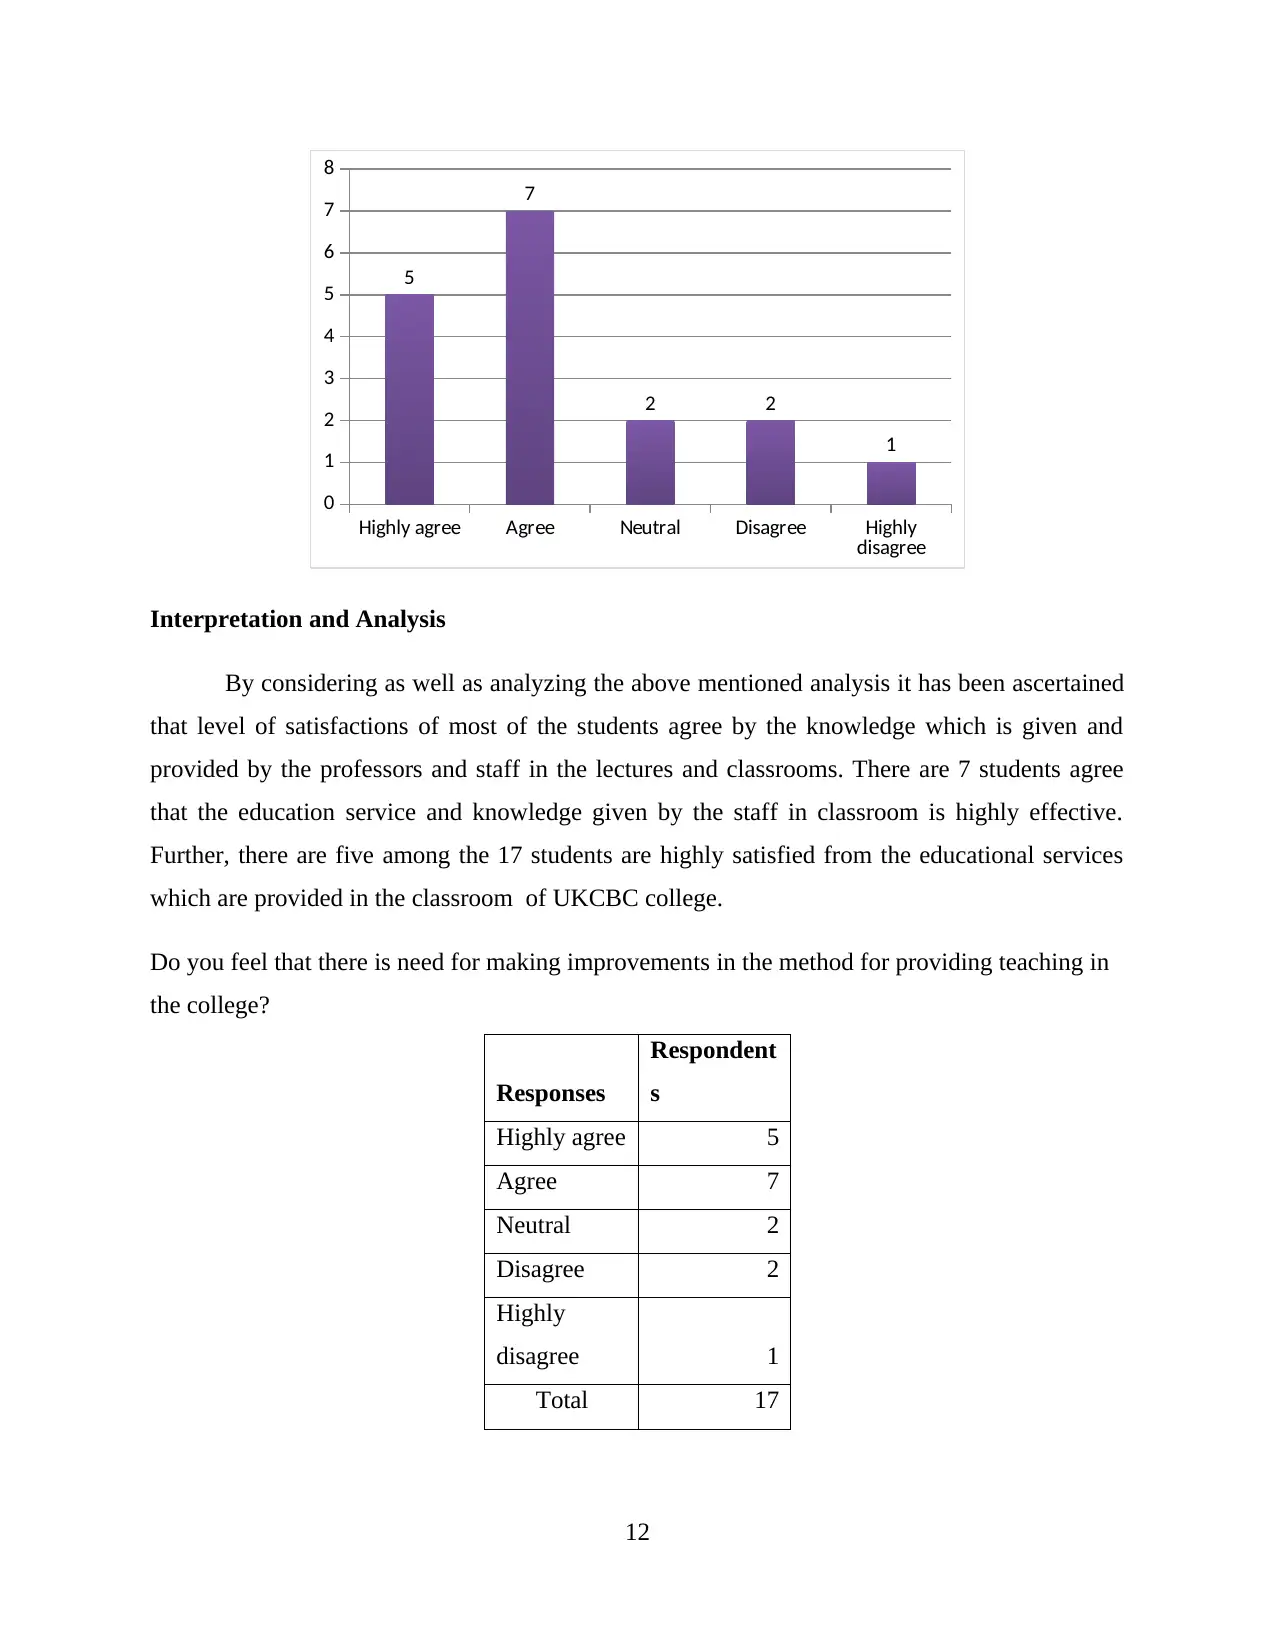
Interpretation and Analysis
By considering as well as analyzing the above mentioned analysis it has been ascertained
that level of satisfactions of most of the students agree by the knowledge which is given and
provided by the professors and staff in the lectures and classrooms. There are 7 students agree
that the education service and knowledge given by the staff in classroom is highly effective.
Further, there are five among the 17 students are highly satisfied from the educational services
which are provided in the classroom of UKCBC college.
Do you feel that there is need for making improvements in the method for providing teaching in
the college?
Responses
Respondent
s
Highly agree 5
Agree 7
Neutral 2
Disagree 2
Highly
disagree 1
Total 17
12
disagree
0
1
2
3
4
5
6
7
8
5
7
2 2
1
Interpretation and Analysis
By considering as well as analyzing the above mentioned analysis it has been ascertained
that level of satisfactions of most of the students agree by the knowledge which is given and
provided by the professors and staff in the lectures and classrooms. There are 7 students agree
that the education service and knowledge given by the staff in classroom is highly effective.
Further, there are five among the 17 students are highly satisfied from the educational services
which are provided in the classroom of UKCBC college.
Do you feel that there is need for making improvements in the method for providing teaching in
the college?
Responses
Respondent
s
Highly agree 5
Agree 7
Neutral 2
Disagree 2
Highly
disagree 1
Total 17
12
⊘ This is a preview!⊘
Do you want full access?
Subscribe today to unlock all pages.
Trusted by 1+ million students worldwide
1 out of 21
Related Documents


Your All-in-One AI-Powered Toolkit for Academic Success.
+13062052269
info@desklib.com
Available 24*7 on WhatsApp / Email
![[object Object]](/_next/static/media/star-bottom.7253800d.svg)
Unlock your academic potential
Copyright © 2020–2026 A2Z Services. All Rights Reserved. Developed and managed by ZUCOL.