Business Performance Data Analysis and Financial Statement Report
VerifiedAdded on 2021/02/16
|16
|3842
|138
Report
AI Summary
This report presents an analysis of data collection methods and financial statements to assess a company's performance. It begins by outlining a plan for collecting primary and secondary data, including the use of surveys, questionnaires, and sampling techniques. The report details the creation of closed and open-ended questionnaires and the application of systematic and random sampling. Data collected on advertising expenditure and food sales is then analyzed using mean, median, mode, range, quartiles, and correlation coefficients. Findings are summarized, comparing advertising expenditure and sales revenue, and the impact of marketing expenses. The second part of the report explains and interprets financial statements, including the statement of financial position, income statement, statement of cash flow, and statement of changes in equity. It also compares different financial statement formats and their appropriateness for various business types, such as sole proprietorships, partnerships, and companies. This report provides a comprehensive overview of data analysis and financial reporting, offering insights into business performance and financial statement analysis.
Introduction:
The company’s managers have one of the main responsibility which is based in the
decisions which they needed to take for the operating activities of t company. the effective
decisions making is directly depends on the skills and the capabilities of the mangers of the
company. As there are diverse methods which could be use by the management of company
for collecting the information and data. The method selection for collecting the information is
one of the critical context for conducting research et key focus must be to select that source of
the information by which the reliable and accurate information could be collected by the
researcher. This is one of the assignments in the analysis of the data collection an assessing
the company’s performance during the period.
Task 1
1.1 Create a plan to collect primary and secondary data
Primary and secondary data
The primary source of the information are those sources which are used when new
information by conducting the researcher by the researcher himself. As under this source of
information the information is collected from the start so mostly interviews, surveys and
questionnaire are used for collecting the information directly form the people; Ass it is t fact that
when the relationship with the people is good than by primary source good information could be
achieve by the management of the company.
It is the fact that when the primary source is considering than the main objective of the
researcher is to carry out some research topic so the questionnaire and questions in the
interviews form the people must be formulate according to the main topic to collect as much
information as possible.
The second source of the information during the research is the secondary source such
as the Magazines and the journals, articles, websites and book knowledge are all the h
secondary sources of the information. the main benefit and objective of the secondary source is
that these sources of the information is written down by the researcher in the past.
Paraphrase This Document
Need a fresh take? Get an instant paraphrase of this document with our AI Paraphraser
1.2 Choose appropriate survey methods, sampling techniques and questionnaires
The survey is one of the main tool of primary sources for collecting the information about the
perception and thinking of the people of the society about the produces and services regarding
which the research is conducting. The survey for this research is based on the creation of the
proper planning which includes all the directional guideline by which the goals and objective will
be achieve and the activities will be carry out. the behavior of the people, the attitude and the
opinion of the people are some of the important aspects which are kept in mind when the
survey is carry out. the process of the surveys is than includes the collection of the of the
information by using the above source of the information.
As mentioned already that both the primary and secondary source have been used for the
research under consideration. the journals and the Magazines are some of the main source of
the information use under the secondary source of the information while in contrast to it the
primary sources which are using in the research includes the surveys and the interviews. A set
of questionnaire is created and develop by the researcher to ask descent and needed
questions form the respondents.
Sampling Technique
As it is very important for the researcher to consider the whole population for carrying
and completing the research with affective and attractive findings. So, the for attractive and
required finding the Systematic and random sampling is used this research process. The
systematic research techniques for the sampling is based on the selection of the point by
selecting the larger are of the population while in contrast to it the random sampling technique is
based on the selection of some people form whole population in such a way that every groups
selected have an equal chance to be selected.
Questionnaire
The questions asked under the questionnaire technique of the data is based on the selection
of the proper questionnaire which need to be ask form the respondents and participants and
questionnaire are than distributed to the respondents to take the feedback from the people.
When the whole process is completed and all the feedback is collected than the assessment is
carry out by evaluating the feedback of the people.
Te list of the questionnaire used in this research includes some of the following questions:
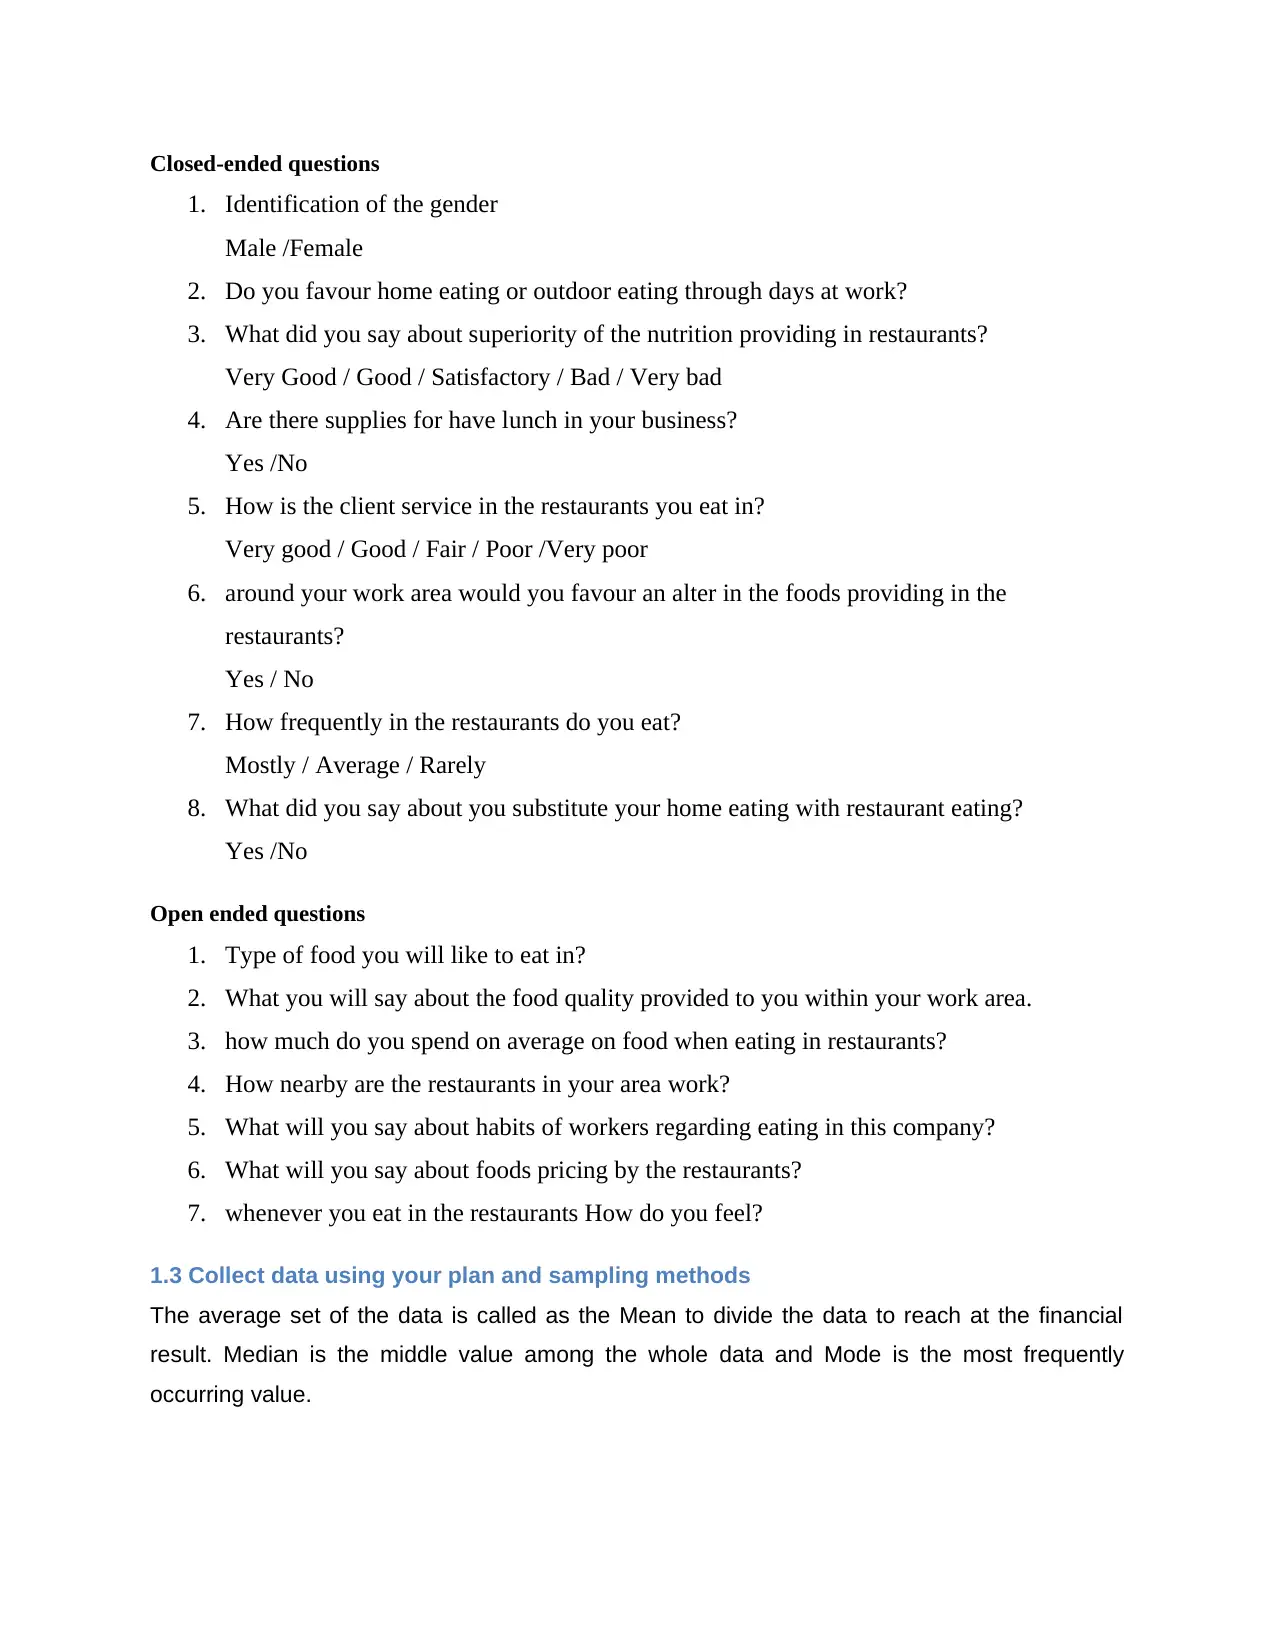
Closed-ended questions
1. Identification of the gender
Male /Female
2. Do you favour home eating or outdoor eating through days at work?
3. What did you say about superiority of the nutrition providing in restaurants?
Very Good / Good / Satisfactory / Bad / Very bad
4. Are there supplies for have lunch in your business?
Yes /No
5. How is the client service in the restaurants you eat in?
Very good / Good / Fair / Poor /Very poor
6. around your work area would you favour an alter in the foods providing in the
restaurants?
Yes / No
7. How frequently in the restaurants do you eat?
Mostly / Average / Rarely
8. What did you say about you substitute your home eating with restaurant eating?
Yes /No
Open ended questions
1. Type of food you will like to eat in?
2. What you will say about the food quality provided to you within your work area.
3. how much do you spend on average on food when eating in restaurants?
4. How nearby are the restaurants in your area work?
5. What will you say about habits of workers regarding eating in this company?
6. What will you say about foods pricing by the restaurants?
7. whenever you eat in the restaurants How do you feel?
1.3 Collect data using your plan and sampling methods
The average set of the data is called as the Mean to divide the data to reach at the financial
result. Median is the middle value among the whole data and Mode is the most frequently
occurring value.
⊘ This is a preview!⊘
Do you want full access?
Subscribe today to unlock all pages.
Trusted by 1+ million students worldwide
Year
Advertising expenditure
(£’000) Food sales (£’000)
2007 25 120
2008 28 150
2009 30 170
2010 26 190
2011 27 210
2012 25 230
2013 22 200
mean 26.14285714 181.4285714
mode 25 #N/A
median 26 190
Range 8 110
Quartile 1 25 160
Quartile 2 26 190
Quartile 3 27.5 205
Inter-quartile range 2.5 45
standard deviation 2.544836041 37.60699023
Correlation coefficient -0.246296092
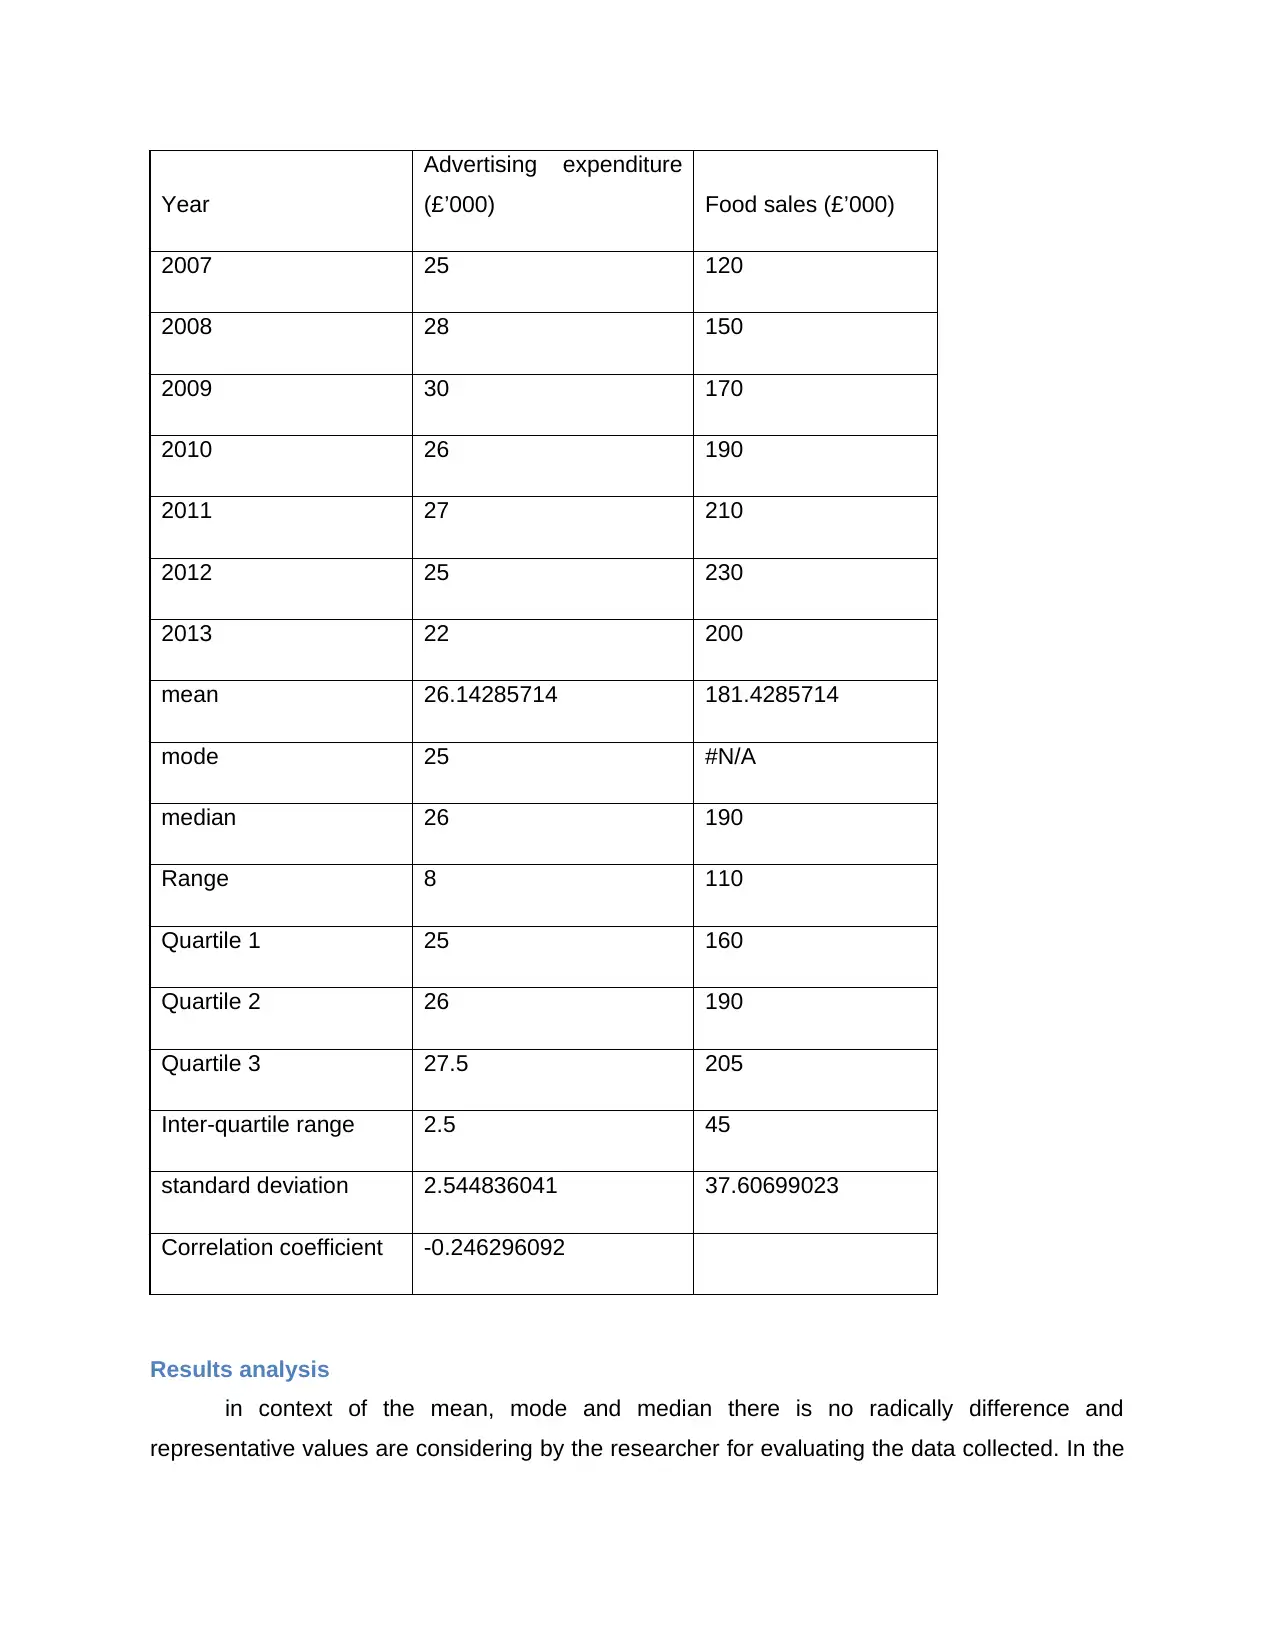
Results analysis
in context of the mean, mode and median there is no radically difference and
representative values are considering by the researcher for evaluating the data collected. In the
Advertising expenditure
(£’000) Food sales (£’000)
2007 25 120
2008 28 150
2009 30 170
2010 26 190
2011 27 210
2012 25 230
2013 22 200
mean 26.14285714 181.4285714
mode 25 #N/A
median 26 190
Range 8 110
Quartile 1 25 160
Quartile 2 26 190
Quartile 3 27.5 205
Inter-quartile range 2.5 45
standard deviation 2.544836041 37.60699023
Correlation coefficient -0.246296092
Results analysis
in context of the mean, mode and median there is no radically difference and
representative values are considering by the researcher for evaluating the data collected. In the
Paraphrase This Document
Need a fresh take? Get an instant paraphrase of this document with our AI Paraphraser
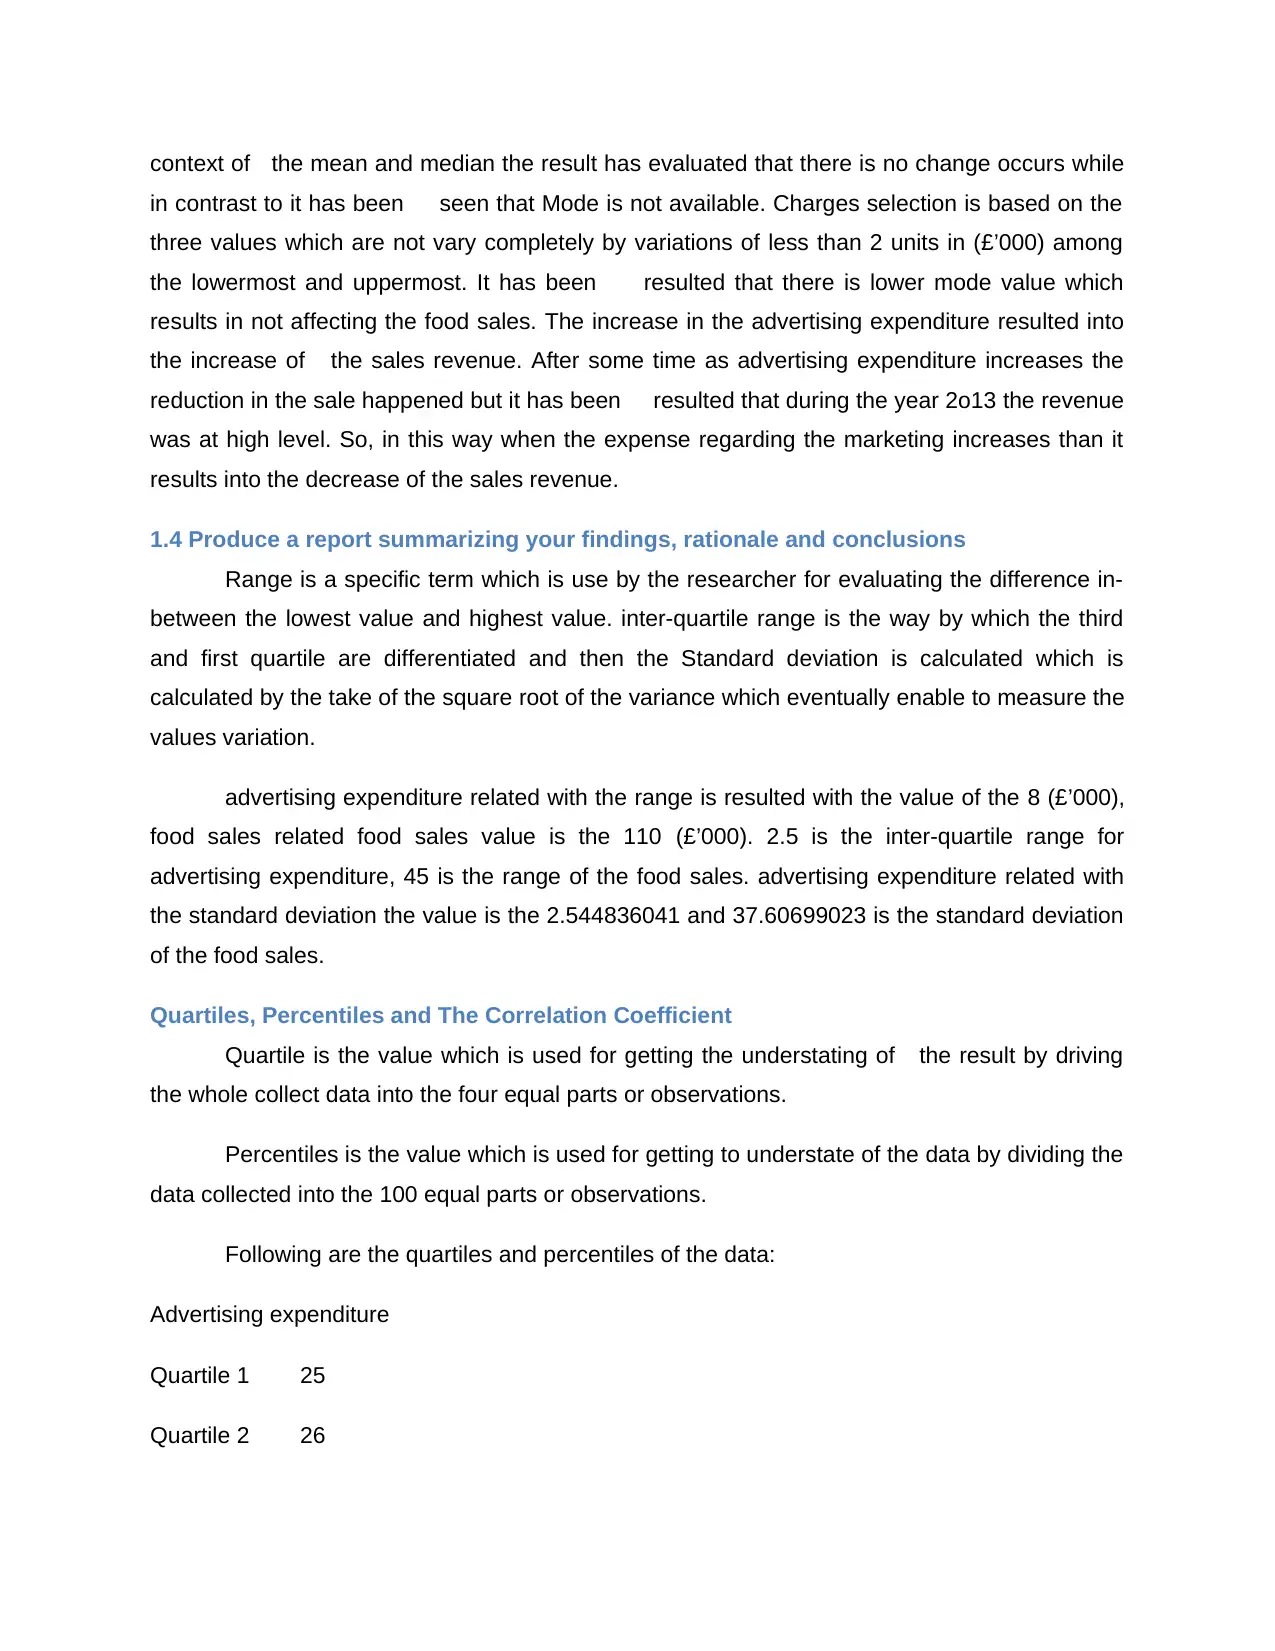
context of the mean and median the result has evaluated that there is no change occurs while
in contrast to it has been seen that Mode is not available. Charges selection is based on the
three values which are not vary completely by variations of less than 2 units in (£’000) among
the lowermost and uppermost. It has been resulted that there is lower mode value which
results in not affecting the food sales. The increase in the advertising expenditure resulted into
the increase of the sales revenue. After some time as advertising expenditure increases the
reduction in the sale happened but it has been resulted that during the year 2o13 the revenue
was at high level. So, in this way when the expense regarding the marketing increases than it
results into the decrease of the sales revenue.
1.4 Produce a report summarizing your findings, rationale and conclusions
Range is a specific term which is use by the researcher for evaluating the difference in-
between the lowest value and highest value. inter-quartile range is the way by which the third
and first quartile are differentiated and then the Standard deviation is calculated which is
calculated by the take of the square root of the variance which eventually enable to measure the
values variation.
advertising expenditure related with the range is resulted with the value of the 8 (£’000),
food sales related food sales value is the 110 (£’000). 2.5 is the inter-quartile range for
advertising expenditure, 45 is the range of the food sales. advertising expenditure related with
the standard deviation the value is the 2.544836041 and 37.60699023 is the standard deviation
of the food sales.
Quartiles, Percentiles and The Correlation Coefficient
Quartile is the value which is used for getting the understating of the result by driving
the whole collect data into the four equal parts or observations.
Percentiles is the value which is used for getting to understate of the data by dividing the
data collected into the 100 equal parts or observations.
Following are the quartiles and percentiles of the data:
Advertising expenditure
Quartile 1 25
Quartile 2 26
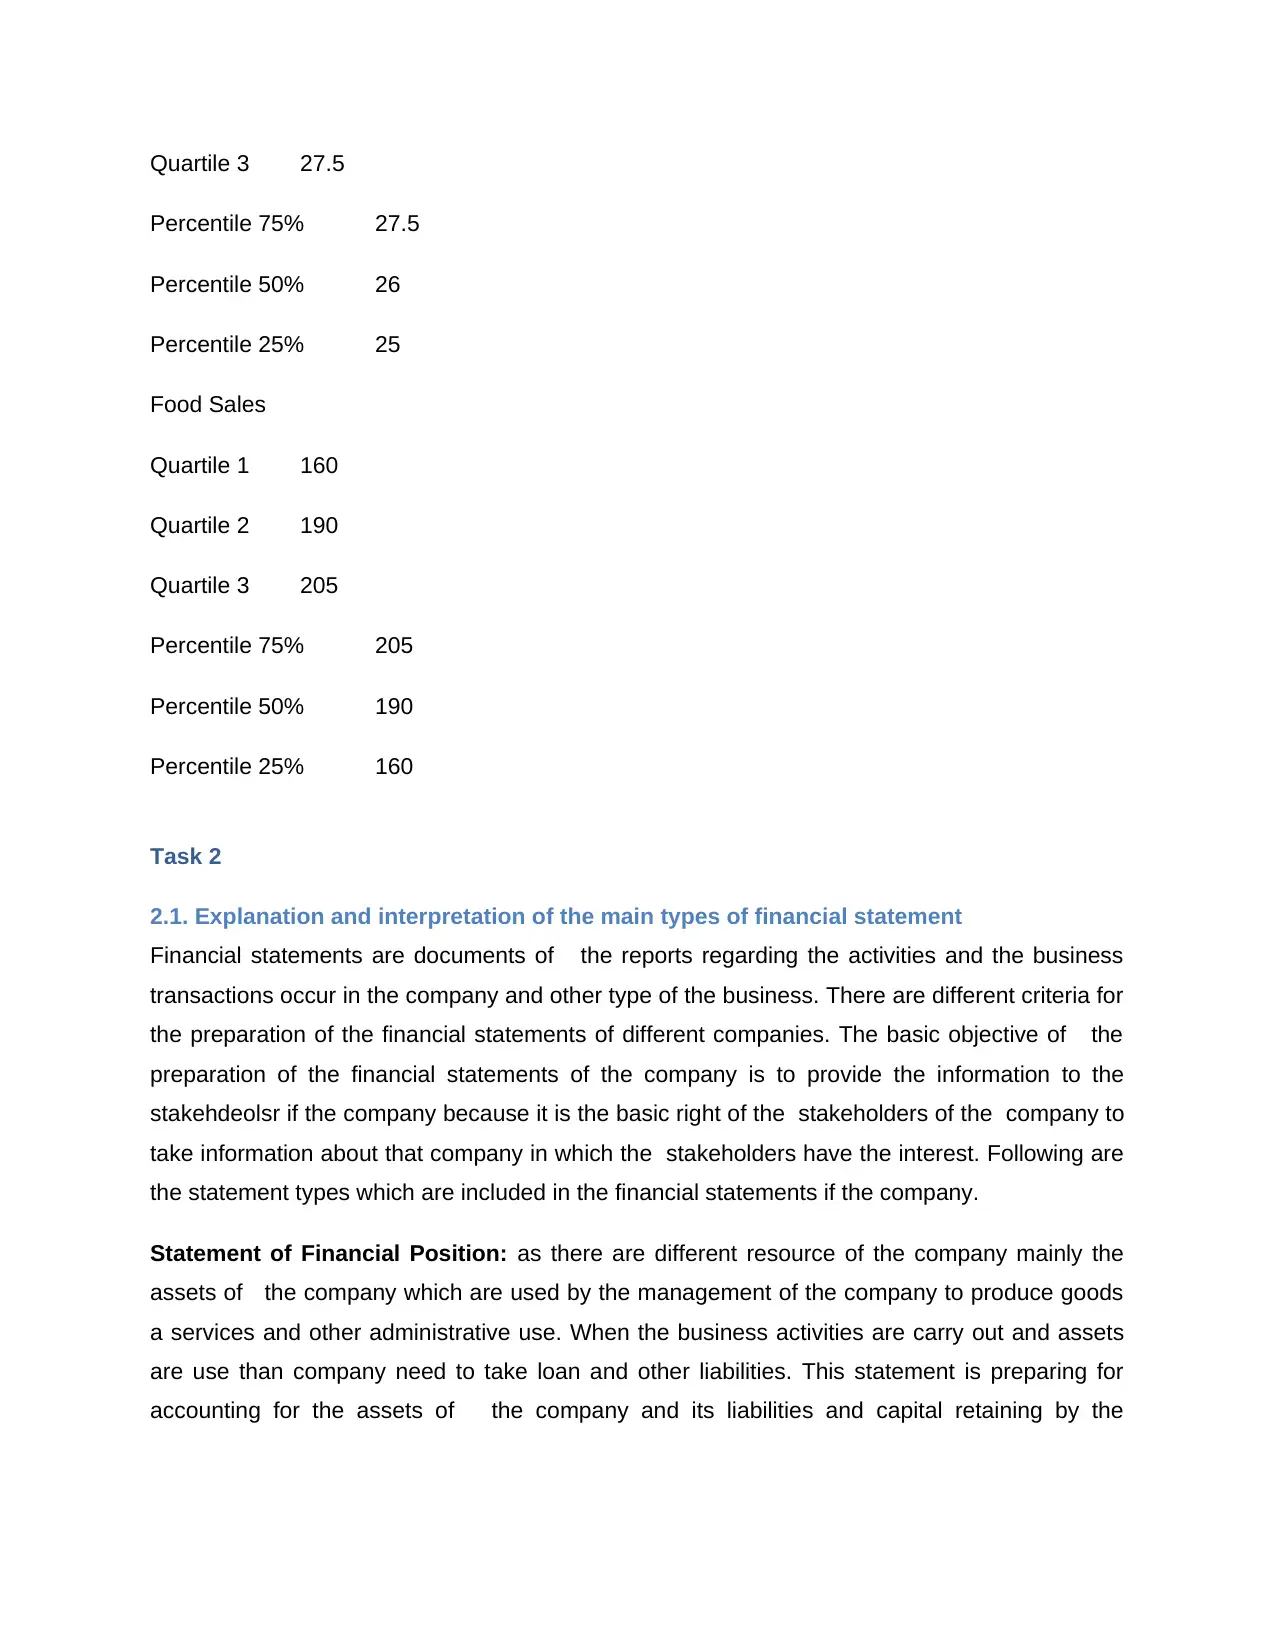
Quartile 3 27.5
Percentile 75% 27.5
Percentile 50% 26
Percentile 25% 25
Food Sales
Quartile 1 160
Quartile 2 190
Quartile 3 205
Percentile 75% 205
Percentile 50% 190
Percentile 25% 160
Task 2
2.1. Explanation and interpretation of the main types of financial statement
Financial statements are documents of the reports regarding the activities and the business
transactions occur in the company and other type of the business. There are different criteria for
the preparation of the financial statements of different companies. The basic objective of the
preparation of the financial statements of the company is to provide the information to the
stakehdeolsr if the company because it is the basic right of the stakeholders of the company to
take information about that company in which the stakeholders have the interest. Following are
the statement types which are included in the financial statements if the company.
Statement of Financial Position: as there are different resource of the company mainly the
assets of the company which are used by the management of the company to produce goods
a services and other administrative use. When the business activities are carry out and assets
are use than company need to take loan and other liabilities. This statement is preparing for
accounting for the assets of the company and its liabilities and capital retaining by the
⊘ This is a preview!⊘
Do you want full access?
Subscribe today to unlock all pages.
Trusted by 1+ million students worldwide
company during the period. The international accounting standards format is follow by the
management when preparing the financial statements of the company.
Income Statement: financial performance in terms of the net profit or loss is represented by
the management by the management by preparing the income statement according to the
required framework. Income statement is based on two main aspect which are the income
generated by the company and the expenses incurred by the company.
Statement of cash flow: cash is one of the important assets of the company so the
accounting standards require a separate segment for showing the inflow and outflows of the
cash incur in the company, This statement is based on the provision of separate information
about the cash generate by the operational activities, cash generated by the investing activities
and cash generated by the financial activities of the company.
statement of changes in equity: the investors of the company always want to know about the
equity and the change of the equity occur during the period. The statement which show the
results incur in the form of the change sin equity is known as the statement of the change sin
equity.
2.2. Comparison of different formats of financial statements and their appropriateness for
different types of business
There diverse forms of the conduction of the business such as sole trade business, partnership
business and the company. so, it is important to noted that there is different format for all type of
the businesses. All the businesses need to prepare the financial statements according to the
accepted format. sole trader business have no legal requirement to prepare the financial
statements so the format of the financial statements of the sole trade business are simple but
the company point of view thee are certain rule which need to be follow o prepare the financial
statements of the company.
Financial Statements by Information Type
as far as the type of the financial statement in the prospect of the information is concern than
the statements of the financial position of the company give an overview about the way by
which the assets are used by the company in order to produce the products and services for the
customers and the way by which the liabilities are paid by the management and retain capital of
the company during the period. The income statement is a statement by which the information
regarding the amount of income generated by the company by paying out the expenses of the
company during the reporting period.
Paraphrase This Document
Need a fresh take? Get an instant paraphrase of this document with our AI Paraphraser
The investors can take the information about the change which have occurred during the year in
respect of the equity is the statement of the change sin equity help the investors to understand
the level and fluctuations of equity.
Financial Statements by GAAP Type
the rules and the principle about the preparation of the financial statements of the company is
cover by the GAAP which must need to be consider by the management while preparing the
financial statement of the company. the rules given by the GAAP are every important because
of the fact that the financial statement prepare by the managers which is called as the internal
financial statements are not consider as accurate by certain stakehdeolsr so the preparation of
the financial statement under the context of the principles of the GAAP is important.
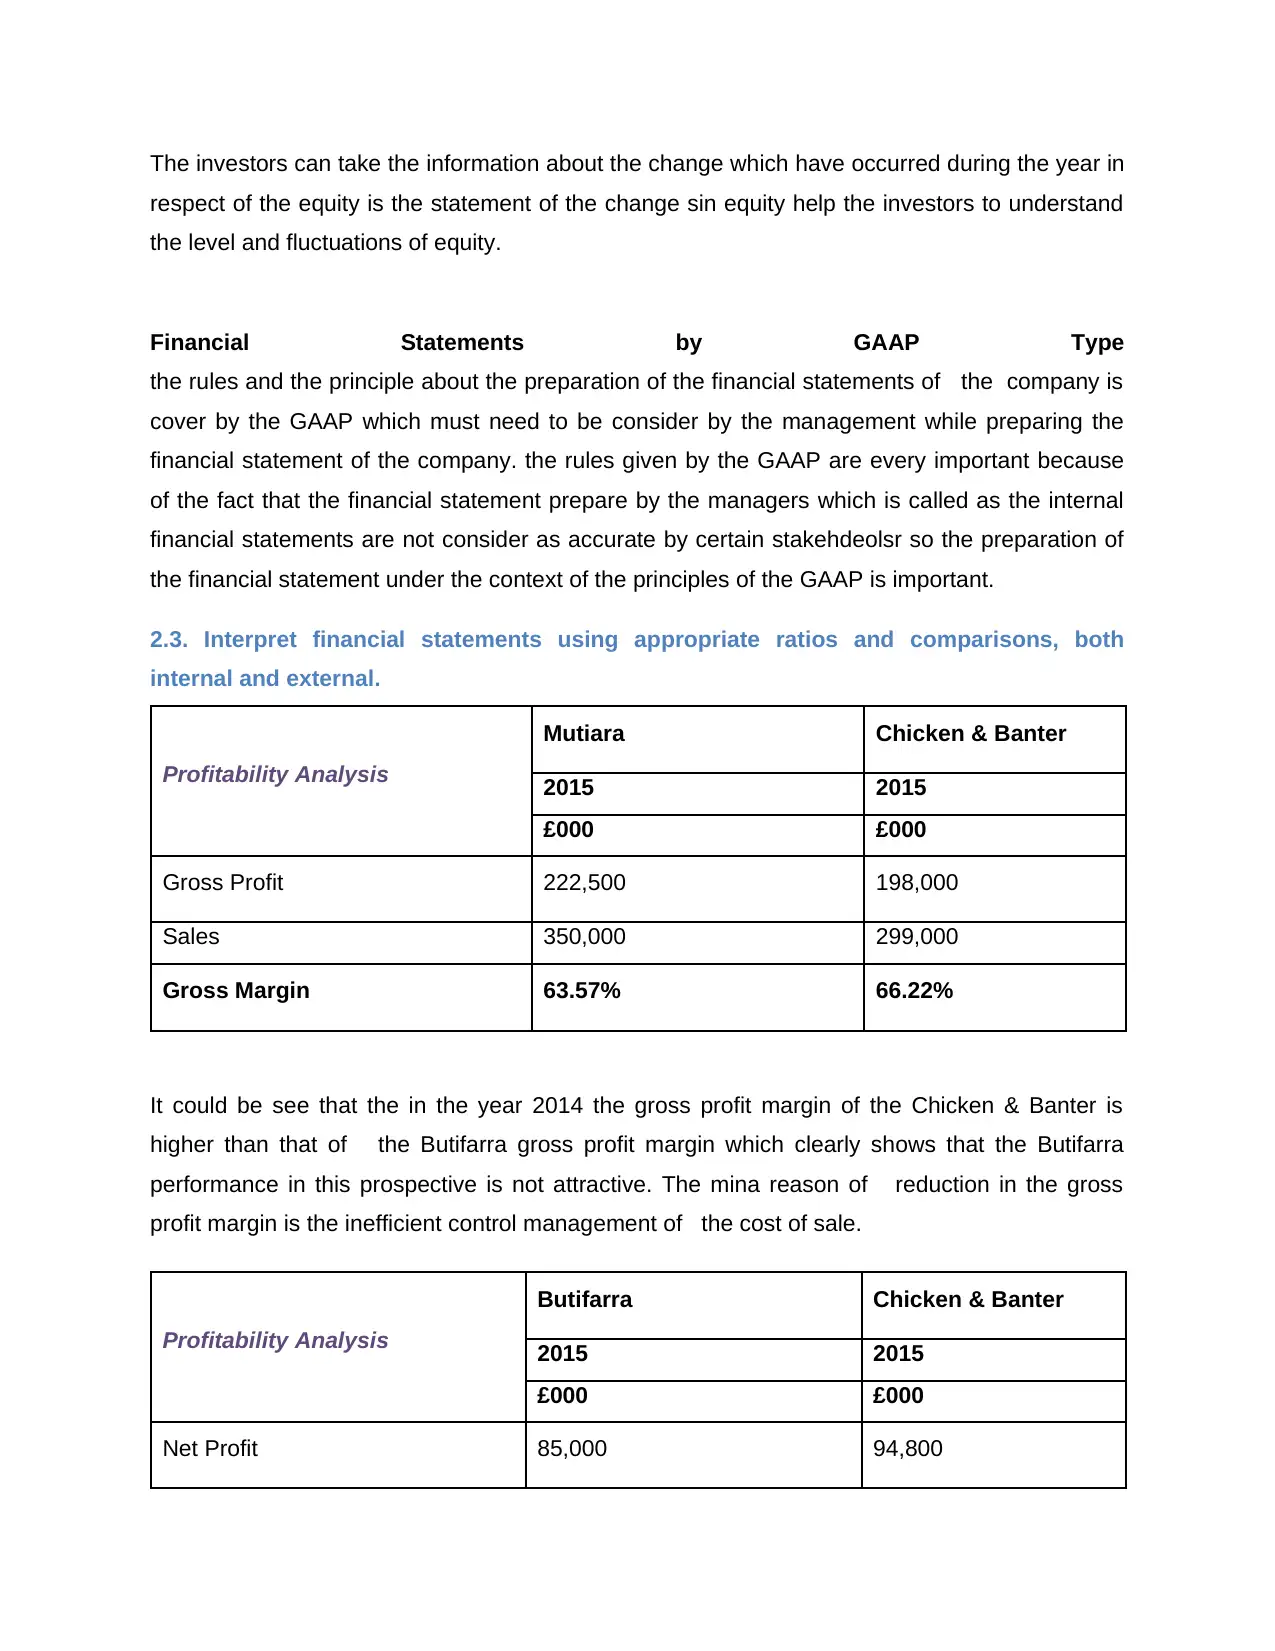
2.3. Interpret financial statements using appropriate ratios and comparisons, both
internal and external.
Profitability Analysis
Mutiara Chicken & Banter
2015 2015
£000 £000
Gross Profit 222,500 198,000
Sales 350,000 299,000
Gross Margin 63.57% 66.22%
It could be see that the in the year 2014 the gross profit margin of the Chicken & Banter is
higher than that of the Butifarra gross profit margin which clearly shows that the Butifarra
performance in this prospective is not attractive. The mina reason of reduction in the gross
profit margin is the inefficient control management of the cost of sale.
Profitability Analysis
Butifarra Chicken & Banter
2015 2015
£000 £000
Net Profit 85,000 94,800
respect of the equity is the statement of the change sin equity help the investors to understand
the level and fluctuations of equity.
Financial Statements by GAAP Type
the rules and the principle about the preparation of the financial statements of the company is
cover by the GAAP which must need to be consider by the management while preparing the
financial statement of the company. the rules given by the GAAP are every important because
of the fact that the financial statement prepare by the managers which is called as the internal
financial statements are not consider as accurate by certain stakehdeolsr so the preparation of
the financial statement under the context of the principles of the GAAP is important.
2.3. Interpret financial statements using appropriate ratios and comparisons, both
internal and external.
Profitability Analysis
Mutiara Chicken & Banter
2015 2015
£000 £000
Gross Profit 222,500 198,000
Sales 350,000 299,000
Gross Margin 63.57% 66.22%
It could be see that the in the year 2014 the gross profit margin of the Chicken & Banter is
higher than that of the Butifarra gross profit margin which clearly shows that the Butifarra
performance in this prospective is not attractive. The mina reason of reduction in the gross
profit margin is the inefficient control management of the cost of sale.
Profitability Analysis
Butifarra Chicken & Banter
2015 2015
£000 £000
Net Profit 85,000 94,800
Sales 350,000 299,000
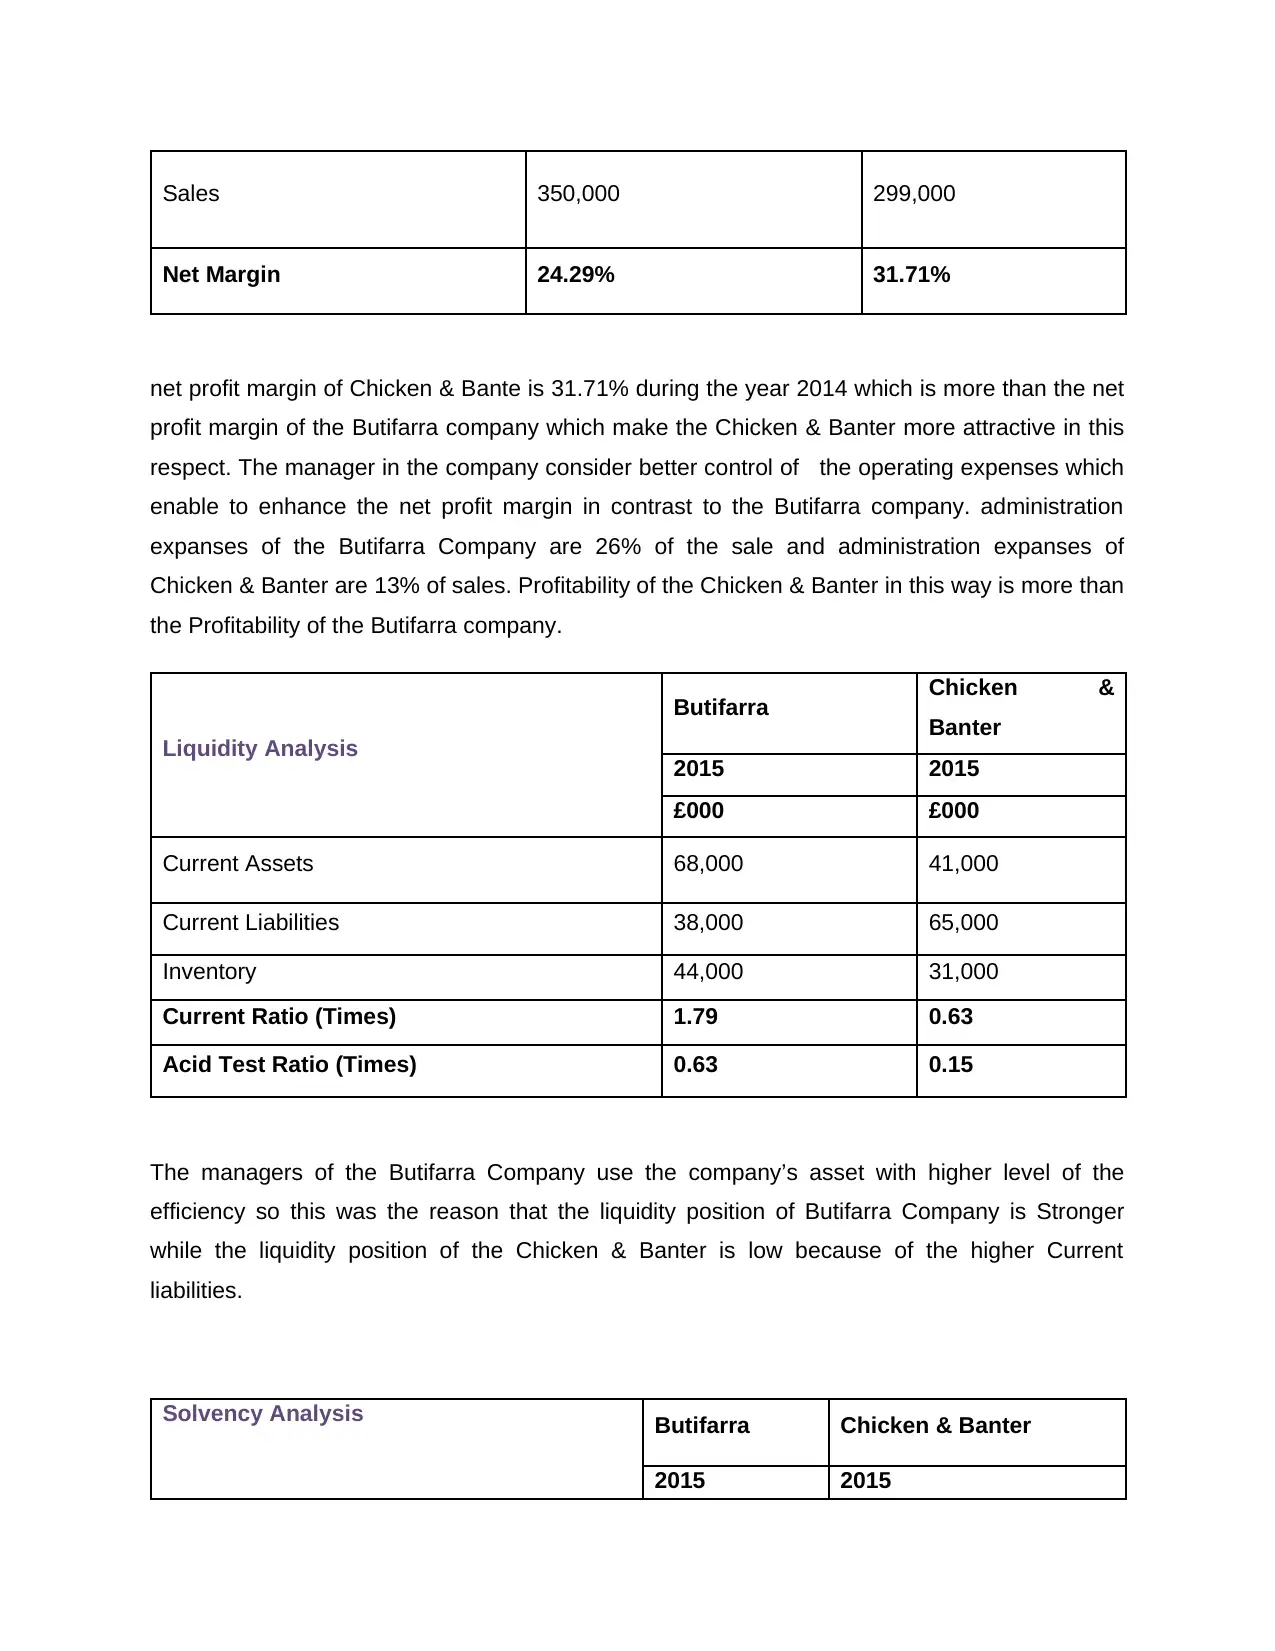
Net Margin 24.29% 31.71%
net profit margin of Chicken & Bante is 31.71% during the year 2014 which is more than the net
profit margin of the Butifarra company which make the Chicken & Banter more attractive in this
respect. The manager in the company consider better control of the operating expenses which
enable to enhance the net profit margin in contrast to the Butifarra company. administration
expanses of the Butifarra Company are 26% of the sale and administration expanses of
Chicken & Banter are 13% of sales. Profitability of the Chicken & Banter in this way is more than
the Profitability of the Butifarra company.
Liquidity Analysis
Butifarra Chicken &
Banter
2015 2015
£000 £000
Current Assets 68,000 41,000
Current Liabilities 38,000 65,000
Inventory 44,000 31,000
Current Ratio (Times) 1.79 0.63
Acid Test Ratio (Times) 0.63 0.15
The managers of the Butifarra Company use the company’s asset with higher level of the
efficiency so this was the reason that the liquidity position of Butifarra Company is Stronger
while the liquidity position of the Chicken & Banter is low because of the higher Current
liabilities.
Solvency Analysis Butifarra Chicken & Banter
2015 2015
⊘ This is a preview!⊘
Do you want full access?
Subscribe today to unlock all pages.
Trusted by 1+ million students worldwide
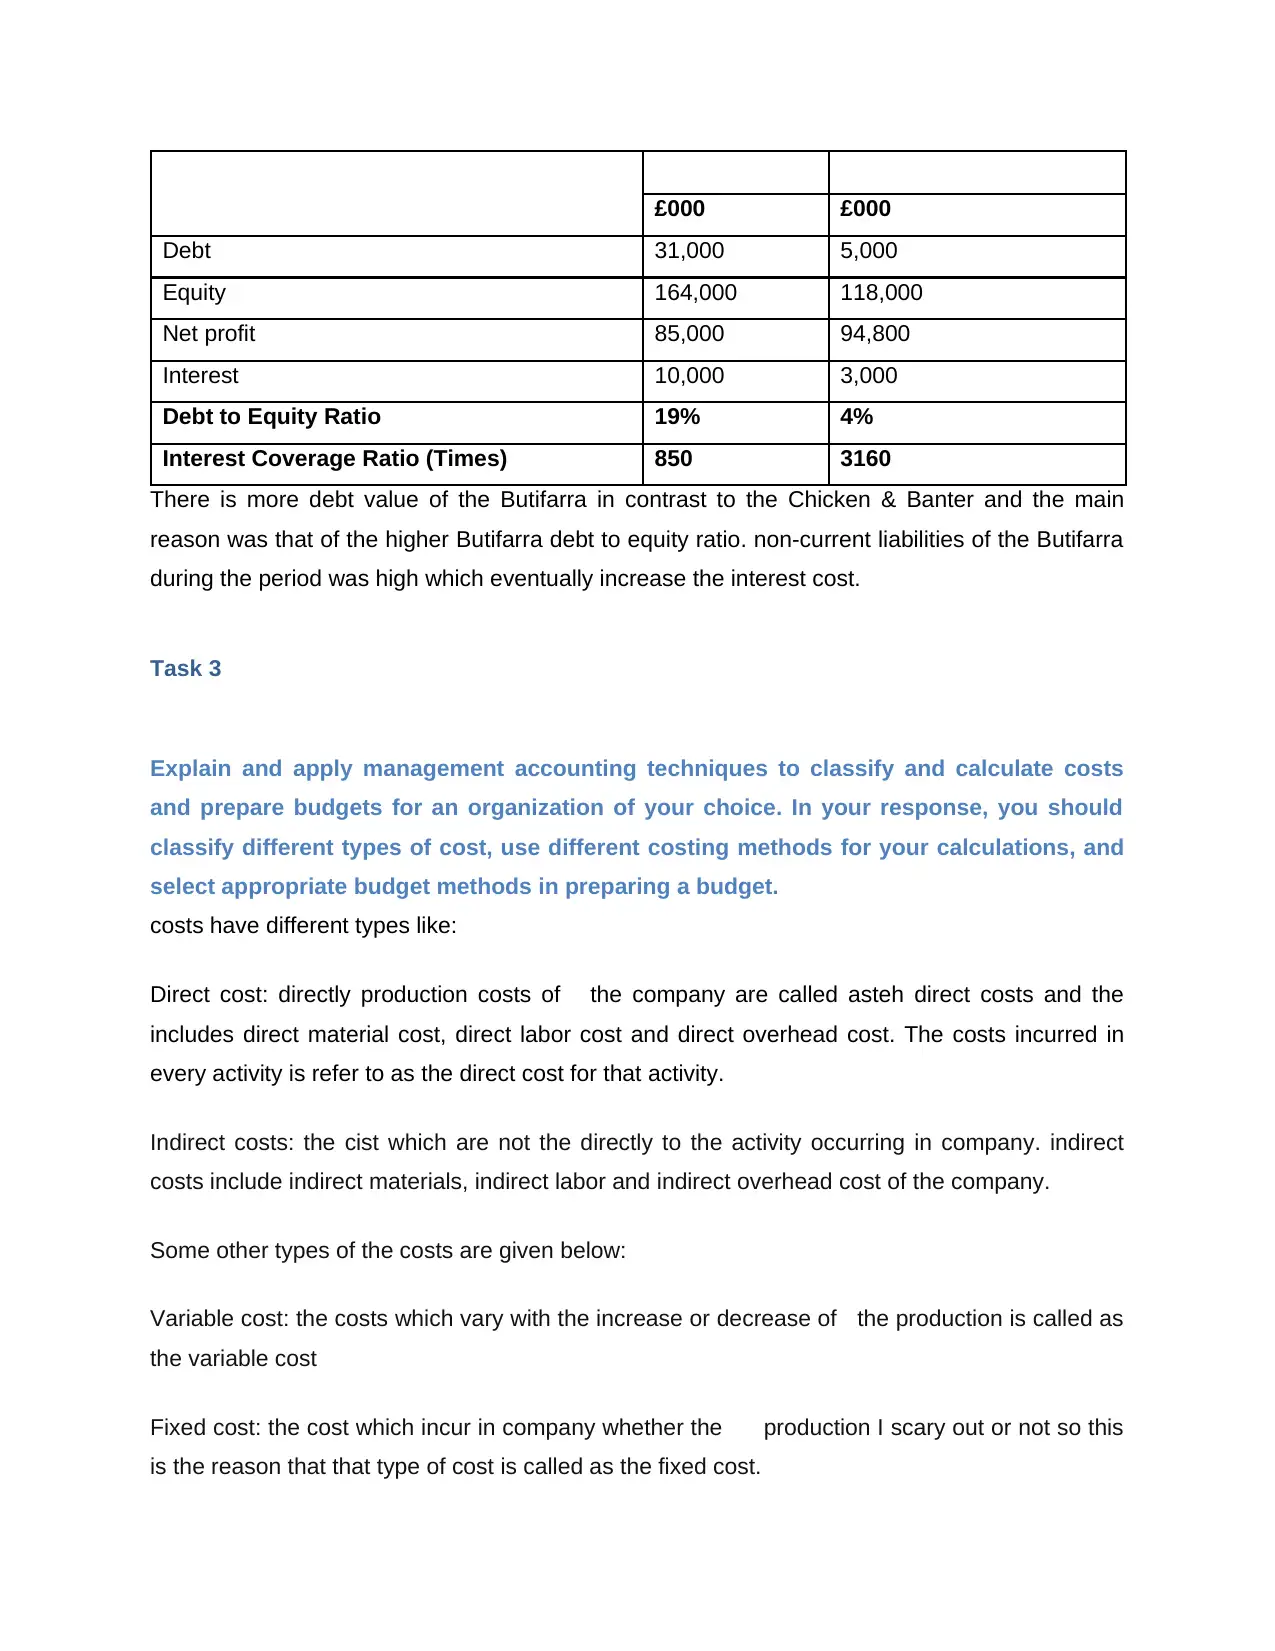
£000 £000
Debt 31,000 5,000
Equity 164,000 118,000
Net profit 85,000 94,800
Interest 10,000 3,000
Debt to Equity Ratio 19% 4%
Interest Coverage Ratio (Times) 850 3160
There is more debt value of the Butifarra in contrast to the Chicken & Banter and the main
reason was that of the higher Butifarra debt to equity ratio. non-current liabilities of the Butifarra
during the period was high which eventually increase the interest cost.
Task 3
Explain and apply management accounting techniques to classify and calculate costs
and prepare budgets for an organization of your choice. In your response, you should
classify different types of cost, use different costing methods for your calculations, and
select appropriate budget methods in preparing a budget.
costs have different types like:
Direct cost: directly production costs of the company are called asteh direct costs and the
includes direct material cost, direct labor cost and direct overhead cost. The costs incurred in
every activity is refer to as the direct cost for that activity.
Indirect costs: the cist which are not the directly to the activity occurring in company. indirect
costs include indirect materials, indirect labor and indirect overhead cost of the company.
Some other types of the costs are given below:
Variable cost: the costs which vary with the increase or decrease of the production is called as
the variable cost
Fixed cost: the cost which incur in company whether the production I scary out or not so this
is the reason that that type of cost is called as the fixed cost.
Paraphrase This Document
Need a fresh take? Get an instant paraphrase of this document with our AI Paraphraser
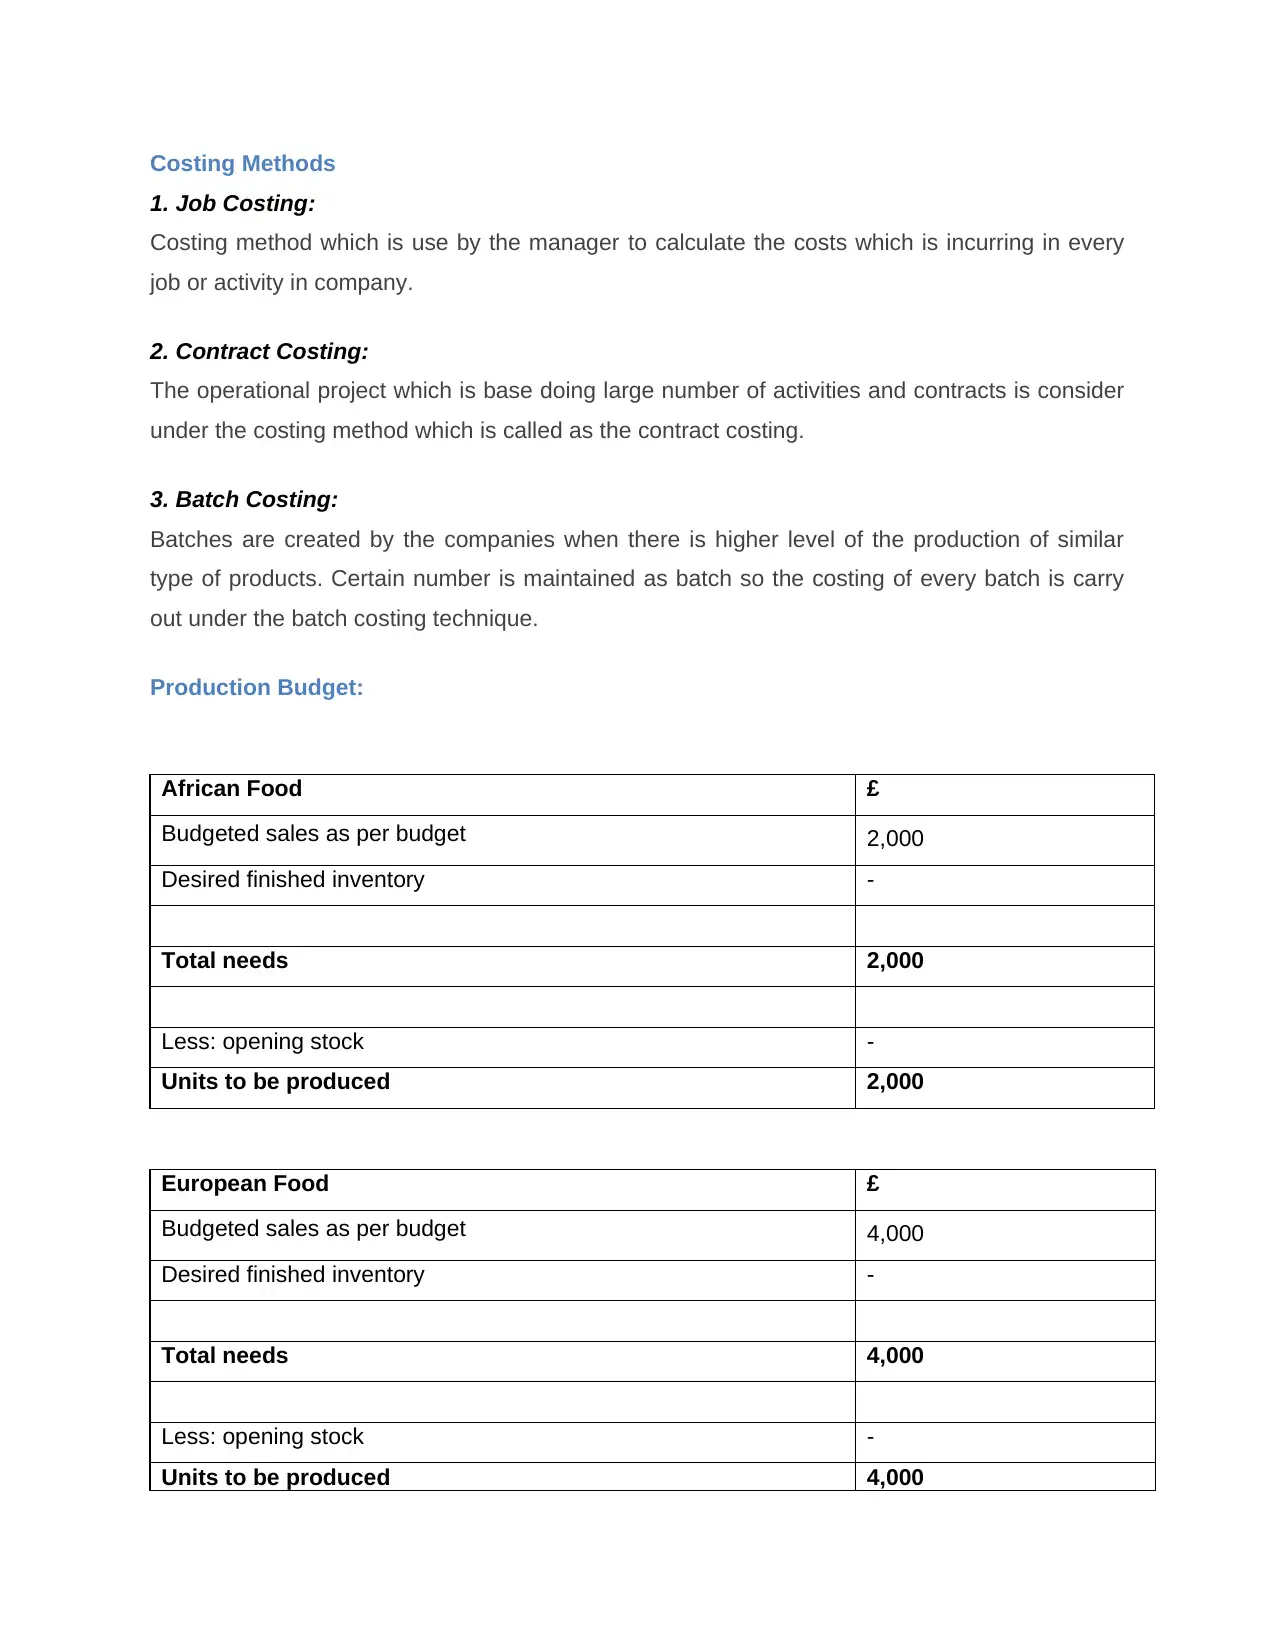
Costing Methods
1. Job Costing:
Costing method which is use by the manager to calculate the costs which is incurring in every
job or activity in company.
2. Contract Costing:
The operational project which is base doing large number of activities and contracts is consider
under the costing method which is called as the contract costing.
3. Batch Costing:
Batches are created by the companies when there is higher level of the production of similar
type of products. Certain number is maintained as batch so the costing of every batch is carry
out under the batch costing technique.
Production Budget:
African Food £
Budgeted sales as per budget 2,000
Desired finished inventory -
Total needs 2,000
Less: opening stock -
Units to be produced 2,000
European Food £
Budgeted sales as per budget 4,000
Desired finished inventory -
Total needs 4,000
Less: opening stock -
Units to be produced 4,000
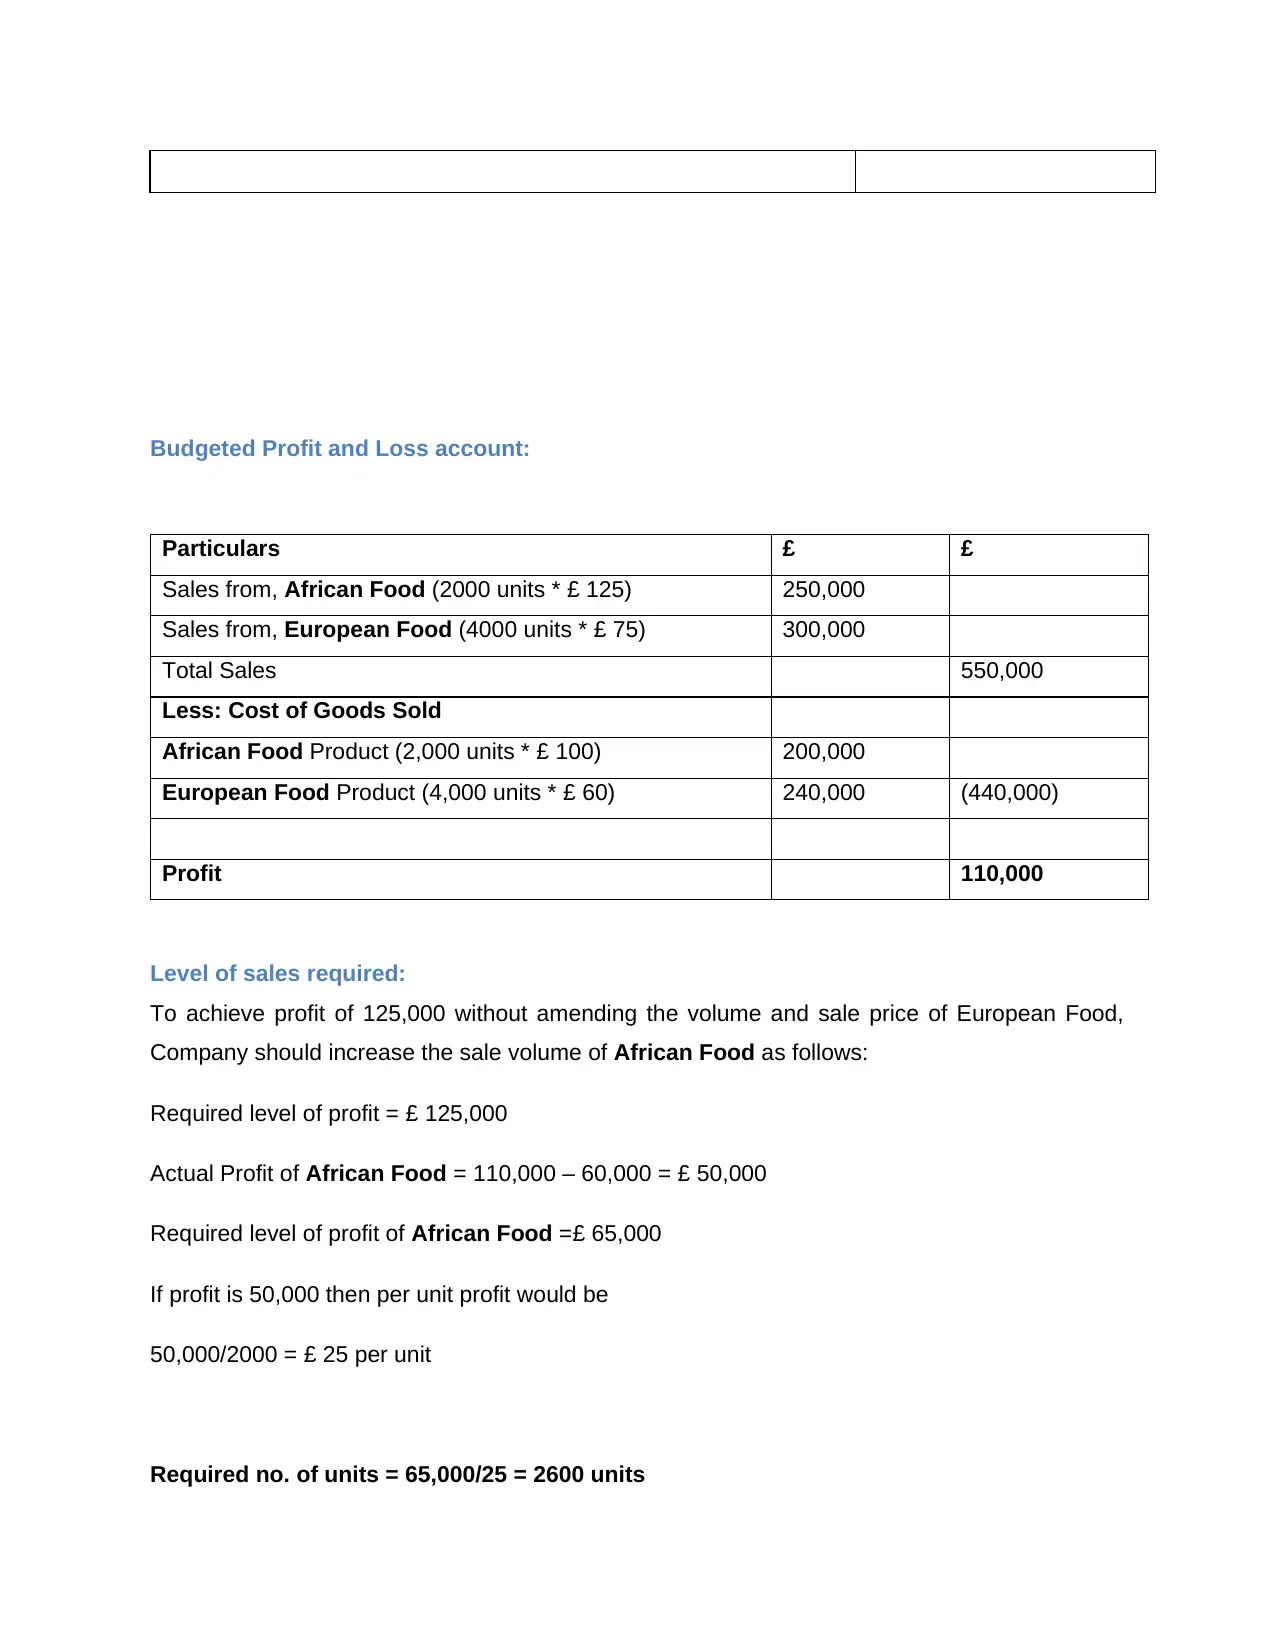
Budgeted Profit and Loss account:
Particulars £ £
Sales from, African Food (2000 units * £ 125) 250,000
Sales from, European Food (4000 units * £ 75) 300,000
Total Sales 550,000
Less: Cost of Goods Sold
African Food Product (2,000 units * £ 100) 200,000
European Food Product (4,000 units * £ 60) 240,000 (440,000)
Profit 110,000
Level of sales required:
To achieve profit of 125,000 without amending the volume and sale price of European Food,
Company should increase the sale volume of African Food as follows:
Required level of profit = £ 125,000
Actual Profit of African Food = 110,000 – 60,000 = £ 50,000
Required level of profit of African Food =£ 65,000
If profit is 50,000 then per unit profit would be
50,000/2000 = £ 25 per unit
Required no. of units = 65,000/25 = 2600 units
⊘ This is a preview!⊘
Do you want full access?
Subscribe today to unlock all pages.
Trusted by 1+ million students worldwide
1 out of 16
Related Documents


Your All-in-One AI-Powered Toolkit for Academic Success.
+13062052269
info@desklib.com
Available 24*7 on WhatsApp / Email
![[object Object]](/_next/static/media/star-bottom.7253800d.svg)
Unlock your academic potential
Copyright © 2020–2026 A2Z Services. All Rights Reserved. Developed and managed by ZUCOL.